Review
. 2018 Nov 22:1032:1-17.
doi: 10.1016/j.aca.2018.05.011. Epub 2018 May 4.

Early diagnosis of disease using microbead array technology: A review

Affiliations
Review

Early diagnosis of disease using microbead array technology: A review

Sanam Foroutan Parsa et al. Anal Chim Acta. .

Abstract

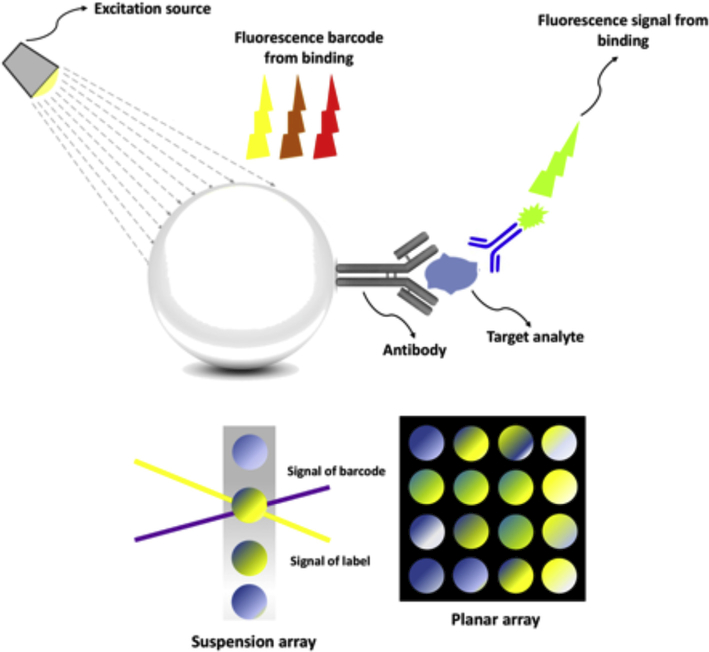
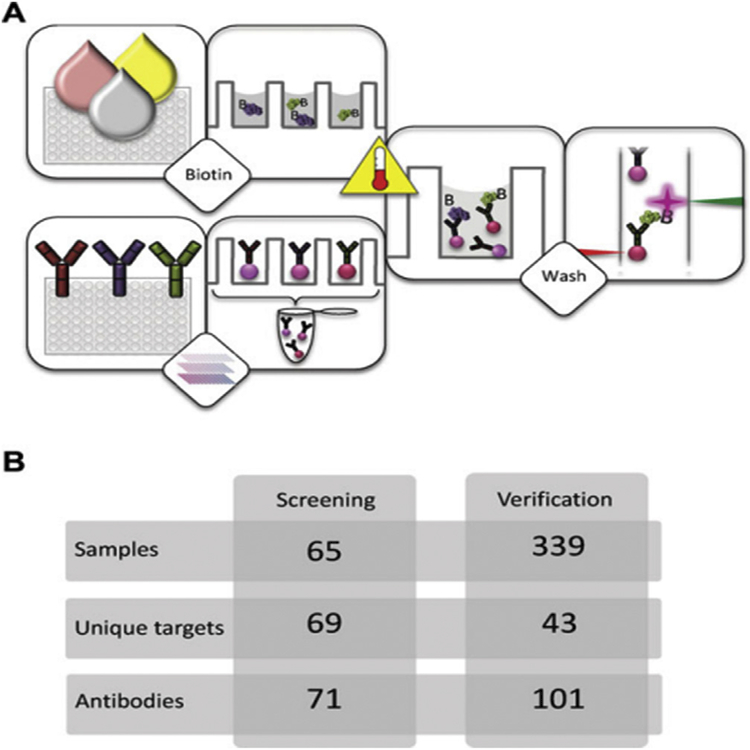
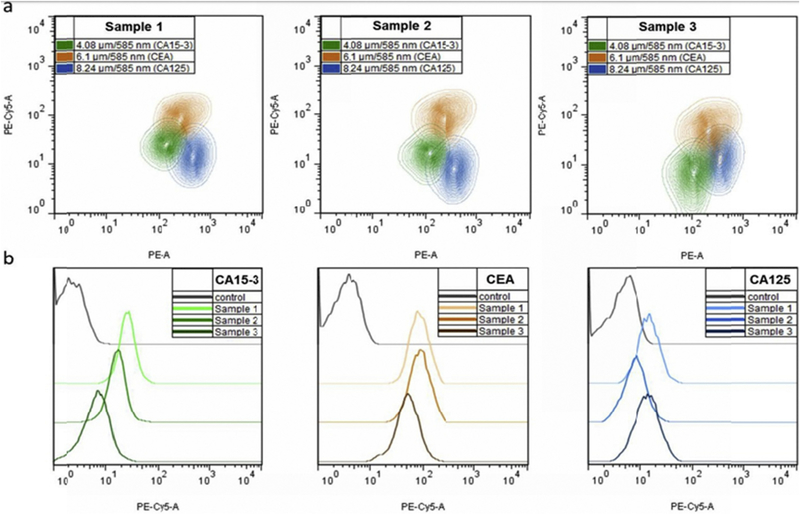
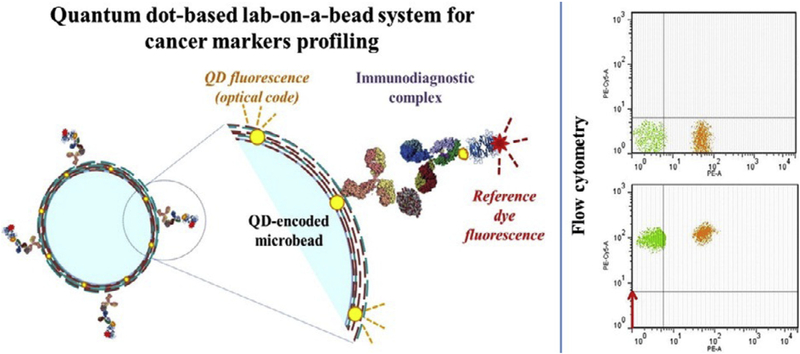
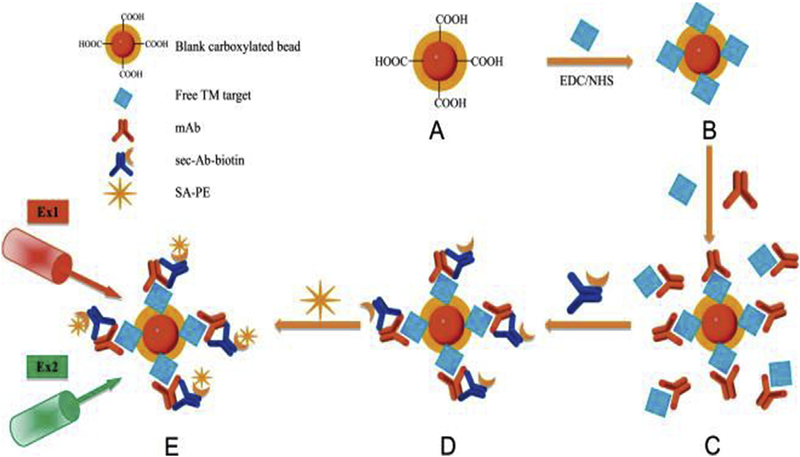
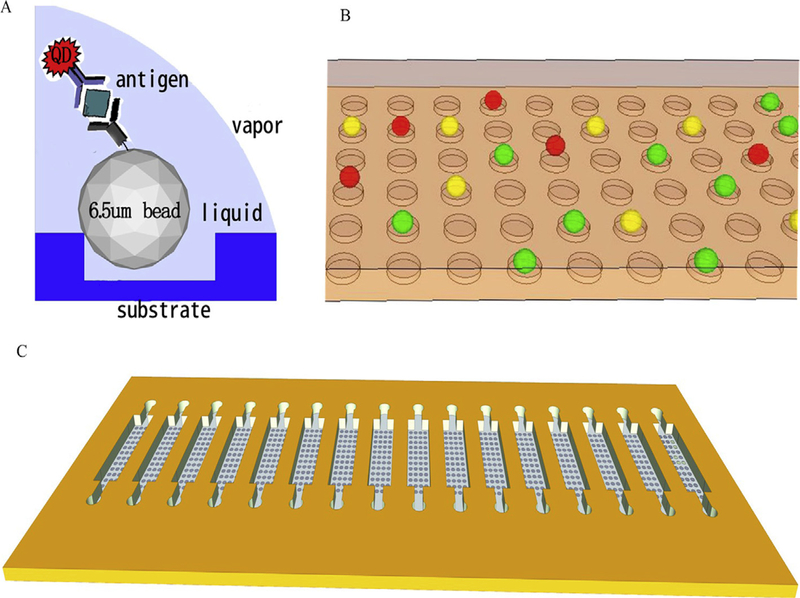
Early diagnosis of diseases (before they become advanced and incurable) is essential to reduce morbidity and mortality rates. With the advent of novel technologies in clinical laboratory diagnosis, microbead-based arrays have come to be recognized as an efficient approach, that demonstrates useful advantages over traditional assay methods for multiple disease-related biomarkers. Multiplexed microbead assays provide a robust, rapid, specific, and cost-effective approach for high-throughput and simultaneous screening of many different targets. Biomolecular binding interactions occur after applying a biological sample (such as blood plasma, saliva, cerebrospinal fluid etc.) containing the target analyte(s) to a set of microbeads with different ligand-specificities that have been coded in planar or suspension arrays. The ligand-receptor binding activity is tracked by optical signals generated by means of flow cytometry analysis in the case of suspension arrays, or by image processing devices in the case of planar arrays. In this review paper, we discuss diagnosis of cancer, neurological and infectious diseases by using optically-encoded microbead-based arrays (both multiplexed and single-analyte assays) as a reliable tool for detection and quantification of various analytes.

Keywords: Biomarker; Cancer; Early diagnosis; Infectious disease; Microbead array applications; Multiplexing; Neurological disease.


Figures

Fig. 1.
Fig. 1.. An epidemiological perspective of cancer progression.
Adapted from Ref. [11] With permission.
Fig. 2.
Fig. 2.
Schematic representation of A) planar array and B) suspension array.
Fig. 3.
Fig. 3.
Schematic illustration of principle of a bead-based assay.
Fig. 4.
Fig. 4.. Overview of workflow and study setup for MS detection in CSF.
(A) The suspension bead array technology enables the analysis of directly labeled samples for multiplex protein profiling. Crude samples are distributed in a randomized fashion in 96-well plates before they are diluted and labeled with biotin. In parallel, antibodies are immobilized on magnetic, color-coded beads and all bead identities are subsequently pooled to create an antibody array in suspension. The labeled samples are heat treated before their incubation with the bead array. After this, unbound proteins are washed away and a streptavidin-conjugated fluorophore added for target detection. In the used instrumentation, one laser is for the identity of beads and the other laser for the fluorophore used for detection of captured, biotinylated target proteins. (B) In this study, a small set of samples (n ¼ 65) was utilized for assay development and an initial screening with 71 antibodies targeting 69 unique proteins. At a later stage, a subset of 43 targets selected based on results from the screening were additionally analyzed in the set of 339 CSF samples. At this point, multiple antibodies per target were included, resulting in a 101-plex bead array. Adapted from Ref. [52]. With permission. (For interpretation of the references to color in this figure legend, the reader is referred to the Web version of this article.)
Fig. 5.
Fig. 5.. Study overview of MS detection in brain tissue.
Application of antibody suspension bead array technology to discover target protein candidate and evaluating them by immunofluorescence analysis of post-mortem brain tissue sections from MS patients. Adapted from Ref. [51] with permission.
Fig. 6.
Fig. 6.. Scheme of the magneto-sandwich immunoassay.
PMMs were modified with antibodies, AD biomarker capture, labeling with AuNPs and electrocatalytic recognition based on the hydrogen evolution reaction (HER) on screen-printed carbon electrodes (SPCEs) and a portable potentiostat. Adopted from Ref. [67] with permission.
Fig. 7.
Fig. 7.. Schematic diagram of sandwich immunoassay to detect Aβ1–42.
Adapted from Ref. [69] With permission.
Fig. 8.
Fig. 8.. Schematic diagram of nano-bio chips for cytokines.
(a) SEM photomicrograph of beads in anisotropically etched silicon chip. (b) Chip (iv) is fitted between double-sided adhesive layer (ii) and cover slip (i) with laminate layers (ii, v, vi) included to direct fluid flow through PMMA base (vii) and inlet and outlet ports (vii). (c) Sealed LOC assembly. (d) Fluorescent image of beads after immunoassay including negative controls as imaged with 1 s of CCD camera integration (exposure) time. Adapted from Ref. [91] With permission. (For interpretation of the references to color in this figure legend, the reader is referred to the Web version of this article.)
Fig. 9.
Fig. 9.. Flow cytometry analysis of multiplexed QDebead microarrays used for simultaneous detection of CA 15e3, CE A, and CA 125, markers of female reproductive system tumors, in clinical serum samples.
(a) Simultaneous detection of three cancer markers in three individual serum samples from patients with different stages of breast cancer. (b) Comparative histograms indicating different levels of each target marker in three analyzed serum samples in comparison with the control sample. FSC-A, bead size; PE-A bead optical code (QD 585 nm fluorescence); PE Cy5-A, the amount of the cancer marker detected (fluorescence of the streptavidin-Tri-COLOR visualization label). Reprinted from [93] With permission. (For interpretation of the references to color in this figure legend, the reader is referred to the Web version of this article.)
Fig. 10.
Fig. 10.. QD-encoded microbeads for multiplexed cancer diagnosis.
(a) Schematic of the designed lab-on-a-bead system for detection of prostate-specific antigen (PSA). (b) Flow cytometry dot plots of the suspension array based on two microbead populations carrying different fluorescent nanocrystal codes for simultaneous detection of free PSA and total PSA in clinical serum samples. A green (PE-A-negative, FITC-A-positive) microbead population was used for free PSA detection, and an orange (PE-A-positive, FITC-A-negative) microbead population was used for the total PSA detection Panel A Detection of two PSA forms in the serum of a healthy female donor (the PSA-negative control). Panel B. Detection of two PSA forms in the serum of a prostate cancer-positive male patient (the PSA-positive control). Red fluorescence shifts of different intensities in the PE-Cy5-A channel indicate binding of different amounts of PSA. Reprinted from [95] With permission. (For interpretation of the references to color in this figure legend, the reader is referred to the Web version of this article.)
Fig. 11.
Fig. 11.. Schematic diagram of the detection procedures for simultaneous and combined detection of multiple tumor markers (TMs) for prostate cancer (PC by suspension array.
(A) The carboxylated blank red and orange fluorescent beads were activated. (B) The free TM target was coupled onto activated carboxylated beads by EDC/NHS to prepare bead probe set as the beadeTM compound. (C)The TM on the bead and the free TM were allowed to compete for their corresponding mAb in solutions; then, the beadeTMemAb compound was formed. (D)Sec-Ab- biotin was added to capture them Ab in solutions and to result in the beadeTMemAbesec-Ab-biotin compound. (E) Streptavidin-R-phycoerythrin (SA-PE) was added into the solutions to couple with the compound by biotin-avidin interaction. The beadeTMemAbesec-Ab-biotineSA-PE compound was ready for laser beaming. The red laser (Ex1) was used to excite the red and orange fluorescent dyes within the beads to recognize their unique coded numbers. Simultaneously, a green laser (Ex2) was used to excite SA-PE that combined on the bead surface. The available fluorescent signalsdMFIs that only combined on the beads were recorded and analyzed by xPONENT™ 3.0 software. Reprinted from [96] With permission. (For interpretation of the references to color in this figure legend, the reader is referred to the Web version of this article.)
Fig. 12.
Fig. 12.. Schematic illustrations of bead-based assay system for sensitive detection of three biomarkers using QDs.
(A) Reaction principle for the bead-based sandwich assay; (B) Three colors of beads after reaction in the chip; (C) The structure of the chip. Reprinted from [100] With permission. (For interpretation of the references to color in this figure legend, the reader is referred to the Web version of this article.)

References

    1. Dudley JT, et al. , Personalized medicine: from genotypes, molecular phenotypes and the quantified self, towards improved medicine, Pac Symp Biocomput (2015) 342–346. - PMC - PubMed
    1. Chen R, Snyder M, Systems biology: personalized medicine for the future? Curr. Opin. Pharmacol 12 (5) (2012) 623–628. - PMC - PubMed
    1. Srinivas PR, Kramer BS, Srivastava S, Trends in biomarker research for cancer detection, Lancet Oncol 2 (11) (2001) 698–704. - PubMed
    1. Yigitbası T, Abuelzein E, Multiplex immunoassay and bead based multiplex. Trends in immunolabelled and related techniques, InTech, Rijeka (2012) 351–360.
    1. Fritzler MJ, Fritzler ML, Microbead-based technologies in diagnostic auto-antibody detection, Expert Opinion on Medical Diagnostics 3 (1) (2009) 81e89. - PubMed

LinkOut - more resources