Review
. 2018 Oct;34(10):790-805.
doi: 10.1016/j.tig.2018.07.003. Epub 2018 Aug 22.

Enter the Matrix: Factorization Uncovers Knowledge from Omics

Affiliations
Review

Enter the Matrix: Factorization Uncovers Knowledge from Omics

Genevieve L Stein-O'Brien et al. Trends Genet. 2018 Oct.

Abstract

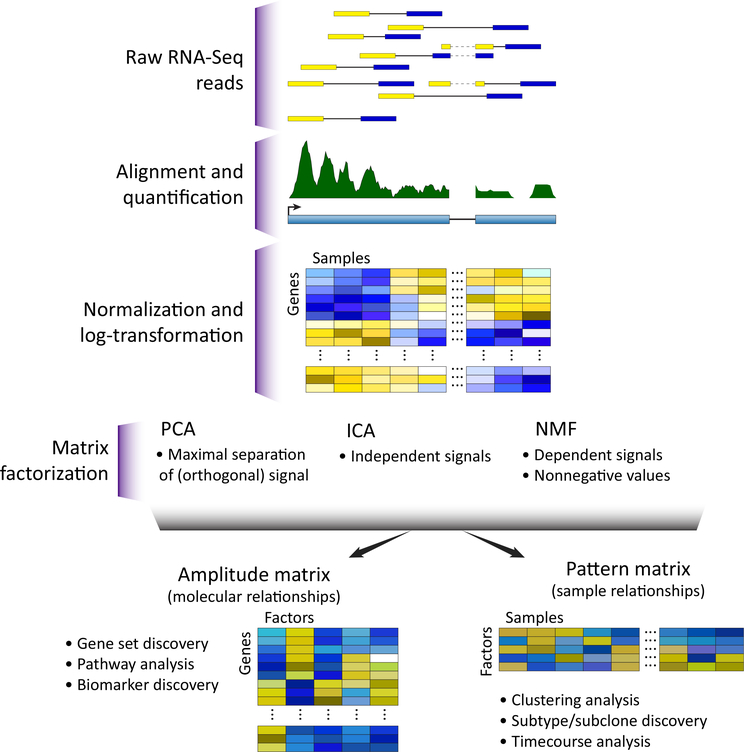
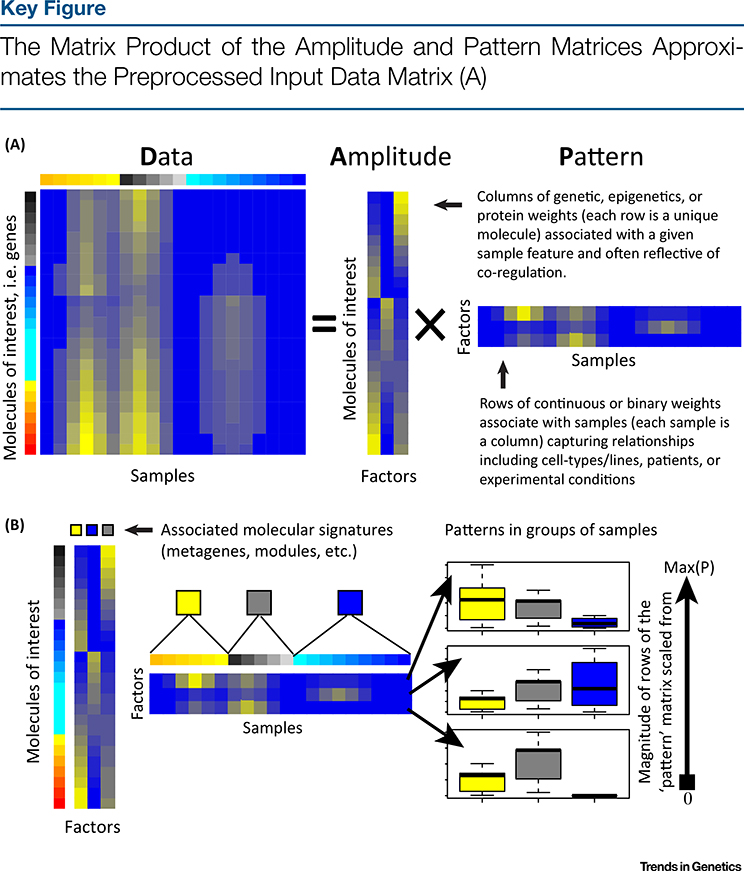
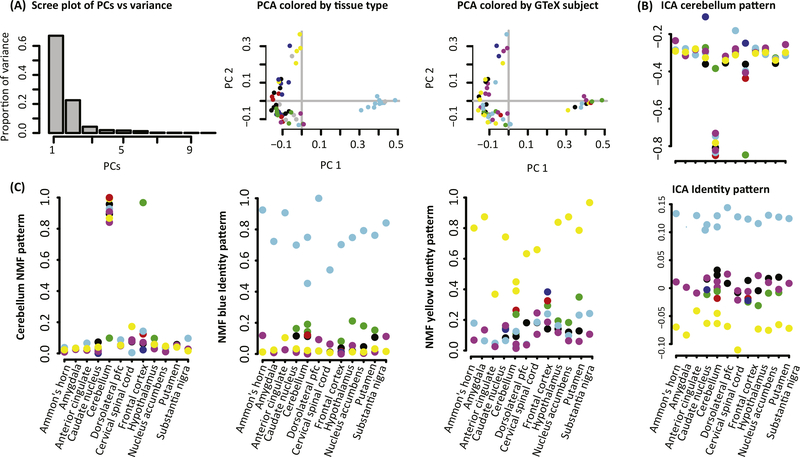
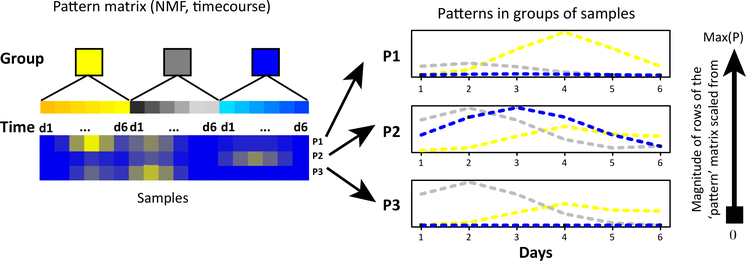
Omics data contain signals from the molecular, physical, and kinetic inter- and intracellular interactions that control biological systems. Matrix factorization (MF) techniques can reveal low-dimensional structure from high-dimensional data that reflect these interactions. These techniques can uncover new biological knowledge from diverse high-throughput omics data in applications ranging from pathway discovery to timecourse analysis. We review exemplary applications of MF for systems-level analyses. We discuss appropriate applications of these methods, their limitations, and focus on the analysis of results to facilitate optimal biological interpretation. The inference of biologically relevant features with MF enables discovery from high-throughput data beyond the limits of current biological knowledge - answering questions from high-dimensional data that we have not yet thought to ask.

Keywords: deconvolution; dimension reduction; genomics; matrix factorization; single cell; unsupervised learning.


Figures

Figure 1.
Figure 1.. Omics Technologies Yield a Data Matrix That Can Be Interpreted through MF.
The data matrixfrom omics has each sample as a column and each observed molecular value (expression counts, methylation Levels, protein concentrations, etc.) as a row. This data matrix is preprocessed with techniques specific to each measurement technology, and is then input to a matrix factorization (MF) technique for analysis. MF decomposes the preprocessed data matrix into two related matrices that represent its sources of variation: an amplitude matrix and a pattern matrix. The rows of the amplitude matrix quantify the sources of variation among the molecular observations, and the columns of the pattern matrix quantify the sources of variation among the samples. Abbreviations: ICA, independent component analysis; NMF, non-negative matrix factorization; PCA, principal component analysis.
Figure 2.
Figure 2.
The number of columns of the amplitude matrix equals the number of rows in the pattern matrix, and represents the number of dimensions in the low-dimensional representation of the data. Ideally, a pair of one column in the amplitude matrix and the corresponding row of the pattern matrix represents a distinct source of biological, experimental, and technical variation in each sample (called complex biological processes, CBPs). (B) The values in the column of the amplitude matrix then represent the relative weights of each molecule in the CBP, and the values in the row of the pattern matrix represent its relative role in each sample. Plotting of the values of each pattern for a pre-determined sample grouping (here indicated by yellow, grey, and blue) in a boxplot as an example of a visualization technique for the pattern matrix. Abbreviation: Max(P), maximum value of each row of the pattern matrix.
Figure 3.
Figure 3.. Comparison of Pattern Matrix From Matrix Factorization (MF) in Postmortem Tissue Samples from GTEx.
(A) PCA finds factors in rows of the pattern matrix that can be ranked by the amount of variation that they explain in the data, as illustrated in a scree plot. PCA analyses typically plot the first two principal components (PCs; rows of the pattern matrix) to assess sample clustering. Points are colored by tissue type annotations from GTEx (left), where Ammon’s horn refers to the hippocampus, and donor (right). In GTEx data, the cerebellum (light blue) and first cervical spinal cord (yellow) cluster separately from all other brain tissues, but no separation between individuals is observed. (B) ICA finds factors associated with independent sources of variation, and therefore cannot be ranked in a scree plot. The relative absolute value of the magnitude of each element in the pattern matrix indicates the extent to which that sample contributes to the corresponding source of variation. The sign of the values indicate over- or underexpression in that factor depending on the sign of the corresponding gene weights in the amplitude matrix. As a result, the values can be plotted on the y axis against known covariates on the x axis to directly interpret the relationship between samples. When applied to GTEx, we observe one pattern associated with cerebellum, another pattern that has large positive values for one donor and large negative values for another donor, and eight other patterns associated with other sources ofvariation (supplemental information online). (C) NMF findsfactors that are both non-negative and not ranked by relative importance, similarly to ICA. The value of the pattern matrix indicates the extent to which each sample contributes to an inferred source of variation and is associated with overexpression of corresponding gene weights in the amplitude matrix. Values of the pattern matrix can be plotted similarly to ICA. When applied to GTEx, we observe one pattern associated with cerebellum, two more patterns associated with the two donors that were assigned to a single pattern in ICA, and seven other patterns associated with other sources of variation (supplemental information online). Abbreviations: GTEx, Genotype-Tissue Expression (GTEx) project; ICA, independent component analysis; NMF, non-negative matrix factorization; PCA, principal component analysis.
Figure 4.
Figure 4.. Samples Correspond to Timepoints; the Rows of the Pattern Matrix Can Be Plotted as a Function of Time and Sample Condition To Infer the Dynamics of Complex Biological Processes (CBPs).
Abbreviations: d1-d6, days 1–6; max(P), maximum value of each row of the pattern matrix; NMF, non-negative matrix factorization; P1–3, patterns 1–3.
Figure 5.
Figure 5.. The Amplitude Matrix from Matrix Factorization (MF) Can Be Used to Derive Data-Driven Molecular Signatures Associated with a Complex Biological Process (CBP).
The columns of the amplitude matrix contain continuous weights describing the relative contribution of a molecule to a CBP (center panel; indicated by the orange, purple, and green boxes). The resulting molecular signature can be analyzed in a new dataset to determine the samples in which each previously detected CBP occurs, and thereby assess function in a new experiment. This comparison may be done by comparing the continuous weights in each column of the amplitude matrix directly to the new dataset (left). The amplitude matrix may also be used in traditional gene-set analysis (right). Traditional gene-set analysis using literature curated gene sets can be performed on the values in each column of the amplitude matrix to identify whether a CBP is occurring in the input data. Data-driven gene sets can also be defined from this matrix directly using binarization, and used in place of literature-curated gene sets to query CBPs in a new dataset. Sets defined from molecules with high weights in the amplitude matrix comprise signatures akin to many curated gene-set resources, whereas molecules that are most uniquely associated with a specific factor (purple box) may be biomarkers. Abbreviations, KO, knockout; WT, wild type.

References

    1. Bell G et al. (2009) Beyond the data deluge. Science 323, 1297–1298 - PubMed
    1. Sagoff M (2012) Data deluge and the human microbiome project. Issues Sci. Technol 28 http://issues.org/28-4/sagoff-3/
    1. Alter O (2006) Discovery of principles of nature from mathematical modeling of DNA microarray data. Proc. Natl. Acad. Sci. U. S. A 103, 16063–16064 - PMC - PubMed
    1. Heyn P et al. (2015) Introns and gene expression: cellular constraints, transcriptional regulation, and evolutionary consequences. Bioessays 37, 148–154 - PMC - PubMed
    1. Ochs MF and Fertig EJ (2012) Matrix factorization for transcriptional regulatory network inference. IEEE Symp. Comput. Intell. Bioinforma. Comput. Biol. Proc 2012, 387–396 - PMC - PubMed

Publication types

MeSH terms