Case Reports
. 2018 Oct 1;215(10):2567-2585.
doi: 10.1084/jem.20180628. Epub 2018 Aug 24.

Life-threatening influenza pneumonitis in a child with inherited IRF9 deficiency

Affiliations
Case Reports

Life-threatening influenza pneumonitis in a child with inherited IRF9 deficiency

Nicholas Hernandez et al. J Exp Med. .

Abstract

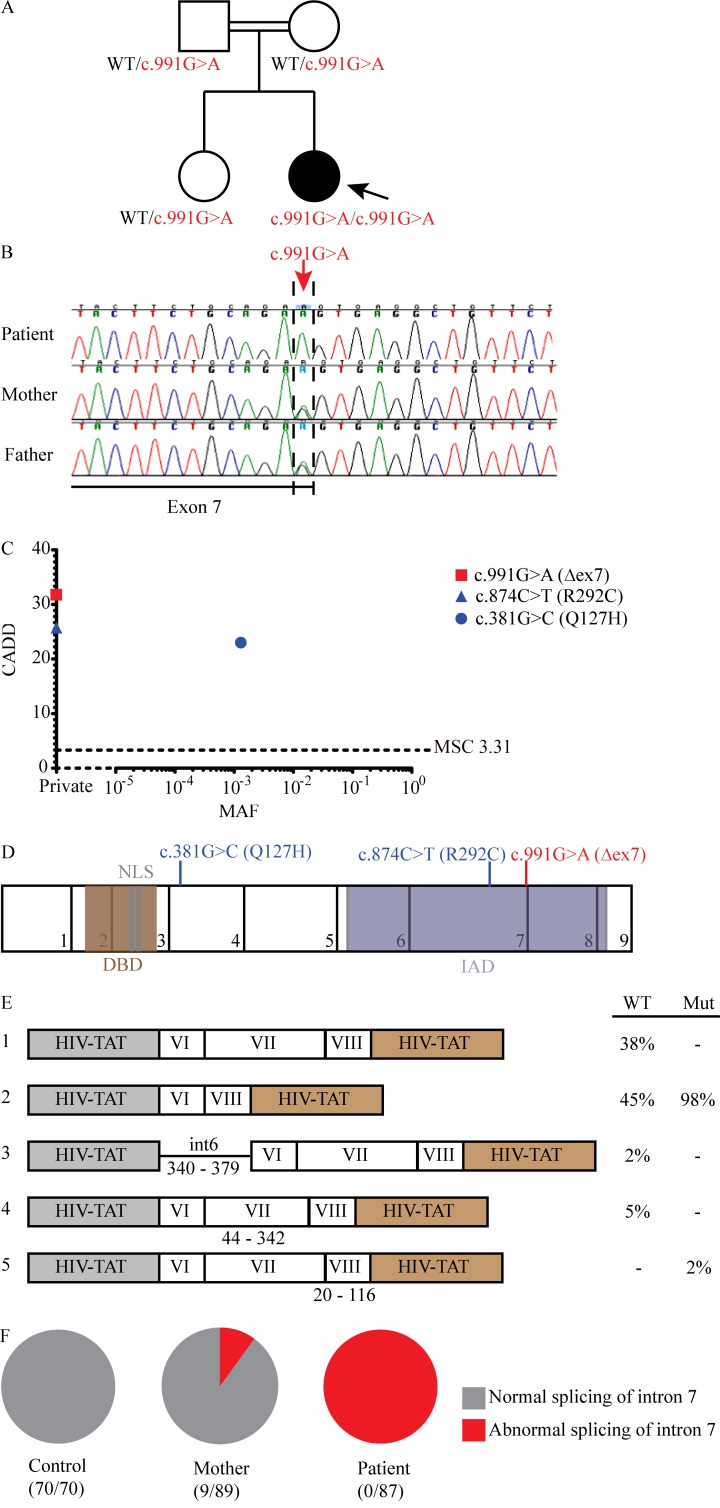
Life-threatening pulmonary influenza can be caused by inborn errors of type I and III IFN immunity. We report a 5-yr-old child with severe pulmonary influenza at 2 yr. She is homozygous for a loss-of-function IRF9 allele. Her cells activate gamma-activated factor (GAF) STAT1 homodimers but not IFN-stimulated gene factor 3 (ISGF3) trimers (STAT1/STAT2/IRF9) in response to IFN-α2b. The transcriptome induced by IFN-α2b in the patient's cells is much narrower than that of control cells; however, induction of a subset of IFN-stimulated gene transcripts remains detectable. In vitro, the patient's cells do not control three respiratory viruses, influenza A virus (IAV), parainfluenza virus (PIV), and respiratory syncytial virus (RSV). These phenotypes are rescued by wild-type IRF9, whereas silencing IRF9 expression in control cells increases viral replication. However, the child has controlled various common viruses in vivo, including respiratory viruses other than IAV. Our findings show that human IRF9- and ISGF3-dependent type I and III IFN responsive pathways are essential for controlling IAV.


Figures

Figure 1.
Figure 1.
A private IRF9 variant alters mRNA splicing in a child with severe influenza pneumonitis. (A) Pedigrees of the IRF9-deficient family. The double lines connecting the parents indicate consanguinity. The proband is indicated by an arrow. Filled shapes indicate affected individuals while open shapes identify unaffected individuals. (B) Chromatograms demonstrating c.991G>A mutation in patient PBMC-derived DNA (red arrow). (C) Population genetics of homozygous coding missense and predicted loss-of-function IRF9 mutations taken from GnomAD and in-house cohorts. The patient’s variant is private and shown in red, while two other variants, shown in blue, were also identified in our cohort. (D) Schematic illustration of the IRF9 gene. The exons are numbered 1–9, and regions corresponding to functionally significant domains are colored brown (for the DNA-binding domain, DBD), gray (nuclear localization sequence, NLS), or purple (IAD). Patient mutation indicated in red; other mutations indicated in blue. (E) IRF9 transcripts (left panel) and relative frequencies (right panel) produced during exon trapping in U2A cells. The results are representative of two independent experiments. (F) cDNA sequencing to detect the splicing of IRF9 mRNA from F-SV40 cells. Numbers of total and abnormal clones sequenced are indicated. Results representative of two experiments.
Figure 2.
Figure 2.
Impact of IRF9 Δex7 on IFN receptor-proximal signaling. (A) qRT-PCR measuring of IRF9 mRNA levels in PBMCs from the patient, her mother, and a healthy control with two probes—one probe spanning intron 7, and a second probe spanning intron 1. Representative results of four independent experiments are shown. (B) Top: WB of endogenous IRF9 in patient F-SV40 cells; GAPDH was used as a loading control. Bottom: STAT and phospho-STAT (pSTAT) levels were also assessed following stimulation with 1,000 U/ml of either IFN–α2b or –γ for 0.5 h on F-SV40 cells from two healthy controls (C1 and C2), the IRF9-deficient patient (IRF9−/−), her mother (IRF9+/−), a STAT1-deficient patient (STAT1−/−), a STAT2-deficient patient (STAT2−/−), an IFNGR2-deficient patient (IFNGR2−/−), and an IRF7-deficient patient (IRF7−/−). Representative results of five independent experiments are shown. (C) WB of IRF9 in IRF9-deficient U2A cells stably transfected with indicated variants (green: variants reported to be loss-of-function in in vitro assays, blue: variants found in-house, red: patient). GAPDH was used as loading control. Representative results of four independent experiments are shown. (D) WB of IRF9 in patient F-SV40 cells stably transfected with indicated variants. GAPDH was used as loading control. Representative results of four independent experiments are shown. (E) WB analysis of IRF9 localization in F-SV40 cells from two healthy controls (C1 and C2), the IRF9-deficient patient (IRF9−/−), her mother (IRF9+/−), a STAT1-deficient patient (STAT1−/−), a STAT2-deficient patient (STAT2−/−), an IFNGR2-deficient patient (IFNGR2−/−), and an IRF7-deficient patient (IRF7−/−). GAPDH and LaminA/C were used as loading controls. Representative results of three independent experiments are shown. (F) Reporter assays of ISRE or GAS-dependent firefly luciferase tested in U2A cells stimulated with 1,000 U/ml of either IFN-α2b or -γ for 16 h after being stably transfected with indicated variants (green: variants reported to be loss-of-function in in vitro assays, blue: variants found in-house, red: patient). The specific response to IFN stimulation was calculated by the ratio of firefly luciferase reporter gene activity to constitutively expressed renilla luciferase activity (RLU, relative luciferase ratio). Representative results of three independent experiments are shown. (G) EMSA analysis of ISRE and GAS binding by IFN-stimulated B-LCLs from three healthy controls (C1, C2, and C3), the IRF9-deficient patient (IRF9−/−), her mother (IRF9+/−), a STAT1-deficient patient (STAT1−/−), a STAT2-deficient patient (STAT2−/−), and an IRF7-deficient patient (IRF7−/−). Representative results of three independent experiments are shown.
Figure 3.
Figure 3.
Impaired ISG induction in IRF9-deficient cells. (A) Transcription levels of MX1, IFIT1, IFIT3, and CXCL9 assessed by qRT-PCR on F-SV40 cells treated with 1,000 U/ml of IFN–α2b, -β, or –γ for 2 h. Cells were from three healthy controls (C1, C2, and C3), an IRF9-deficient patient (IRF9−/−), her mother (IRF9+/−), and STAT1-deficient (STAT1−/−), STAT2-deficient (STAT2−/−), IRF7-deficient (IRF7−/−), and IFNGR1-deficient (IFNGR1−/−) patients. Representative results of four independent experiments are shown. (B and C) WB of MX1 and IFIT3 on F-SV40 (B) or B-LCL (C) cells treated with 1,000 U/ml of IFN–α2b for various time points. GAPDH was used as a loading control. Representative results of three independent experiments are shown. (D) Transcription levels of MX1, IFIT1, IFIT3, and CXCL9 assessed by qRT-PCR of B-LCL cells treated with 1,000 U/ml of IFN–α2b, -β, or –γ for 2 h. Cells were from three healthy controls (T1, T2, and T3), an IRF9-deficient patient (IRF9−/−), her mother (IRF9+/−), and STAT1-deficient (STAT1−/−), STAT2-deficient (STAT2−/−), IRF7-deficient (IRF7−/−), and IFNGR2-deficient (IFNGR2−/−) patients. Representative results four independent experiments are shown. (E) Transcription levels of MX1, IFIT1, and CXCL9 assessed by qRT-PCR in F-SV40 cells from a healthy control (C1), P’s mother (IRF9+/−), and P (IRF9−/−) stably transfected with luciferase as a control (Luc) or indicated IRF9 variants (WT: WT IRF9, green: reported loss-of-function variants, blue: variants found in-house, red: patient variant). Cells were stimulated with 1,000 U/ml of IFN-α2b, -β, or -γ for 2 or 8 h. Representative results of four independent experiments are shown. (F) Similar to E, qRT-PCR analysis of MX1, IFIT1, and CXCL9 expression in parental HT1080 cells and U2A cells. Cells were stimulated with 1,000 U/ml of IFN-α2b, -β, or -γ for 2 or 8 h. Representative results of three independent experiments are shown.
Figure 4.
Figure 4.
Transcriptomic analysis of ISGs in IRF9-deficient cells. mRNA-seq analysis of primary fibroblasts (A and C) and B-LCLs (B and D) from three healthy controls (C1, C2, and C3), the IRF9-deficient patient (IRF9−/−). Cells were treated with 1,000 U/ml IFN–α2b for 2 h. Heatmaps (A and B) show log2 FC values of all ISGs that were found to be differentially regulated (≥1.5-fold) in all three control subjects relative to unstimulated cells. Bar graphs (C and D) quantify the number of ISGs that were differentially regulated (≥1.5-fold) compared with unstimulated cells in healthy controls or the IRF9-deficient patient. (E) Shown are Δ log2 fold change values of a subset of ISGs that were found to be induced ≥1.5-fold (linear scale) in B-LCL cells (upper panels) or primary fibroblasts (lower panels) of the IRF9-deficient patient upon in vitro stimulation with IFN-α. To select this subset of ISGs, the IFN-α2b–induced genes in the healthy controls identified in the mRNA-seq analysis were used. In the IRF9-deficient patient, these genes were first passed through a filter by querying the gene identifiers against the interferome database and by retaining genes that were responsive to in vitro IFN stimulation. ISGs that failed to be induced at least 1.5-fold (linear scale) in patient cells were excluded. The retained ISGs were stratified in three groups of less (Δ less than −0.585), similar (−0.585 < Δ < 0.585), and higher (Δ > 0.585) induced genes relative to the average responses in the healthy control subjects. The numbers of genes in each group are shown in brackets. ***, significant differences at P < 0.0001 by the Kruskal-Wallis test. (F) Log2 FC of induced ISGs in IRF9-deficient B-LCLs (upper panels) or primary fibroblasts (lower panels) and their corresponding values in healthy donors. (G) Network analysis of a subset of highly inducible (> fivefold linear scale) ISGs among control subjects’ B-LCLs and their responsiveness in the IRF9-deficient patient. Biological pathway and physical interactions are depicted as blue and red lines, respectively. 1.5 FC was used as the cut-off to distinguish responsive (red circle) and nonresponsive (blue circle) ISGs. The highly inducible ISGs that were used for query are shaded in yellow.
Figure 5.
Figure 5.
Crippled control of IAV and other viral infections in IRF9-deficient cells. (A) IAV titers in F-SV40 unstimulated (left) or pretreated (right) with 1,000 U/ml IFN-α2 for 16 h, followed by infection with (A/H1N1/CA/2009) IAV at MOI = 1. Mean ± SD (n = 3) is shown. Cells from three healthy controls were included (C1, C2, and C3), as well as those from the IRF9-deficient patient (IRF9−/−), her mother (IRF9+/−), and STAT1-deficient (STAT1−/−), STAT2-deficient (STAT2−/−), and IRF7-deficient (IRF7−/−) patients. Four independent experiments (mean ± SD) are shown. (B) VSV titers in F-SV40 cells unstimulated (left) or pretreated (right) with 1,000 U/ml IFN-α2 for 16 h, followed by infection with VSV at MOI = 3. Four independent experiments (mean ± SD) are shown. (C) IAV titers in stably transfected F-SV40 cells unstimulated (left) or pretreated (right) with 1,000 U/ml IFN-α2 for 16 h, followed by infection with IAV at MOI = 1. Cells were from a healthy control (C1), a STAT1-deficient patient (STAT1−/−), P (IRF9−/−), and P’s cells stably transfected with luciferase or WT IRF9 (gray), variants reported to be loss-of-function in in vitro assays (green), variants found in-house (blue), or the patient’s variant (red). Three independent experiments (mean ± SD) are shown. (D) VSV titers in stably transfected F-SV40 cells unstimulated (left) or pretreated (right) with 1,000 U/ml IFN-α2 for 16 h, followed by infection with VSV at MOI = 3. Four independent experiments (mean ± SD) are shown. (E) Percentage of RSV-infected (GFP+) F-SV40 cells at 24 and 48 h after infection. Cells from three healthy controls were included (C1, C4, and C5, black), as well as those from the IRF9-deficient patient (IRF9−/−, red), and cells from STAT1-deficient (STAT1−/−), STAT2-deficient (STAT2−/−), and IRF7-deficient (IRF7−/−) patients. Three independent experiments (mean ± SD) are shown. (F) Mean fluorescence intensity (MFI) of RSV-infected (GFP+) F-SV40 cells at 24 and 48 h after infection. Three independent experiments (mean ± SD) are shown. (G) Percentage of PIV-infected (GFP+) F-SV40 cells at 24 and 48 h after infection. Three independent experiments (mean ± SD) are shown. (H) MFI of PIV-infected (GFP+) F-SV40 cells at 24 and 48 h after infection. Three independent experiments (mean ± SD) are shown. MFI of GFP+ cells in individual samples were normalized to the averaged MFI of the three healthy controls at 24 h after infection in F and H.
Figure 6.
Figure 6.
IRF9 is required for optimal control of viral infections. (A) WB confirms the efficiency of RNAi of IRF9 or MAVS in primary dermal fibroblasts. (B–F) Primary human dermal fibroblasts previously transfected with the indicated siRNA (negative control, IRF9, MAVS) were tested for control of HRV, RSV, and PIV. Cells were infected with HRV-A16 at MOI of 10 (B), RSV at MOI of 0.5 (C and D), or PIV3 at MOI of 0.1 (E and F). Relative HRV transcripts (B) were measured by qRT-PCR, and values were normalized to the siNeg control. Percentage of infected cells (C and E) and relative virus per infected cell (D and F) were measured by flow cytometric analysis of GFP+ cells. MFI of GFP+ cells in individual samples were normalized to negative control at 24 h (D and F). Shown are the mean ± SD of six (B–F) experiments. *, P < 0.05; **, P < 0.01, by Kruskal-Wallis test.

References

    1. Abdul-Sater A.A., Majoros A., Plumlee C.R., Perry S., Gu A.D., Lee C., Shresta S., Decker T., and Schindler C.. 2015. Different STAT Transcription Complexes Drive Early and Delayed Responses to Type I IFNs. J. Immunol. 195:210–216. 10.4049/jimmunol.1401139 - DOI - PMC - PubMed
    1. Adzhubei I.A., Schmidt S., Peshkin L., Ramensky V.E., Gerasimova A., Bork P., Kondrashov A.S., and Sunyaev S.R.. 2010. A method and server for predicting damaging missense mutations. Nat. Methods. 7:248–249. 10.1038/nmeth0410-248 - DOI - PMC - PubMed
    1. Anders S., Pyl P.T., and Huber W.. 2015. HTSeq--a Python framework to work with high-throughput sequencing data. Bioinformatics. 31:166–169. 10.1093/bioinformatics/btu638 - DOI - PMC - PubMed
    1. Andrews S.2010. FastQC: a quality control tool for high throughput sequence data. Available at: http://www.bioinformatics.babraham.ac.uk/projects/fastqc.
    1. Arimoto K.I., Löchte S., Stoner S.A., Burkart C., Zhang Y., Miyauchi S., Wilmes S., Fan J.B., Heinisch J.J., Li Z., et al. . 2017. STAT2 is an essential adaptor in USP18-mediated suppression of type I interferon signaling. Nat. Struct. Mol. Biol. 24:279–289. 10.1038/nsmb.3378 - DOI - PMC - PubMed

Publication types

MeSH terms

Substances