. 2018 Oct 1;217(10):3354-3367.
doi: 10.1083/jcb.201804185. Epub 2018 Aug 24.

Atlastins remodel the endoplasmic reticulum for selective autophagy

Affiliations

Atlastins remodel the endoplasmic reticulum for selective autophagy

Jin Rui Liang et al. J Cell Biol. .

Erratum in

Abstract

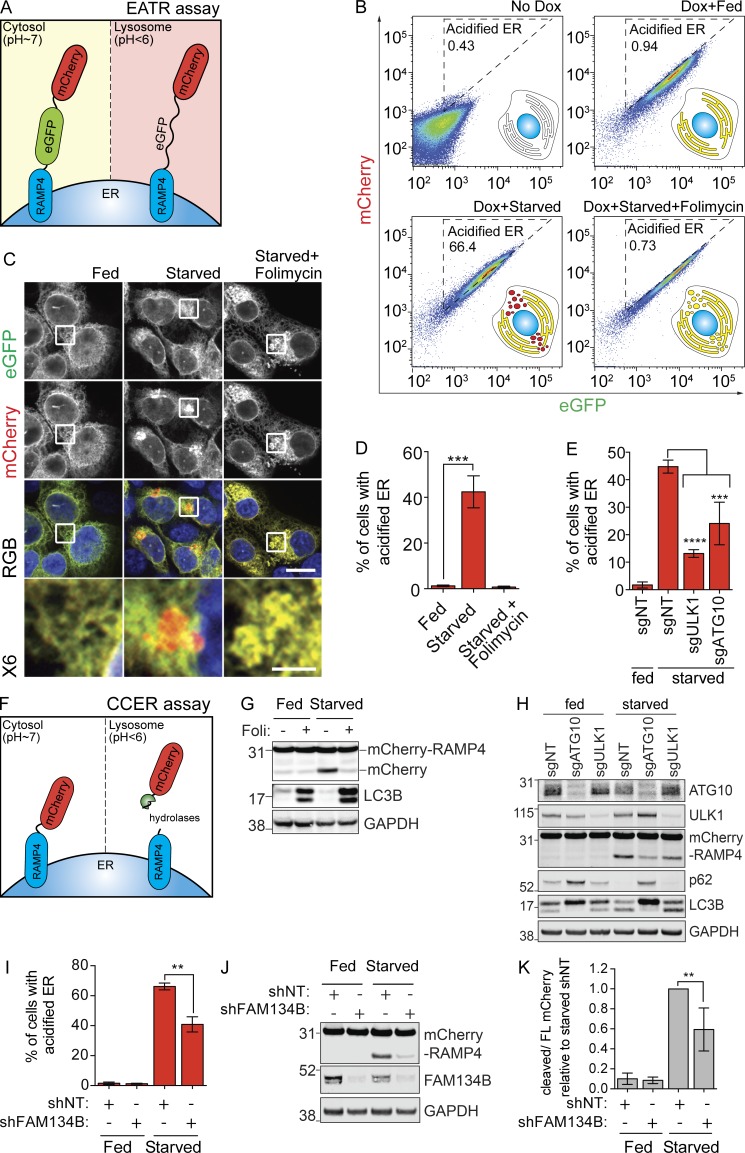
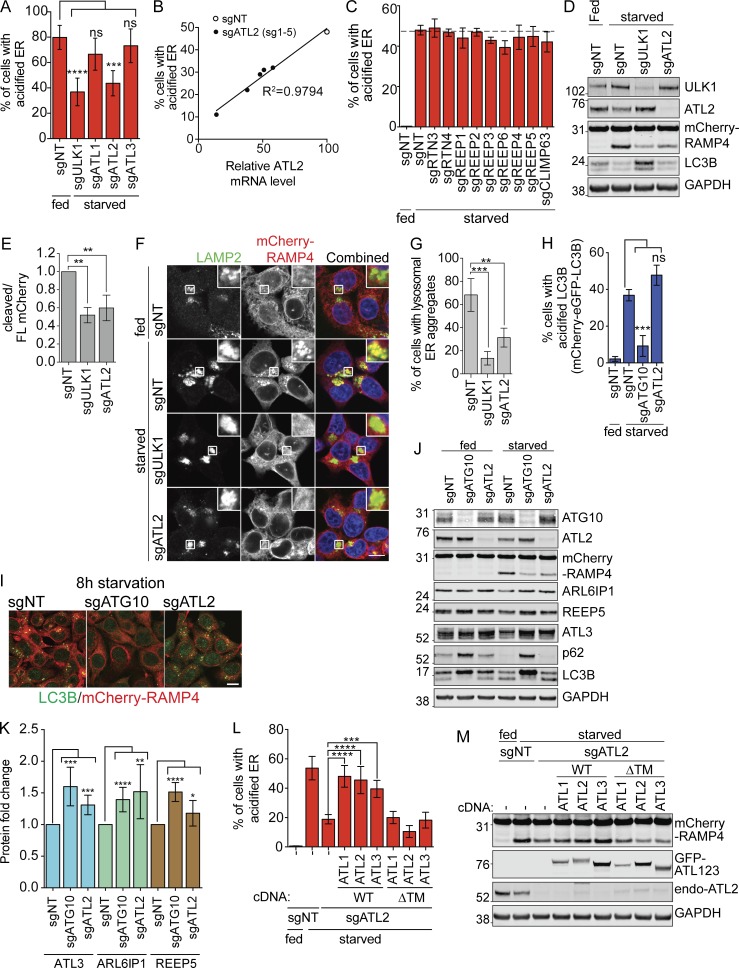
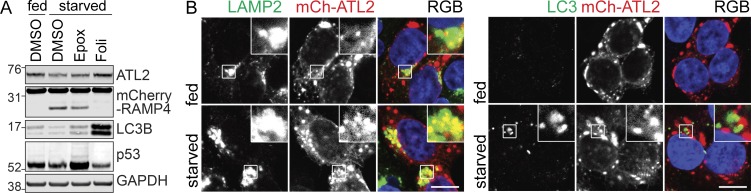
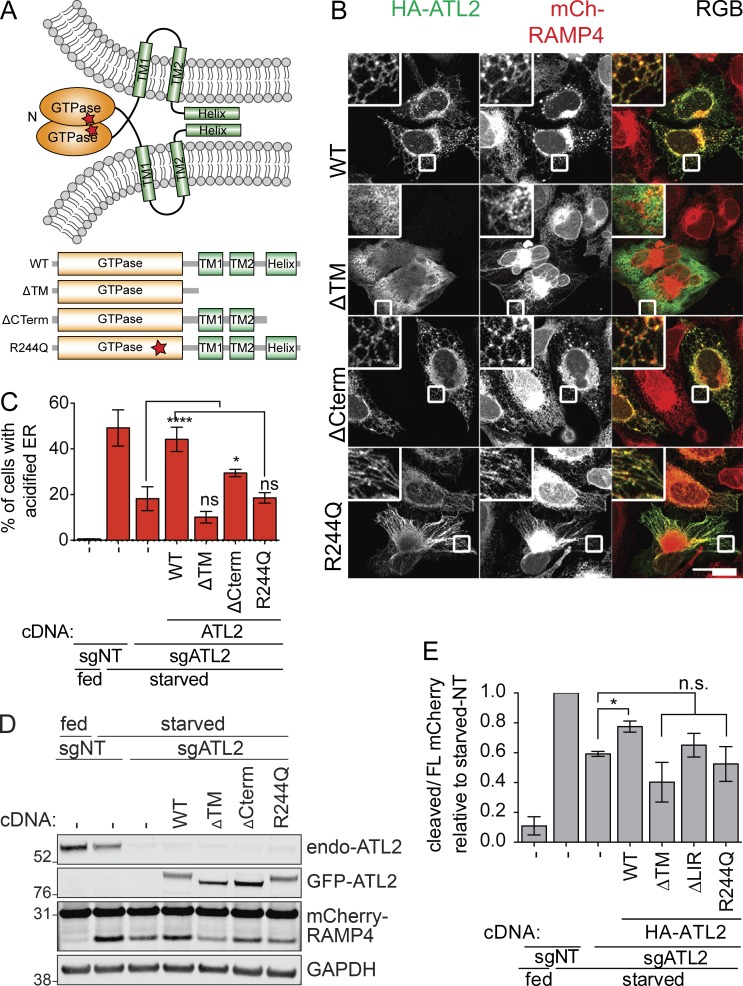
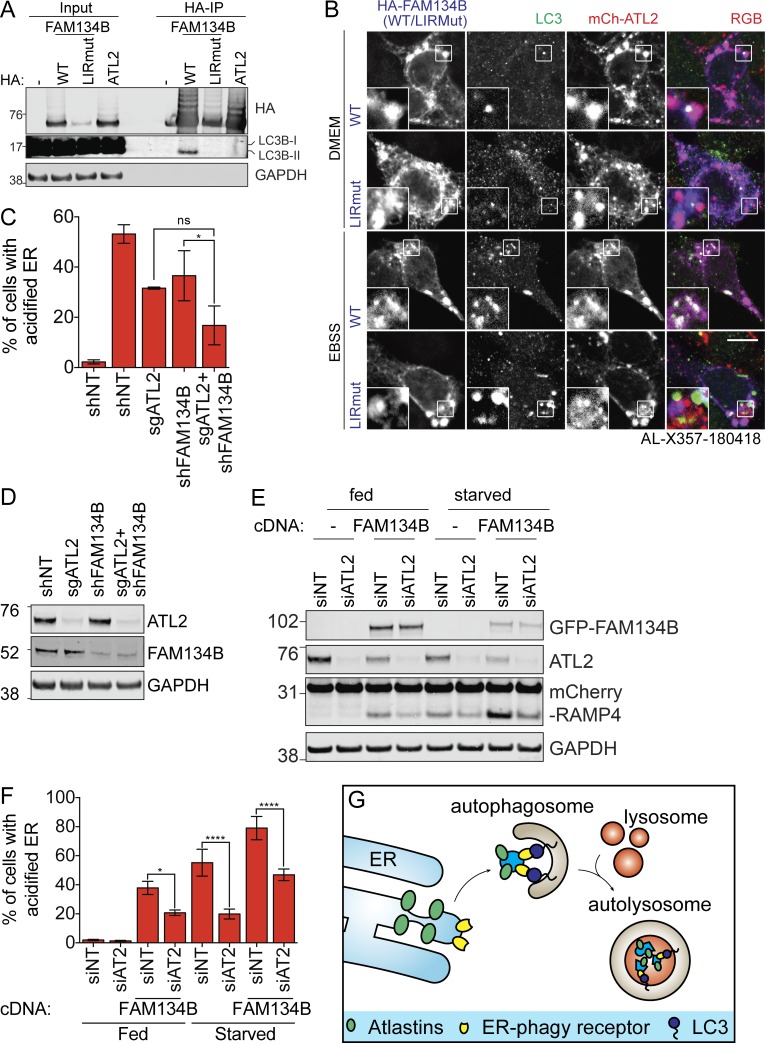
Specific receptors are required for the autophagic degradation of endoplasmic reticulum (ER), known as ER-phagy. However, little is known about how the ER is remodeled and separated for packaging into autophagosomes. We developed two ER-phagy-specific reporter systems and found that Atlastins are key positive effectors and also targets of ER-phagy. Atlastins are ER-resident GTPases involved in ER membrane morphology, and Atlastin-depleted cells have decreased ER-phagy under starvation conditions. Atlastin's role in ER-phagy requires a functional GTPase domain and proper ER localization, both of which are also involved in ER architecture. The three Atlastin family members functionally compensate for one another during ER-phagy and may form heteromeric complexes with one another. We further find that Atlastins act downstream of the FAM134B ER-phagy receptor, such that depletion of Atlastins represses ER-autophagy induced by the overexpression of FAM134B. We propose that during ER-phagy, Atlastins remodel ER membrane to separate pieces of FAM134B-marked ER for efficient autophagosomal engulfment.


Figures

Figure 1.
Figure 1.
Development of sensitive and quantitative assays to measure ER-phagy. (A) Schematic of the EATR assay. eGFP is quenched as a result of low pH-induced protonation, causing a switch from GFP+/mCherry+ to GFP/mCherry+ during ER-phagy. (B) HCT116 cells expressing the EATR reporter were starved for 16 h with or without folimycin (100 nM). Cells within the acidified ER gate are undergoing ER-phagy. Reducing lysosomal acidification with folimycin moves cells out of the acidified ER gate. (C) EATR HCT116 cells were starved and fixed to visualize eGFP quenching. Scale bar represents 20 µm. Insets represent sixfold enlargement of the boxed area. Scale bar for sixfold enlarged images represent 5 µm. (D) Flow cytometry measurement of B is quantified as percentage of cells with more acidified ER. Data presented as mean ± SD of three biological replicates. P value indicates two-tailed unpaired t test (***, P < 0.0005). (E) EATR CRISPRi HCT116 cells stably expressing sgRNAs were starved for 16 h. Data presented as mean ± SD of three biological replicates. P value indicates one-way ANOVA with Dunnett’s multiple comparisons test (***, P < 0.001; ****, P < 0.0001). (F) Schematic illustration of the CCER assay. ER targeted for degradation results in the lysosomal cleavage of the mCherry tag from RAMP4, resulting in the formation of a smaller, mCherry-only product that can be resolved by Western blotting. (G) CCER HCT116 cells were starved for 16 h in EBSS ± folimycin before Western blotting. (H) CCER CRISPRi HCT116 cells stably expressing sgRNAs were starved for 16 h before Western blotting. (I) EATR HCT116 cells were transfected with shRNA targeting FAM134B and starved for 16 h before FACS measurement. Data presented as mean ± SD of three biological replicates. P value indicates two-tailed unpaired t test (**, P < 0.001). (J) CCER HCT116 cells were treated as in I, harvested, and subjected to Western blot. (K) Quantification of data in J. Data presented as mean ± SD of three biological replicates. P value indicates two-tailed unpaired t test (**, P < 0.01).
Figure 2.
Figure 2.
EATR and CCER detect changes in ER-phagy induced by manipulation of a known ER-phagy receptor. (A) EATR CRISPRi HCT116 cells expressing the indicated proteins were starved before FACS measurement. Data presented as mean ± SD of three biological replicates. P value indicates one-way ANOVA with Dunnett’s multiple comparisons test (***, P < 0.001; ****, P < 0.0001). (B) The extent of ER-phagy inhibition of five different sgRNAs targeting ATL2 correlates with the knockdown efficiency of each sgRNA as determined by qRT-PCR. (C) EATR CRISPRi HCT116 cells transduced with the indicated sgRNAs were starved for 16 h before FACS measurement. Data presented as mean ± SD of three biological replicates. No statistically significant difference is determined between sgNT and the other sgRNAs based on one-way ANOVA with Dunnett’s multiple comparisons test. (D) CCER CRISPRi HCT116 cells transduced with sgULK1 or sgATL2 were starved, harvested, and Western blotted. (E) Quantification of data from D. Data presented as mean ± SD of three biological replicates. P value indicates one-way ANOVA with Dunnett’s multiple comparisons test (**, P < 0.005). (F) CCER CRISPRi HCT116 cells stably transduced with the indicated sgRNAs were starved and immunostained with LAMP2 antibody. Scale bar represents 20 µm. Inset represents 3× enlargement of boxed area. (G) Quantification of data from F. An average of 100 cells per condition were quantified from three biological replicates. P value indicates one-way ANOVA with Dunnett’s multiple comparisons test (**, P < 0.01; ***, P < 0.001). (H) mCherry-eGFP-LC3B CRISPRi HCT116 cells were starved for 8 h and measured by FACS similar to the EATR assay. Data presented as mean ± SD of three biological replicates. P value indicates one-way ANOVA with Dunnett’s multiple comparisons test (***, P < 0.0005). (I) CCER CRISPRi HCT116 cells expressing sgATG10 or sgATL2 were starved for 8 h, fixed, and immunostained with LC3B antibody. Scale bar represents 20 µm. (J) HCT116 cells expressing sgATG10 or sgATL2 were starved for 16 h, harvested, and subjected to Western blot. (K) Quantification of data from J. Data presented as mean ± SD of n > 4 biological replicates. P value indicates unpaired, two-tailed student t test (*, P < 0.05; **, P < 0.005; ***, P < 0.001; ****, P < 0.0001). (L) EATR CRISPRi HCT116 cells expressing sgATL2 and the indicated ATL constructs were starved for flow cytometry. Data presented as mean ± SD of three biological replicates. P value indicates one-way ANOVA with Dunnett’s multiple comparisons test (***, P < 0.005; ****, P < 0.0001). (M) CCER CRISPRi HCT116 cells expressing sgATL2 and the indicated overexpression constructs were treated the same as L, harvested, and subjected to Western blot.
Figure 3.
Figure 3.
ATL2 is degraded via the autolysosomal pathway. (A) CCER HCT116 cells were starved with either epoxomicin or folimycin, harvested, and subjected to Western blot. (B) HCT116 cells stably expressing mCherry-ATL2 were starved, fixed, and immunostained with LAMP2 and LC3B antibodies. Scale bar represents 10 µm. Inset represents threefold enlargement.
Figure 4.
Figure 4.
ER-phagy requires a functional ATL GTPase domain and proper ER localization. (A) Schematic of the topology and dimerization of ATLs to facilitate ER membrane fusion. The different truncations and mutations of ATL2 tested are shown underneath. (B) Functional characterization of ATL2 domains required for ER morphology maintenance. U2-OS cells expressing mCherry-RAMP4 were transiently transfected with the indicated ATL2 constructs. Cells were then fixed and immunostained for HA-epitope. Scale bar represents 40 µm. Inset represents 3× enlargement of the boxed areas. (C) EATR CRISPRi HCT116 cells stably expressing sgATL2 and cDNA of ATL2 mutant variants were starved and analyzed by flow cytometry. Data presented as mean ± SD of three biological replicates. P value indicates one-way ANOVA with Dunnett’s multiple comparisons test (*, P < 0.05; ****, P < 0.0001). (D) CCER CRISPRi HCT116 cells with sgATL2 and stably expressing the indicated ATL2 mutants were starved, harvested, and subjected to Western blot. (E) Quantification of data from D. Data presented as mean ± SD of three biological replicates. P value indicates one-way ANOVA with Dunnett’s multiple comparisons test (*, P < 0.05).
Figure 5.
Figure 5.
ATLs act downstream of FAM134B-mediated ER-phagy. (A) HEK293T cells transiently expressing the indicated constructs were treated with folimycin for 2 h before HA immunoprecipitation and Western blotting. (B) HCT116 cells expressing mCherry-ATL2 and HA-FAM134B (WT or LIRMut) were starved, fixed, and immunostained with HA and LC3B antibodies. Scale bar represents 10 µm. Inset represents threefold enlargement of boxed area. (C) EATR HCT116 CRISPRi cells stably depleted of the indicated proteins were starved before flow cytometry measurement. Data presented as mean ± SD of three biological replicates. P value indicates one-way ANOVA with Tukey’s multiple comparisons test (*, P < 0.05). (D) EATR HCT116 CRISPRi cells in C were harvested at basal state (fed condition) to assess FAM134B and ATL2 depletions. (E) CCER HCT116 CRISPRi cells stably expressing HA-FAM134B and sgATL2 were starved and Western blotted. (F) EATR CRISPRi HCT116 cells stably expressing GFP-FAM134B and sgATL2 were starved and measured by flow cytometry. Data presented as mean ± SD of three biological replicates. P value indicates one-way ANOVA with Tukey’s multiple comparisons test (*, P < 0.05; ****, P < 0.0001). (G) We propose that FAM134B acts as the ER-phagy receptor that recruits LC3 to the ER, whereas ATLs are involved in ER membrane remodeling to deliver FAM134B-marked ER to the autophagosomes.

References

    1. Bastide A., Peretti D., Knight J.R.P., Grosso S., Spriggs R.V., Pichon X., Sbarrato T., Roobol A., Roobol J., Vito D., et al. . 2017. RTN3 Is a Novel Cold-Induced Protein and Mediates Neuroprotective Effects of RBM3. Curr. Biol. 27:638–650. 10.1016/j.cub.2017.01.047 - DOI - PMC - PubMed
    1. Brodsky J.L. 2012. Cleaning up: ER-associated degradation to the rescue. Cell. 151:1163–1167. 10.1016/j.cell.2012.11.012 - DOI - PMC - PubMed
    1. Dikic I. 2017. Proteasomal and Autophagic Degradation Systems. Annu. Rev. Biochem. 86:193–224. 10.1146/annurev-biochem-061516-044908 - DOI - PubMed
    1. Fumagalli F., Noack J., Bergmann T.J., Cebollero E., Pisoni G.B., Fasana E., Fregno I., Galli C., Loi M., Soldà T., et al. . 2016. Translocon component Sec62 acts in endoplasmic reticulum turnover during stress recovery. Nat. Cell Biol. 18:1173–1184. 10.1038/ncb3423 - DOI - PubMed
    1. Gegg M.E., and Schapira A.H.. 2011. PINK1-parkin-dependent mitophagy involves ubiquitination of mitofusins 1 and 2: Implications for Parkinson disease pathogenesis. Autophagy. 7:243–245. 10.4161/auto.7.2.14332 - DOI - PMC - PubMed

Publication types

MeSH terms