

Pitx2 maintains mitochondrial function during regeneration to prevent myocardial fat deposition
- PMID: 30143541
- PMCID: PMC6176932
- DOI: 10.1242/dev.168609
Pitx2 maintains mitochondrial function during regeneration to prevent myocardial fat deposition
Abstract
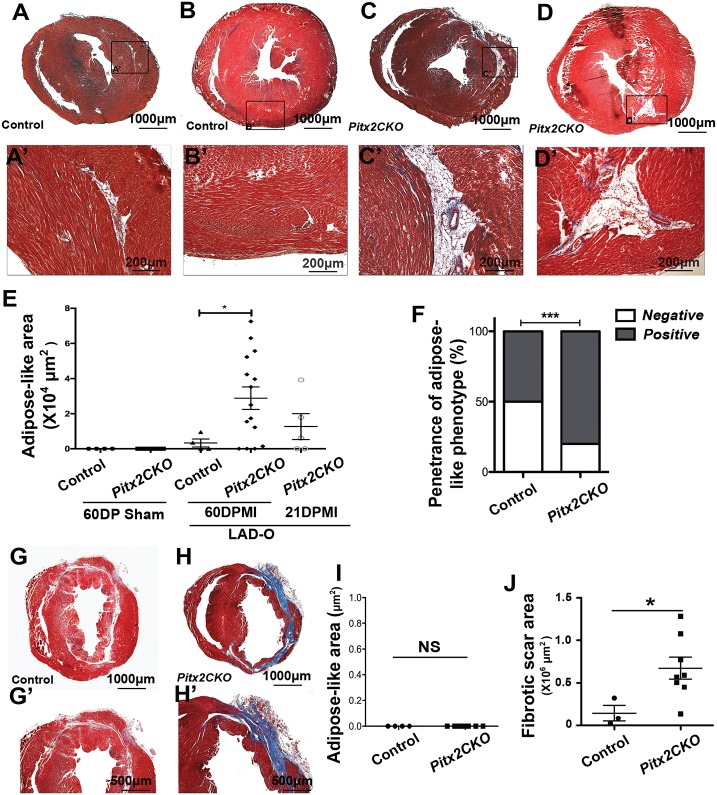
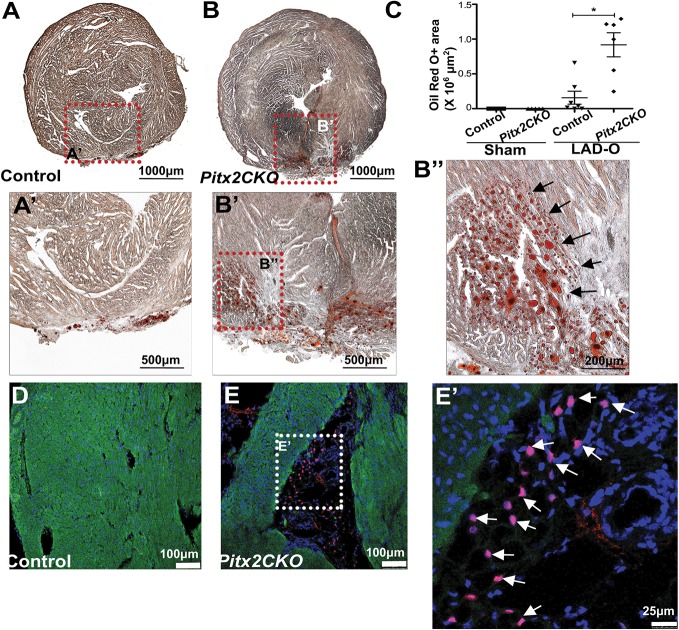
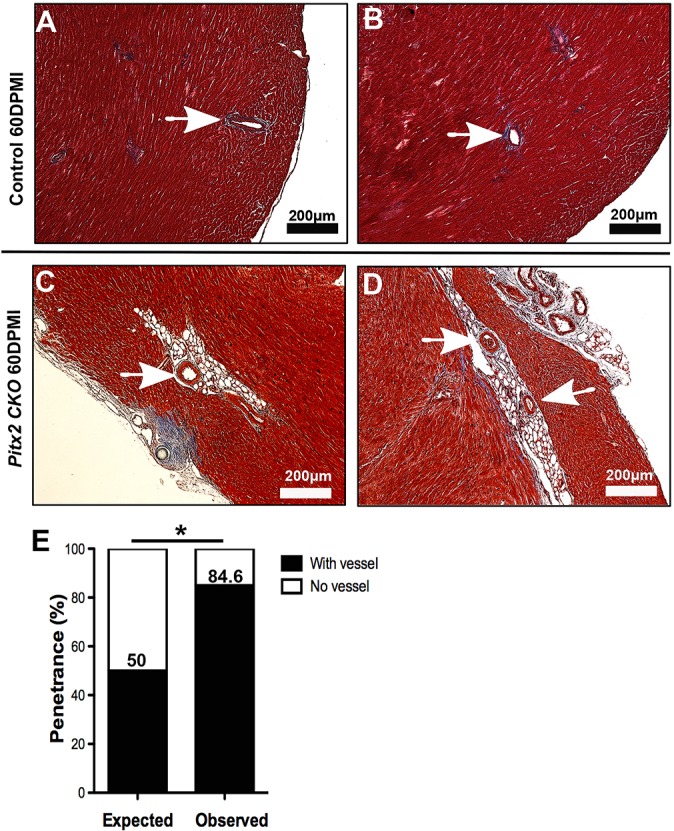
Loss of the paired-like homeodomain transcription factor 2 (Pitx2) in cardiomyocytes predisposes mice to atrial fibrillation and compromises neonatal regenerative capacity. In addition, Pitx2 gain-of-function protects mature cardiomyocytes from ischemic injury and promotes heart repair. Here, we characterized the long-term myocardial phenotype following myocardial infarction (MI) in Pitx2 conditional-knockout (Pitx2 CKO) mice. We found adipose-like tissue in Pitx2 CKO hearts 60 days after MI induced surgically at postnatal day 2 but not at day 8. Molecular and cellular analyses showed the onset of adipogenic signaling in mutant hearts after MI. Lineage tracing experiments showed a non-cardiomyocyte origin of the de novo adipose-like tissue. Interestingly, we found that Pitx2 promotes mitochondrial function through its gene regulatory network, and that the knockdown of a key mitochondrial Pitx2 target gene, Cox7c, also leads to the accumulation of myocardial fat tissue. Single-nuclei RNA-seq revealed that Pitx2-deficient hearts were oxidatively stressed. Our findings reveal a role for Pitx2 in maintaining proper cardiac cellular composition during heart regeneration via the maintenance of proper mitochondrial structure and function.
Keywords: Adipogenesis; Cardiac regeneration; Mitochondria; Mouse; Myocardial infarction.
© 2018. Published by The Company of Biologists Ltd.
Conflict of interest statement
Competing interestsThe authors declare no competing or financial interests.
Figures


Similar articles
-
Pitx2 promotes heart repair by activating the antioxidant response after cardiac injury.Nature. 2016 Jun 2;534(7605):119-23. doi: 10.1038/nature17959. Epub 2016 May 25. Nature. 2016. PMID: 27251288 Free PMC article.
-
Nrf3-Mediated Mitochondrial Superoxide Promotes Cardiomyocyte Apoptosis and Impairs Cardiac Functions by Suppressing Pitx2.Circulation. 2025 Apr 8;151(14):1024-1046. doi: 10.1161/CIRCULATIONAHA.124.070286. Epub 2025 Mar 18. Circulation. 2025. PMID: 40099370
-
PITX2 deficiency leads to atrial mitochondrial dysfunction.Cardiovasc Res. 2024 Dec 4;120(15):1907-1923. doi: 10.1093/cvr/cvae169. Cardiovasc Res. 2024. PMID: 39129206 Free PMC article.
-
Homeobox transcription factor Pitx2: The rise of an asymmetry gene in cardiogenesis and arrhythmogenesis.Trends Cardiovasc Med. 2014 Jan;24(1):23-31. doi: 10.1016/j.tcm.2013.06.001. Epub 2013 Aug 15. Trends Cardiovasc Med. 2014. PMID: 23953978 Review.
-
STEMIN and YAP5SA, the future of heart repair?Exp Biol Med (Maywood). 2024 Oct 31;249:10246. doi: 10.3389/ebm.2024.10246. eCollection 2024. Exp Biol Med (Maywood). 2024. PMID: 39544432 Free PMC article. Review.
Cited by
-
Reduced left atrial cardiomyocyte PITX2 and elevated circulating BMP10 predict atrial fibrillation after ablation.JCI Insight. 2020 Aug 20;5(16):e139179. doi: 10.1172/jci.insight.139179. JCI Insight. 2020. PMID: 32814717 Free PMC article. Clinical Trial.
-
The Gene-Regulatory Footprint of Aging Highlights Conserved Central Regulators.Cell Rep. 2020 Sep 29;32(13):108203. doi: 10.1016/j.celrep.2020.108203. Cell Rep. 2020. PMID: 32997995 Free PMC article.
-
Requirement of Pitx2 for skeletal muscle homeostasis.Dev Biol. 2019 Jan 1;445(1):90-102. doi: 10.1016/j.ydbio.2018.11.001. Epub 2018 Nov 8. Dev Biol. 2019. PMID: 30414844 Free PMC article.
-
Comparative Analysis of Heart Regeneration: Searching for the Key to Heal the Heart-Part II: Molecular Mechanisms of Cardiac Regeneration.J Cardiovasc Dev Dis. 2023 Aug 22;10(9):357. doi: 10.3390/jcdd10090357. J Cardiovasc Dev Dis. 2023. PMID: 37754786 Free PMC article. Review.
-
MicroRNA miR-21 Decreases Post-stroke Brain Damage in Rodents.Transl Stroke Res. 2022 Jun;13(3):483-493. doi: 10.1007/s12975-021-00952-y. Epub 2021 Nov 18. Transl Stroke Res. 2022. PMID: 34796453 Free PMC article.
References
-
- Ambele M. A., Dessels C., Durandt C. and Pepper M. S. (2016). Genome-wide analysis of gene expression during adipogenesis in human adipose-derived stromal cells reveals novel patterns of gene expression during adipocyte differentiation. Stem Cell Res. 16, 725-734. 10.1016/j.scr.2016.04.011 - DOI - PubMed
-
- Battula V. L., Chen Y., Cabreira M. G., Ruvolo V., Wang Z., Ma W., Konoplev S., Shpall E., Lyons K., Strunk D. et al. (2013). Connective tissue growth factor regulates adipocyte differentiation of mesenchymal stromal cells and facilitates leukemia bone marrow engraftment. Blood 122, 357-366. 10.1182/blood-2012-06-437988 - DOI - PMC - PubMed
-
- Brüning J. C., Michael M. D., Winnay J. N., Hayashi T., Hörsch D., Accili D., Goodyear L. J. and Kahn C. R. (1998). A muscle-specific insulin receptor knockout exhibits features of the metabolic syndrome of NIDDM without altering glucose tolerance. Mol. Cell 2, 559-569. 10.1016/S1097-2765(00)80155-0 - DOI - PubMed
Publication types
MeSH terms
Substances
Grants and funding
LinkOut - more resources
Full Text Sources
Other Literature Sources
Medical
Molecular Biology Databases
