. 2018 Oct 10;38(41):8723-8736.
doi: 10.1523/JNEUROSCI.0819-18.2018. Epub 2018 Aug 24.

Experimental Traumatic Brain Injury Identifies Distinct Early and Late Phase Axonal Conduction Deficits of White Matter Pathophysiology, and Reveals Intervening Recovery

Affiliations

Experimental Traumatic Brain Injury Identifies Distinct Early and Late Phase Axonal Conduction Deficits of White Matter Pathophysiology, and Reveals Intervening Recovery

Christina M Marion et al. J Neurosci. .

Abstract

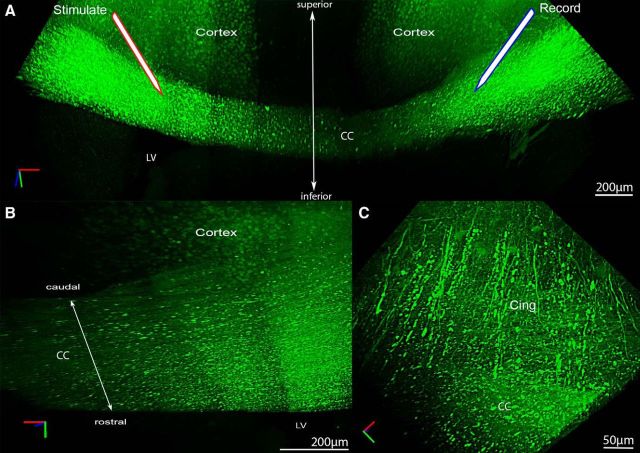
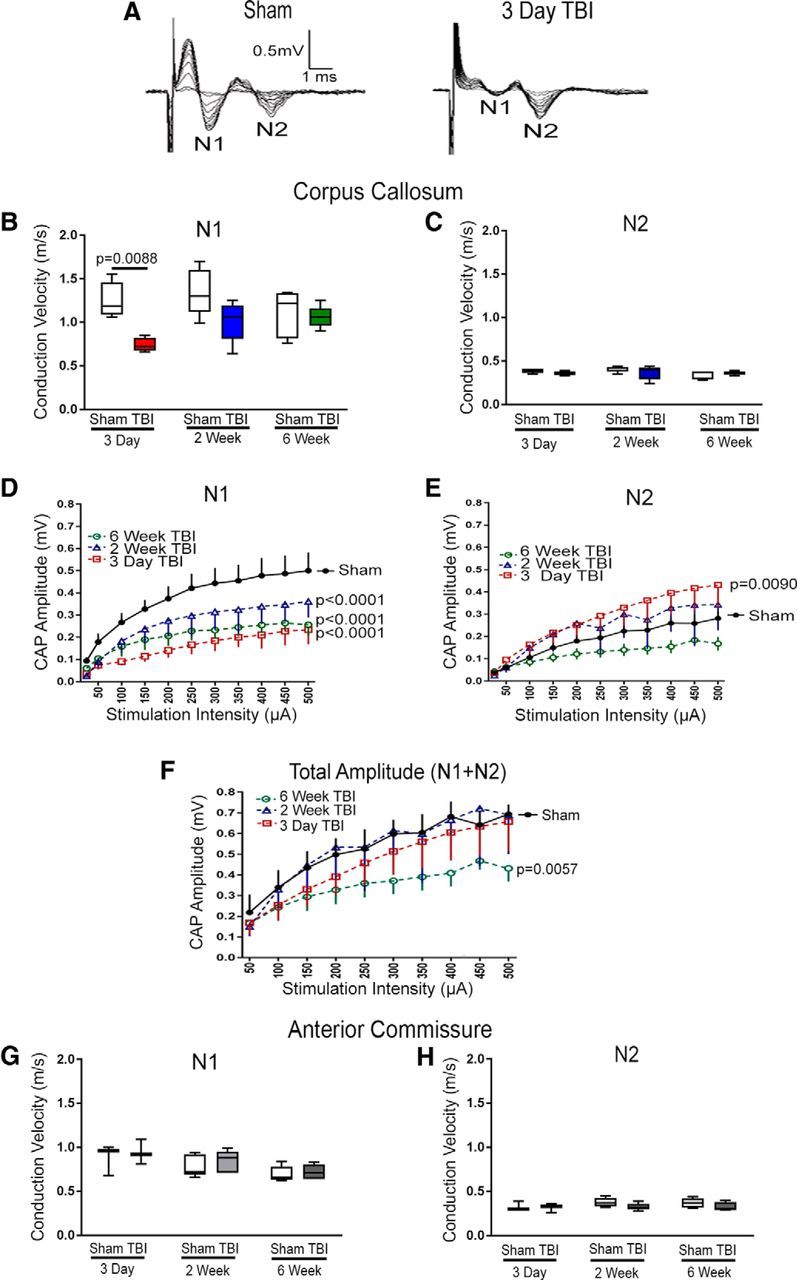
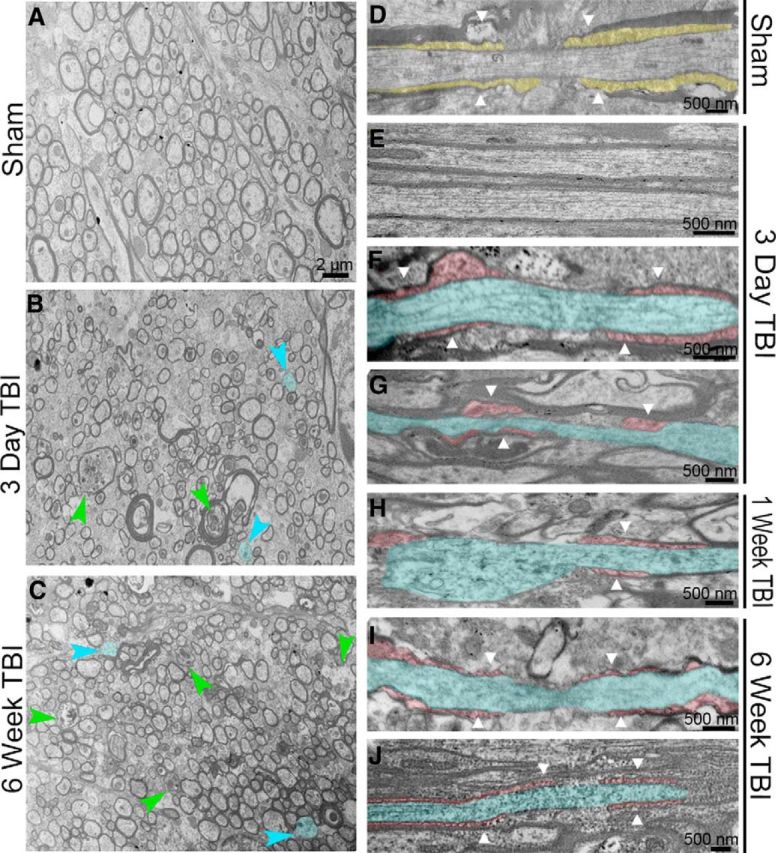
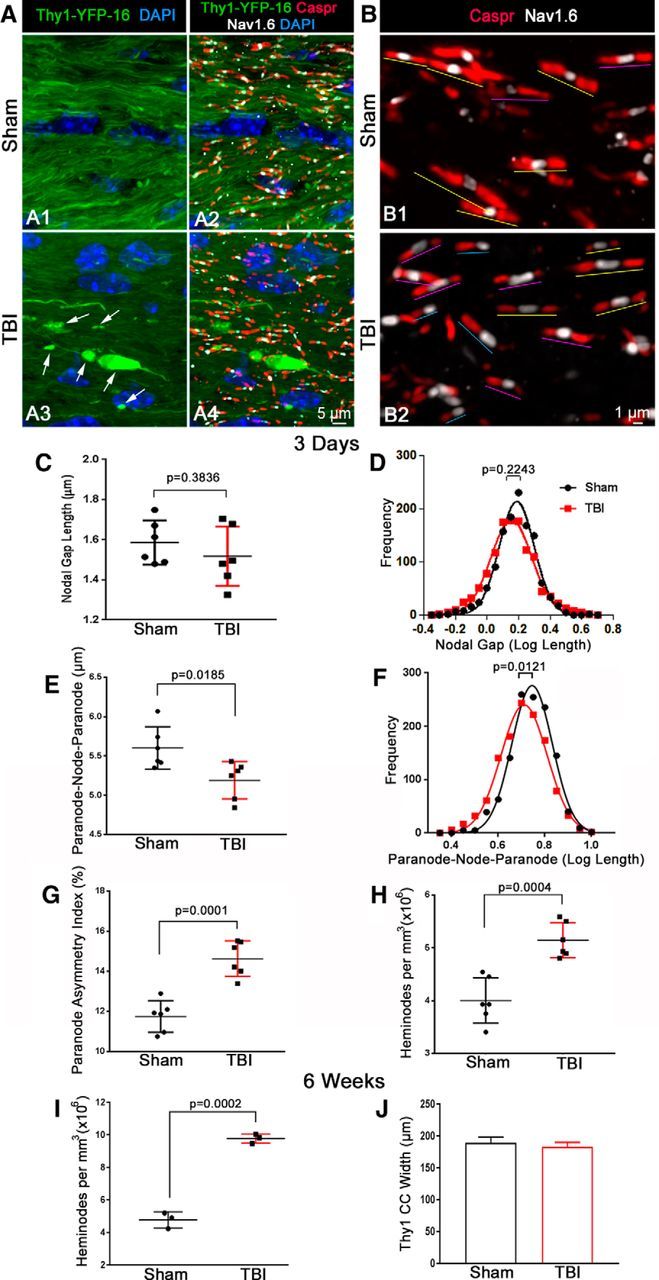
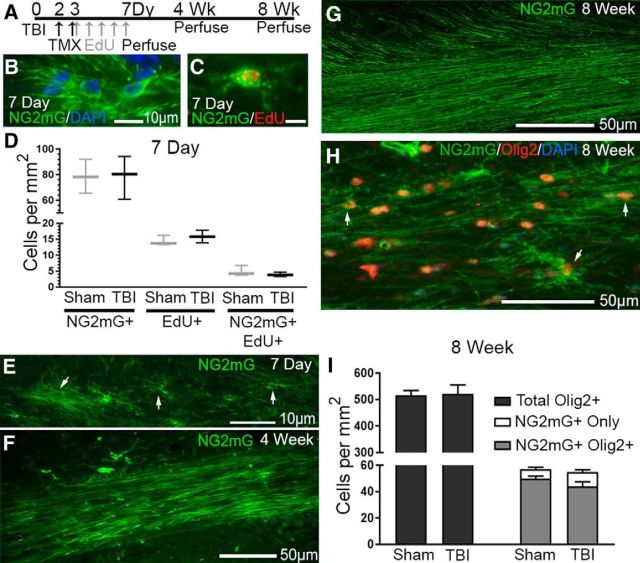
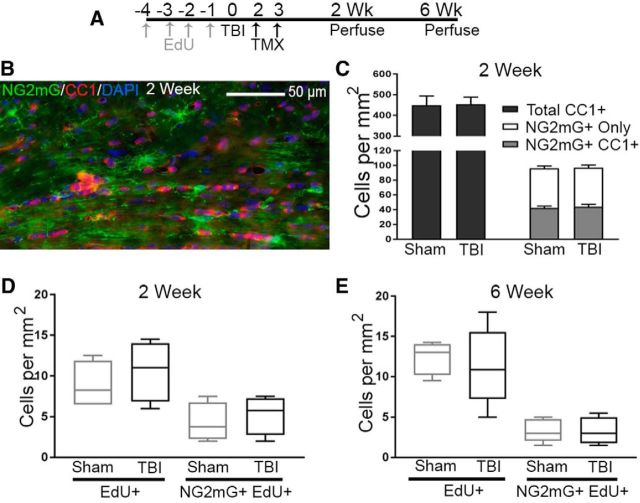
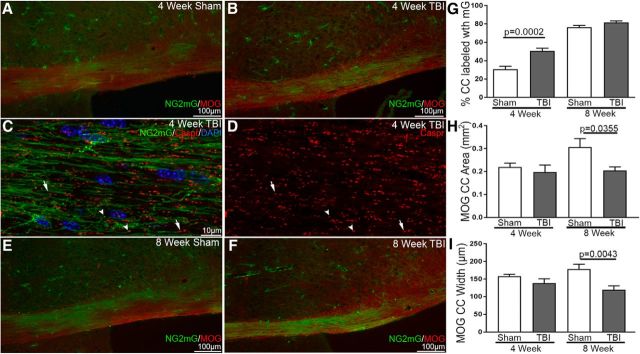
Traumatic brain injury (TBI) patients often exhibit slowed information processing speed that can underlie diverse symptoms. Processing speed depends on neural circuit function at synapses, in the soma, and along axons. Long axons in white matter (WM) tracts are particularly vulnerable to TBI. We hypothesized that disrupted axon-myelin interactions that slow or block action potential conduction in WM tracts may contribute to slowed processing speed after TBI. Concussive TBI in male/female mice was used to produce traumatic axonal injury in the corpus callosum (CC), similar to WM pathology in human TBI cases. Compound action potential velocity was slowed along myelinated axons at 3 d after TBI with partial recovery by 2 weeks, suggesting early demyelination followed by remyelination. Ultrastructurally, dispersed demyelinated axons and disorganized myelin attachment to axons at paranodes were apparent within CC regions exhibiting traumatic axonal injury. Action potential conduction is exquisitely sensitive to paranode abnormalities. Molecular identification of paranodes and nodes of Ranvier detected asymmetrical paranode pairs and abnormal heminodes after TBI. Fluorescent labeling of oligodendrocyte progenitors in NG2CreER;mTmG mice showed increased synthesis of new membranes extended along axons to paranodes, indicating remyelination after TBI. At later times after TBI, an overall loss of conducting axons was observed at 6 weeks followed by CC atrophy at 8 weeks. These studies identify a progression of both myelinated axon conduction deficits and axon-myelin pathology in the CC, implicating WM injury in impaired information processing at early and late phases after TBI. Furthermore, the intervening recovery reveals a potential therapeutic window.SIGNIFICANCE STATEMENT Traumatic brain injury (TBI) is a major global health concern. Across the spectrum of TBI severities, impaired information processing can contribute to diverse functional deficits that underlie persistent symptoms. We used experimental TBI to exploit technical advantages in mice while modeling traumatic axonal injury in white matter tracts, which is a key pathological feature of human TBI. A combination of approaches revealed slowed and failed signal conduction along with damage to the structure and molecular composition of myelinated axons in the white matter after TBI. An early regenerative response was not sustained yet reveals a potential time window for intervention. These insights into white matter abnormalities underlying axon conduction deficits can inform strategies to improve treatment options for TBI patients.

Keywords: CLARITY; axon damage; myelin; nerve conduction; node of Ranvier; paranode.


Figures

Figure 1.
Figure 1.
Concussive TBI causes axonal damage in the CC and cingulum under the impact site illustrated using CLARITY. A, Confocal imaging from an optically cleared brain of a Thy1-YFP-16 mouse at 3 d after TBI shows axon damage in the CC, as detected by YFP-labeled axonal swellings. This YFP labeling illustrates the distribution of axon damage in the CC between the positions of the stimulating and recording electrodes used for electrophysiological analysis of axonal conduction properties (Fig. 2). B, YFP-labeled axonal swellings are particularly dense over the lateral ventricle (LV) and extend rostrocaudally throughout the CC under the site of impact. C, Higher magnification of the cingulum (cing) also shows damage in axons with YFP swellings as well as adjacent thinner normal-appearing axons without swellings.
Figure 2.
Figure 2.
TBI causes slowed conduction velocity followed by axon dropout. A, Representative CAP waveforms recorded from axons within the CC at the level of the midline crossing of the anterior commissure. The fastest wave is the N1 component, which is comprised of myelinated axons. TBI impairs conduction in the N1 fast myelinated axons. The second (N2) wave is comprised of nonmyelinated axons in sham mice but may also include demyelinated axons after TBI. B, TBI slows N1 conduction velocity at 3 d. C, N2 conduction is not slowed by TBI at any time point examined. D, N1 amplitude is reduced at all post-TBI time points relative to the averaged sham values. Among the TBI mice, the N1 amplitude significantly increases between 3 d and 2 weeks (p = 0.0003). E, N2 amplitude is increased to above sham levels at 3 d, which may reflect the abnormal contribution of demyelinated axons with conduction velocities that slow to within the timing of the N2 wave. F, Combining N1 and N2 amplitudes shows overall viable axon conduction across the CC and indicates that axon loss and/or conduction block is significant only at 6 weeks after TBI. G, H, The anterior commissure is a WM tract within the same slices served as a technical control for ex vivo recording within each brain slice. The anterior commissure is more ventrally located and does not exhibit axon damage in this TBI model. Conduction velocity was not altered in anterior commissure axons in the N1 (G) or N2 (H) component after TBI, relative to sham mice. Mouse sample sizes were 3 d (n = 4 sham, n = 4 TBI), 2 weeks (n = 5 sham, n = 5 TBI), and 6 weeks (n = 5 sham, n = 5 TBI). Velocities were compared by two-way ANOVA followed by Sidak's multiple comparison test. B, Interaction: F(2,22) = 2.7165, p = 0.0882; time: F(2,22) = 1.7535, p = 0.1965; injury: F(1,22) = 13.106, p = 0.0015 with post hoc for 3 d p = 0.0088 and effect size = 3.15. Amplitudes compared by two-way ANOVA with Dunnett's multiple comparison to sham. D, Interaction: F(30,138) = 0.9489, p = 0.9994; intensity: F(10,138) = 10.44, p < 0.0001; injury: F(3,138) = 23.95, p < 0.0001 with post hoc for 3 d, p = 0.0001 and effect size = 1.96, 2 week p = 0.0001 and effect size = 0.91, and 6 week p = 0.0001 and effect size = 2.01. E, Interaction: F(30,136) = 0.3408, p = 0.9995; intensity: F(10,136) = 6.541, p < 0.0001; injury: F(3,136) = 10.15, p < 0.0001 with post hoc for 3 d p = 0.009 and effect size = 1.15. F, Interaction: F(27,125) = 0.1516, p > 0.9999; intensity: F(9,125) = 5.661, p < 0.0001; injury: F(3,125) = 5.31, p = 0.0018 with post hoc for 6 week p = 0.0057 and effect size = 2.49. Error bars indicate 10%–90% interval.
Figure 3.
Figure 3.
Electron microscopy demonstrates that TBI WM pathology, with characteristic traumatic axonal injury, involves dispersed demyelinated axons and disrupted paranode structure. A, Sagittal sections through the CC show sham axons, many of which are myelinated. B, C, Dispersed degenerating axons (green arrowheads) and demyelinated axons (blue arrowheads and fill) are evident early (B) and late (C) after TBI. Scale bars, 2 μm. D, Coronal section through the CC to illustrate organized myelin loop attachments forming paranodes (yellow fill; white arrowheads) in sham mice. E–G, Within the CC of injured mice, intact axons with normal myelin (E) are found adjacent to damaged axons (F, G, blue) with cytoskeletal breakdown and nonuniform diameter, along with abnormal paranodes (red fill) and myelin loss (F, G). H–J, Damaged axons (blue) with abnormal paranodes (red) continue to be evident later after TBI.
Figure 4.
Figure 4.
TBI increases paranode asymmetry and formation of heminodes. A, Representative confocal 3D reconstructions of Thy1-YFP-labeled axons in the CC of sham (A1, A2) and TBI (A3, A4) mice at 3 d after procedure. Thy1-YFP, which accumulates in swellings (arrows) along damaged axons in TBI mice, aided in the analysis of paranodal organization with Nav1.6 immunolabeling of nodes of Ranvier (white) and Caspr staining of the flanking paranodes (red). Cell nuclei stained with DAPI (blue). B, Higher-resolution confocal reconstructions show that paranodal complexes in sham animals (B1) mostly appear as normal symmetrical units (yellow lines). Following TBI (B2), disorganized paranodes are evident as asymmetrical paranodes (purple lines) and heminodes (blue lines). C–H, Quantification of node and paranode parameters at 3 d after sham or TBI procedures. The mean length of the nodal gap between paired Caspr-immunolabeled paranodes remains comparable between sham and TBI animals at 3 d after procedure (C). Log transformation plot shows a Gaussian distribution of nodal gap length measurements with no significant differences in mean gap lengths between the two groups (D). TBI decreases the overall length of the paranode-nodal gap-paranode regions (E). Log transformation plot shows a Gaussian distribution of paranode-nodal gap-paranode “triplet” length measurements with significant shortening in TBI mice (F). TBI increases paranodal asymmetry (i.e., shortening of one Caspr-positive paranodal domain in a given paranodal pair) (G). TBI also increases the frequency of heminodes (i.e., Caspr domains flanking Nav1.6 nodes on only one side resulting in unpaired paranodes) (H). I, J, At 6 weeks after procedure, the frequency of heminodes is further increased in TBI mice (I), whereas the overall width of the CC is not significantly different (J). p values were determined by unpaired Student's t test. Mouse sample sizes were 3 d (n = 6 sham, n = 6 TBI) and 6 weeks (n = 3 sham, n = 3 TBI). E, t(10) = 2.18, p = 0.0185, effect size = 1.62. G, t(10) = 5.973, p = 0.0001, effect size = 3.45. H, t(10) = 5.158, p = 0.0004, effect size = 2.98. I, t(4) = 13.71, p = 0.0002, effect size = 11.19. C, E, G–I, Error bars indicate 10%–90% interval. J, Error bars indicate SEM.
Figure 5.
Figure 5.
Fluorescent labeling of new membrane synthesis in oligodendrocyte lineage cells using NG2CreER;mTmG myelin reporter mice. A, NG2CreER;mTmG mice were given tamoxifen on days 2–3 after TBI or sham procedures to induce expression of membrane-localized GFP driven from the NG2 promoter (NG2mG). The thymidine analog EdU was given daily between 3 and 7 d after TBI/sham to label cycling cells during DNA synthesis. B–E, At 7 d after TBI/sham, NG2mG labels cells with a progenitor morphology (B), including EdU-labeled cycling cells (C). The density of NG2 cells and/or cycling cells in the CC is not significantly different in TBI mice compared with sham (D). E–G, NG2mG also labels cells with more elaborate processes that are characteristic of later-stage oligodendrocyte lineage cells (E). With longer survival time, NG2mG-labeled cells extend membranes along axons (F) that continue to increase within the CC in a myelinating pattern (G). All images show representative examples from TBI mice. H, I, The oligodendrocyte lineage marker Olig2 labeled nuclei within the majority of NG2mG cells (H, I). At 8 weeks after TBI/sham, the injury condition did not significantly alter the cell populations expressing single or double labeling for Olig2 and/or NG2mG. Mouse sample sizes were 7 d (n = 3 TBI mice, n = 3 sham mice), 4 weeks (n = 5 TBI, n = 4 sham), and 8 weeks (n = 5 TBI mice, n = 5 sham mice). Two-way repeated-measures ANOVA showed no significant effect of injury for a given cell type labeling on post hoc analysis with Sidak's adjustment for multiple comparisons. D, Interaction: F(2,8) = 0.03029, p = 0.9703; cell type labeling: F(2,8) = 135, p < 0.0001; injury: F(1,4) = 0.0002, p = 0.9891. Error bars indicate 10%–90% interval. I, Interaction: F(2,27) = 0.06392, p = 0.9382; cell type labeling: F(2,27) = 0.05687, p < 0.0001; injury: F(1,27) = 0.00617, p = 0.9380. Error bars indicate SEM.
Figure 6.
Figure 6.
TBI does not alter the response of endogenous cycling cells or differentiation into mature oligodendrocytes in NG2CreER;mTmG mice. A, NG2CreER;mTmG mice were given thymidine analog EdU daily for 4 d before TBI or sham procedure, followed by tamoxifen on days 2–3 after TBI/sham to induce NG2mG expression. B, C, At 2 weeks after TBI/sham, NG2mG is expressed in immature oligodendrocyte lineage cells and in cells that express CC1, a mature oligodendrocyte marker (B). The injury condition did not significantly alter the CC cell populations expressing single or double labeling for CC1 and/or NG2mG (C). D, E, The most immature oligodendrocyte lineage cells are endogenous cycling cells that incorporate EdU before TBI/sham procedures. TBI did not alter the population of EdU-labeled cells in the CC, either with or without NG2mG labeling, at 2 weeks (D) or 6 weeks (E) after TBI/sham. Mouse sample sizes were 2 weeks (n = 5 TBI, n = 5 sham) and 6 weeks (n = 5 TBI, n = 5 sham). Two-way repeated-measures ANOVA showed no significant effect of injury for a given cell type on post hoc analysis with Sidak's adjustment for multiple comparisons. C, Interaction: F(2,24) = 0.005887, p = 0.9941; cell type labeling: F(2,24) = 202.8, p < 0.0001; injury: F(1,24) = 0.009432, p = 0.9234. Error bars indicate SEM. D, Interaction: F(1,12) = 0.0.06658, p = 0.8007; cell type labeling: F(1,12) = 11.84, p = 0.0049; injury: F(1,12) = 0.8952, p = 0.3627. Error bars indicate 10%–90% interval. E, Interaction: F(1,16) = 0.1492, p = 0.7403; cell type labeling: F(1,16) = 45.24, p < 0.0001; injury: F(1,16) = 0.1649, p = 0.6900. Error bars indicate 10%–90% interval.
Figure 7.
Figure 7.
NG2CreER;mTmG myelin membrane remodeling and CC atrophy after TBI. A, B, Sham and TBI mice at 4 weeks elaborate NG2mG-labeled membranes in the CC area that is immunolabeled for MOG. C, D, Myelin formation by NG2mG-labeled cells is indicated by membrane extension to paranodes, identified by Caspr immunolabeling. Caspr labels paranode pairs (arrows), as expected for flanking the node of Ranvier. Individual Caspr regions (arrowheads) reveal abnormal paranode organization after TBI. E, F, By 8 weeks after TBI or sham procedures, NG2mG membranes are more widespread within the CC. G, Quantification of NG2mG and MOG shows that TBI increases NG2mG membrane formation in the CC at 4 weeks after injury. H, I, However, at 8 weeks, TBI results in significant CC atrophy. MOG measurements of the area (H) and width (I) of the CC are reduced in TBI mice, which do not exhibit the normal continued increase with age that is observed in sham mice. Mouse sample sizes were 4 weeks (n = 5 TBI, n = 4 sham) and 8 weeks (n = 5 TBI, n = 5 sham). Two-way ANOVA and post hoc analysis with Sidak's test for multiple comparisons. G, F(1,15) = 8.695, p = 0.0100; time: F(1,15) = 229.5, p < 0.0001; injury: F(1,15) = 25.07, p = 0.0002 with post hoc for 4 weeks, p = 0.0002 and effect size = 3.04. H, Interaction: F(1,15) = 2.05, p = 0.1727; time: F(1,15) = 2.781, p < 0.1161; injury: F(1,15) = 4.908, p = 0.0426 with post hoc for 8 weeks, p = 0.0355 and effect size = 1.89. I, Interaction: F(1,15) = 2.887, p = 0.1100; time: F(1,15) = 0.004485, p = 0.9476; injury: F(1,15) = 11.42, p = 0.0041 with post hoc for 8 weeks, p = 0.0043 and effect size = 2.14. Error bars indicate SEM.

Similar articles

Cited by

References

    1. Almeida RG, Lyons DA (2017) On myelinated axon plasticity and neuronal circuit formation and function. J Neurosci 37:10023–10034. 10.1523/JNEUROSCI.3185-16.2017 - DOI - PMC - PubMed
    1. Amor V, Zhang C, Vainshtein A, Zhang A, Zollinger DR, Eshed-Eisenbach Y, Brophy PJ, Rasband MN, Peles E (2017) The paranodal cytoskeleton clusters Na(+) channels at nodes of Ranvier. Elife 6:e21392. 10.7554/eLife.21392 - DOI - PMC - PubMed
    1. Arancibia-Cárcamo IL, Attwell D (2014) The node of Ranvier in CNS pathology. Acta Neuropathol 128:161–175. 10.1007/s00401-014-1305-z - DOI - PMC - PubMed
    1. Arancibia-Cárcamo IL, Ford MC, Cossell L, Ishida K, Tohyama K, Attwell D (2017) Node of Ranvier length as a potential regulator of myelinated axon conduction speed. Elife 6:e23329. 10.7554/eLife.23329 - DOI - PMC - PubMed
    1. Armstrong RC, Le TQ, Frost EE, Borke RC, Vana AC (2002) Absence of fibroblast growth factor 2 promotes oligodendroglial repopulation of demyelinated white matter. J Neurosci 22:8574–8585. 10.1523/JNEUROSCI.22-19-08574.2002 - DOI - PMC - PubMed

Publication types

MeSH terms