. 2018 Oct 1;201(7):2117-2131.
doi: 10.4049/jimmunol.1800161. Epub 2018 Aug 24.

Differential Induction of IFN-α and Modulation of CD112 and CD54 Expression Govern the Magnitude of NK Cell IFN-γ Response to Influenza A Viruses

Affiliations

Differential Induction of IFN-α and Modulation of CD112 and CD54 Expression Govern the Magnitude of NK Cell IFN-γ Response to Influenza A Viruses

Lisa M Kronstad et al. J Immunol. .

Abstract

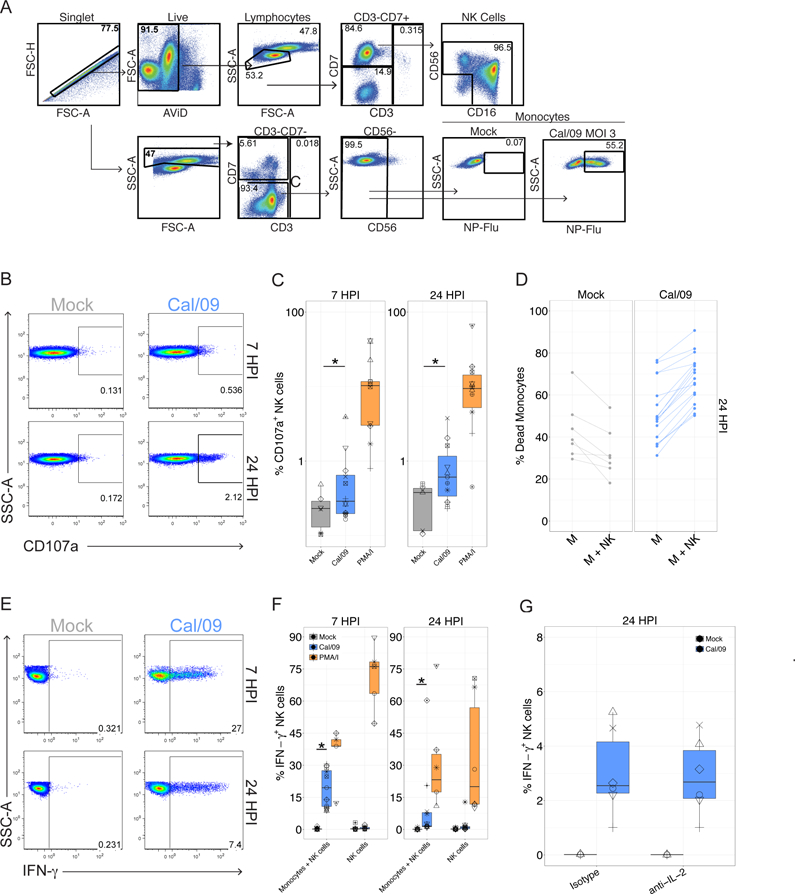
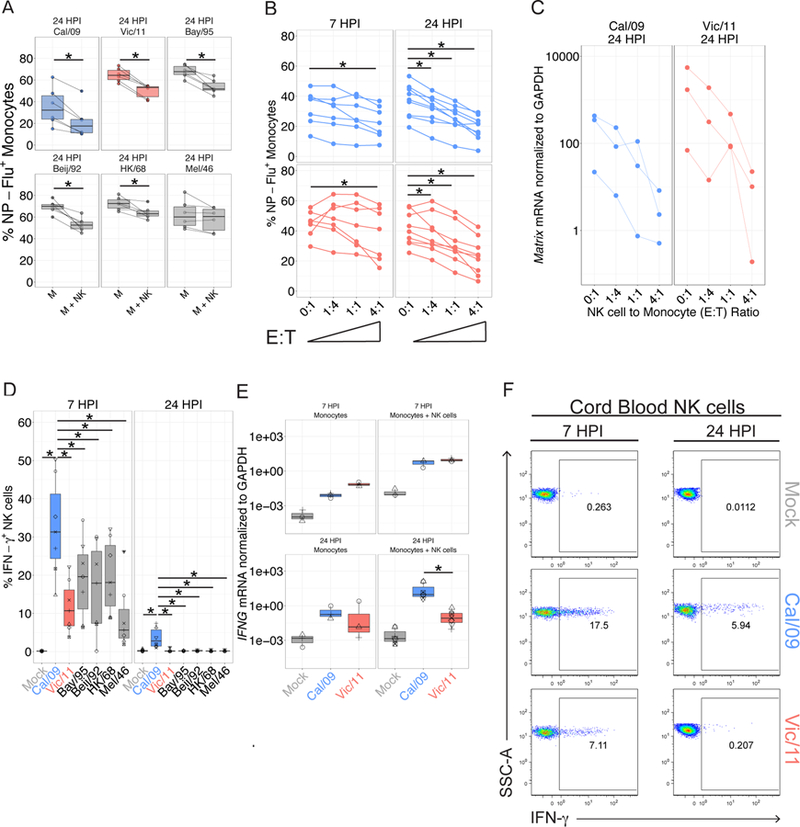
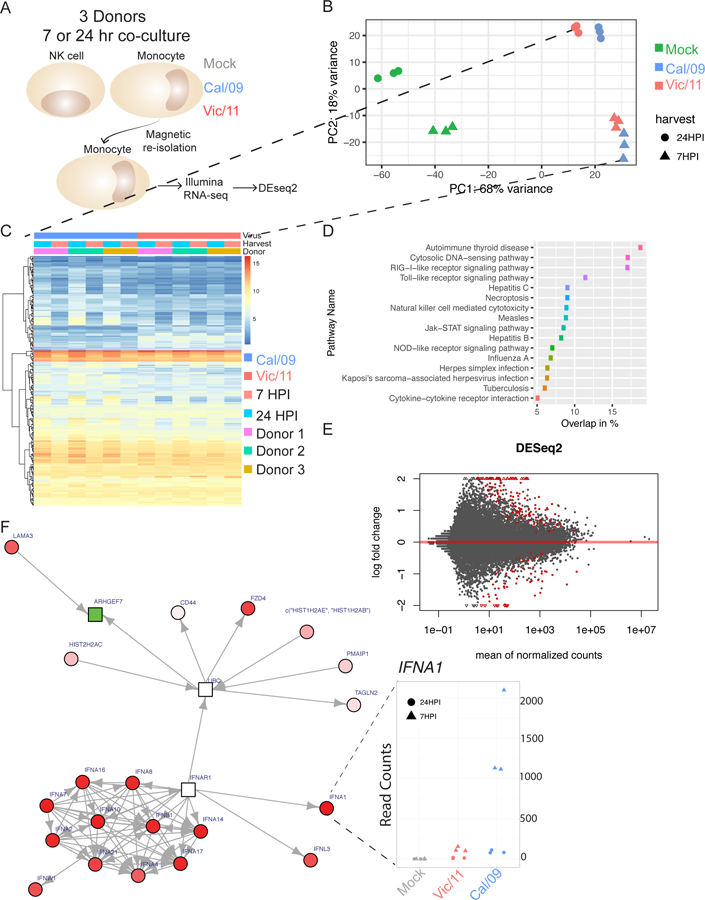
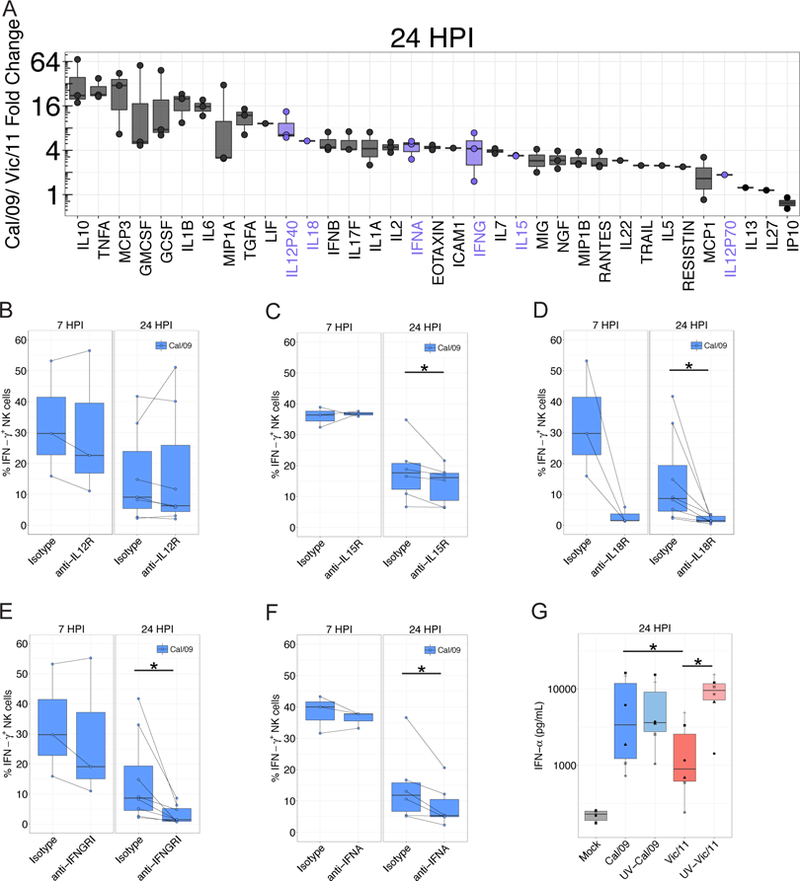
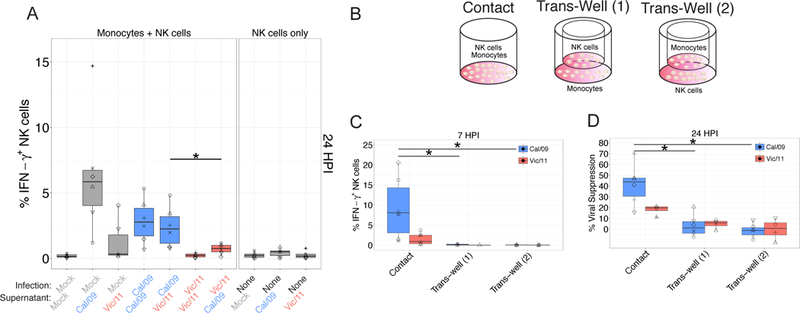
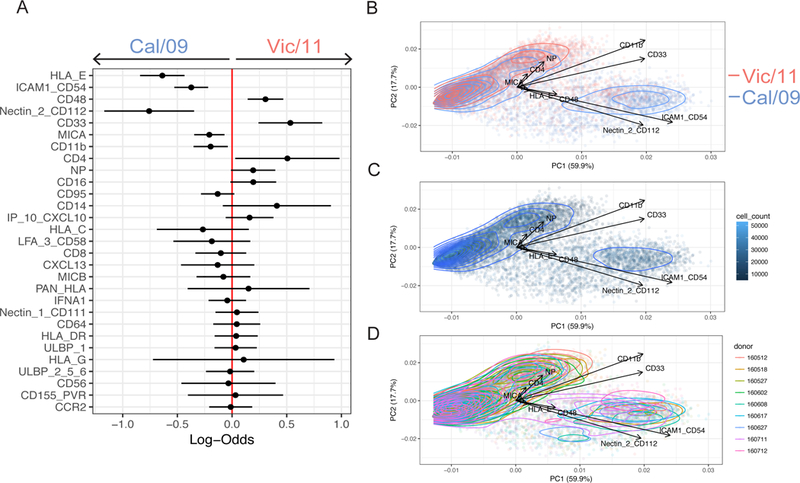
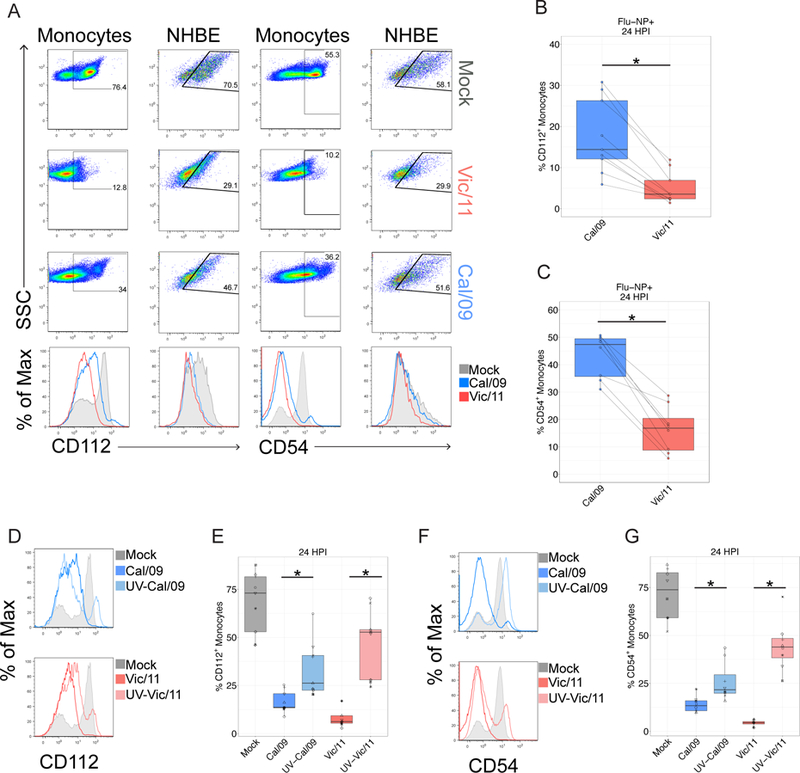
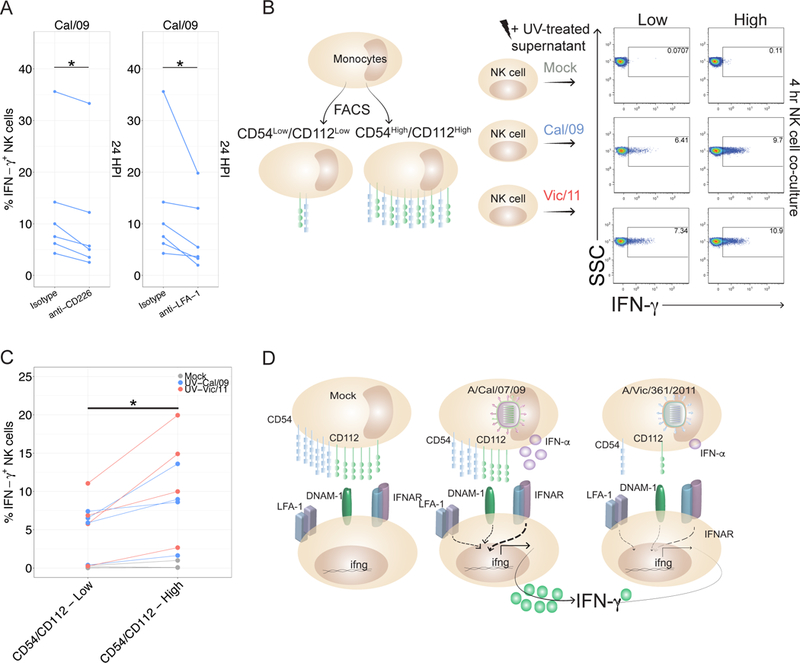
In human and murine studies, IFN-γ is a critical mediator immunity to influenza. IFN-γ production is critical for viral clearance and the development of adaptive immune responses, yet excessive production of IFN-γ and other cytokines as part of a cytokine storm is associated with poor outcomes of influenza infection in humans. As NK cells are the main population of lung innate immune cells capable of producing IFN-γ early in infection, we set out to identify the drivers of the human NK cell IFN-γ response to influenza A viruses. We found that influenza triggers NK cells to secrete IFN-γ in the absence of T cells and in a manner dependent upon signaling from both cytokines and receptor-ligand interactions. Further, we discovered that the pandemic A/California/07/2009 (H1N1) strain elicits a seven-fold greater IFN-γ response than other strains tested, including a seasonal A/Victoria/361/2011 (H3N2) strain. These differential responses were independent of memory NK cells. Instead, we discovered that the A/Victoria/361/2011 influenza strain suppresses the NK cell IFN-γ response by downregulating NK-activating ligands CD112 and CD54 and by repressing the type I IFN response in a viral replication-dependent manner. In contrast, the A/California/07/2009 strain fails to repress the type I IFN response or to downregulate CD54 and CD112 to the same extent, which leads to the enhanced NK cell IFN-γ response. Our results indicate that influenza implements a strain-specific mechanism governing NK cell production of IFN-γ and identifies a previously unrecognized influenza innate immune evasion strategy.


Conflict of interest statement

The authors have declared that no conflict of interest exists.

Figures

Figure 1.
Figure 1.. NK cells suppress viral infection and secrete IFN-γ in response to pandemic 2009 H1N1 influenza A virus.
(A) Diagram of gating tree used to identify monocytes and NK cells by flow cytometry. FSC, forward scatter; AViD, Live/Dead fixable aqua dead cell stain; SSC-A, side scatter. Cal/09 infection at an MOI = 3 at 7 HPI is shown. (B) Representative flow plot of CD107a expression on NK cells after 6 or 23-hr co-culture with Cal/09-infected monocytes (MOI = 3). (C) Summary plot of NK cell CD107a+ frequency after 6 or 23-hr (n = 19) co-culture with Cal/09-infected monocytes. PMA/ionomycin treatment served as positive control. (D) The percent dead monocytes of mock (n = 7) or Cal/09 (n = 16) monocytes alone (M) or co-cultured with NK cells at an E:T of 1:1 (M+NK). (E) Representative flow plot of NK cell IFN-γ+ frequency after after 6 or 23-hr co-culture with Cal/09-infected monocytes. (F) Summary plot of NK cell IFN-γ+ frequency after 6 or 23-hr (n = 12) co-culture with Cal/09-infected monocytes or exposure to virions at 7 or 24 HPI assessed by intracellular cytokine staining. PMA/ionomycin treatment served as positive control. *P < 0.05, Wilcoxon signed-rank test. (G) Summary plot of NK cell IFN-γ+ frequency after 23-hr co-culture with Cal/09-infected monocytes incubated with anti-IL-2 or an isotype control antibody (4 µg/mL) and assessed by intracellular cytokine staining (n = 6).
Figure 2.
Figure 2.
NK cells suppress viral infection and secrete IFN-γ in response to six influenza A strains. (A) The percent Flu-NP+ monocytes of indicated influenza strain 24 HPI (MOI = 3) and an E:T ratio of 0:1 without NK cells (M) or with NK cells at an E:T of 1:1 (M+NK) (n = 6). (B) The percent Flu-NP+ monocytes measured after Cal/09 or Vic/11 infection at an MOI of 3 and an E:T ratio of 0:1, 1:4, 1:1 or 4:1 for a total of 7 (n = 7) or 24 hr (n = 9). (C) RNA expression levels of an identical sequence in the influenza matrix gene segment of Cal/09 and Vic/11 normalized to the housekeeping gene GAPDH (n = 3). (D) NK cell IFN-γ+ frequency after culture with monocytes infected with the specified influenza A strains at 7 HPI (n = 7) or 24 HPI (n = 6). (E) IFNG transcript levels normalized to GAPDH in the monocyte alone or monocyte – NK cell co-culture (M+NK) after mock treatment, Cal/09 or Vic/11 exposure (MOI = 3). Values represent average of technical triplicates (n = 3). (F) Representative flow plot showing percent IFN-γ+ of cord blood NK cells post exposure to mock, Cal/09- or Vic/11-infected monocytes (n = 3). *P < 0.05, Wilcoxon signed-rank test.
Figure 3.
Figure 3.. Whole transcriptome profiling of mock-treated, Cal/09- or Vic/11-infected monocytes reveals strain-specific alterations in the magnitude of the IFNAR response.
(A) Schematic of RNA-sequencing experimental design. Monocytes from three healthy blood bank donors were mock treated or infected with Cal/09 (MOI = 5) or Vic/11 (MOI = 0.2) followed by NK cell co-culture. At 7 or 24 HPI, monocytes were re-isolated by magnetic separation followed by RNA extraction, cDNA library preparation and paired-end illumina sequencing. (B) Principal component analysis (PCA) plot of the samples colored by treatment. (C) Heatmap showing genes differentially expressed by Cal/09 vs. Vic/11 infection. (D) KEGG pathways significantly enriched by each infection showing % overlap between strains. (E) Volcano plot of differentially expressed genes between Cal/09 and Vic/11 infected monocytes generated by DeSeq2, with the log2 fold change of each gene plotted against the total number of counts recorded for that gene. Differentially expressed genes with a p-value < 0.05 are highlighted in red. Triangles represent data points outside the graph area. (F) Differentially expressed genes were mapped to known protein-protein networks derived from the human STRING database. Individual gene are nodes in the network with scores assigned to them derived from a beta-uniform mixture model fitted to the unadjusted p-value distribution accounting for multiple testing. A subgraph (false discovery rate = 0.01) was generated with differential gene expression colored in red (upregulated; Cal/09 > Vic/11), green (downregulated; Cal/09 < Vic/11) or white (neutral). Shapes represent scores: rectangles are negative and circles are positive. Red cluster in bottom left: type 1 interferon-mediated signaling pathway elevated in Cal/09- vs. Vic/11-infected monocytes. Inset: IFNA1 mRNA counts within each condition.
Figure 4.
Figure 4.. Cytokine profiles of Vic/11- and Cal/09-infected monocytes contribute to strain-specific NK cell IFN-γ responses.
(A) Cytokine concentrations assessed by Luminex®. Values displayed represent the fold-change in the mean fluorescence intensity between Cal/09- and Vic/11-infected conditions (MOI = 3). Cytokines elevated by 2.5-fold in supernatants harvested from Cal/09 or Vic/11-infected monocytes over the level in supernatants from mock-infected monocytes are plotted (n = 3). (B)-(F) Impact of cytokine receptor blocking on the NK cell IFN-γ response evaluated by pre-incubating NK cells for 1 hr with blocking antibodies specific to IL-12R (B), IL-15R (C), IL-18R (D), IFNGR1 (F) or with neutralizing antibody to IFN-α (F) followed by co-culture with infected monocytes. NK cell IFN-γ+ frequency compared with treatment with an isotype control antibody at 7 HPI (n = 3) or 24 HPI (n = 7–8) is shown. (G) IFN-α concentration following infection of monocytes with live or UV-inactivated Cal/09 or Vic/11 virus at an MOI of 3 (n = 6). *P < 0.05, Wilcoxon signed-rank test.
Figure 5.
Figure 5.. Cytokine stimulation is insufficient to drive strain-specific NK cell anti-influenza IFN-γ production.
(A) Assessment of the impact of supernatants from infected cultures to the NK cell IFN-γ response to influenza strains. After infection (or mock-infection) for 24 hours, supernatants were then transferred to monocytes under each specified condition, followed by co-culture with autologous NK cells. Intracellular cytokine staining was used to assess the percentage IFN-γ+ NK cells by flow cytometry (n = 6). (B) Monocytes were cultured in direct contact with NK cells (contact), with monocytes seeded in dish and NK cells seeded in the trans-well (Trans-Well (1)), or monocytes seeded in the trans-well and NK cells seeded in the dish (Trans-Well (2)). (C) Percentage of IFN-γ+ NK cells after 6 hr co-culture with infected monocytes; Cal/09 (n = 6), Vic/11 (n = 5). (D) Cal/09- or Vic/11-infected monocytes were cultured alone or co-cultured with NK cells at a ratio of 1:1. Monocyte infection levels at 24 HPI assessed using an antibody specific to Flu-NP followed by intracellular flow cytometry, Cal/09 (n = 6), Vic/11 (n = 4). Mock-treated values were subtracted from infected measurements. *P < 0.05, Wilcoxon signed-rank test.
Figure 6.
Figure 6.. Identification of influenza-mediated modulation of NK cell inhibitory and activating ligands by mass cytometry and GLMM analysis.
(A) Generalized linear mixed model (GLMM) to identify markers predictive of Cal/09 vs. Vic/11 infection from nine donors. Log-odds are logarithm of ratios of the probability that a cell is Vic/11-infected over the probability that a cell is Cal/09-infected at 24 HPI. An increase in the parameter coefficient corresponds to the strength of the classification power, with the 95% confidence interval from sampling error represented by line surrounding the point estimate. The confidence intervals are widened using Bonferroni’s method. The reported p-values are controlled using Benjamini-Hochberg’s false discovery rates. (B) PCA of individual cells colored by Cal/09 vs. Vic/11 infection at 24 HPI, with the vectors driving variance displayed. Quality check of variables that could potentially influence the ability to identify makers predictive of infection in monocyte – NK cell co-culture. (C) Cell count PCA of Cal/09 - vs. Vic/11-infected monocytes at 24 HPI. (D) PCA colored by donor of Cal/09 - vs. Vic/11-infected-infected monocytes at 24 HPI.
Figure 7.
Figure 7.. Strain-specific downregulation of CD112 and CD54 is dependent on viral replication.
(A) Representative flow plots and histograms of CD112 expression on mock, Vic/11- or Cal/09-exposed monocytes and NHBE cells (MOI = 3). (B-C) The frequency of (B) CD112 (n = 9) or (C) CD54 (n = 8) expression on infected (Flu-NP+) monocytes assessed by fluorescence flow cytometry on Cal/09- or Vic/11-infected cells at an MOI of 3 at 24 HPI. (D-G) Representative histograms of CD112 (D) and CD54 (F) expression on mock-treated, live and UV-inactivated Cal/09- or Vic/11-infected monocytes. Summary plots of CD112+ (n = 9) (E) and CD54+ (n = 8) (G) expression after mock-treatment or infection with live or UV-inactivated Cal/09- or Vic/11-infected monocytes at MOI of 3. *P < 0.05, Wilcoxon signed-rank test.
Figure 8.
Figure 8.. Cytokine-mediated and receptor-ligand interactions are necessary for the NK cell response to influenza-infected cells.
(A) NK cells were incubated for 1 hr with isotype control (Mouse IgG1, κ) or blocking antibodies specific to CD226 or LFA-1 followed by co-culture with autologous infected monocytes. At 24 HPI, intracellular cytokine staining was used to assess IFN-γ production compared to treatment with isotype control antibody (n = 6). (B) Schematic of fluorescently activated cell sorting to isolate uninfected monocytes expressing either low or high levels of CD54 and CD112. CD54Low/CD112Low and CD54High/CD112High monocytes were co-cultured with autologous NK cells for four hours in the presence of UV-treated supernatant harvested from mock, Cal/09- or Vic/11 monocytes (MOI = 3, 24 HPI) (n = 3 at 4 hr, n = 1 at 17 hr). (C) Compiled data from four donors from experiment described in (B). (D) Model of strain-specific NK cell recognition of influenza A infection. Cal/09 infection of monocytes elicits enhanced IFN-α secretion and neutralization of IFN-α dampens NK cell IFN-γ production. Cal/09-infection does not downregulate CD54 and CD112 to the same extent as Vic/11-infected monocytes or NHBE cells. *P < 0.05, Wilcoxon signed-rank test.

Similar articles

Cited by

References

    1. Thompson WW, Weintraub E, Dhankhar P, Cheng P-Y, Brammer L, Meltzer MI, Bresee JS, and Shay DK. 2009. Estimates of US influenza-associated deaths made using four different methods. Influenza Other Respi. Viruses 3: 37–49. - PMC - PubMed
    1. Grégoire C, Chasson L, Luci C, Tomasello E, Geissmann F, Vivier E, and Walzer T. 2007. The trafficking of natural killer cells. Immunol. Rev 220: 169–182. - PMC - PubMed
    1. Ge MQ, Ho AWS, Tang Y, Wong KHS, Chua BYL, Gasser S, and Kemeny DM. 2012. NK cells regulate CD8+ T cell priming and dendritic cell migration during influenza A infection by IFN-γ and perforin-dependent mechanisms. J. Immunol 189: 2099–2109. - PubMed
    1. Pommerenke C, Wilk E, Srivastava B, Schulze A, Novoselova N, Geffers R, and Schughart K. 2012. Global transcriptome analysis in influenza-infected mouse lungs reveals the kinetics of innate and adaptive host immune responses. PLoS One 7: e41169. - PMC - PubMed
    1. Stein-Streilein J, Bennett M, Mann D, and Kumar V. 1983. Natural killer cells in mouse lung: surface phenotype, target preference, and response to local influenza virus infection. J. Immunol 131: 2699–2704. - PubMed

Publication types