. 2018 Aug 24;9(1):3404.
doi: 10.1038/s41467-018-05721-4.

Loss of the E3 ubiquitin ligase MKRN1 represses diet-induced metabolic syndrome through AMPK activation

Affiliations

Loss of the E3 ubiquitin ligase MKRN1 represses diet-induced metabolic syndrome through AMPK activation

Min-Sik Lee et al. Nat Commun. .

Abstract

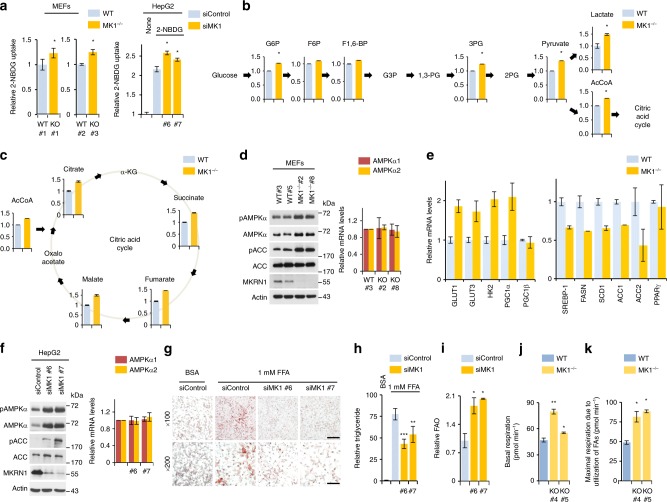
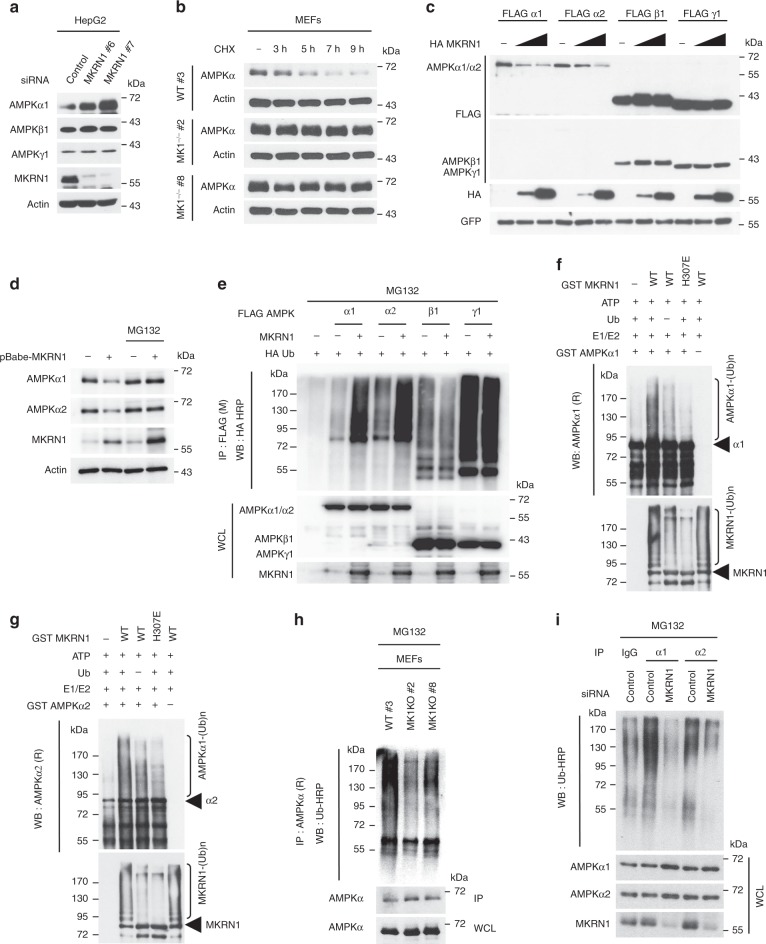
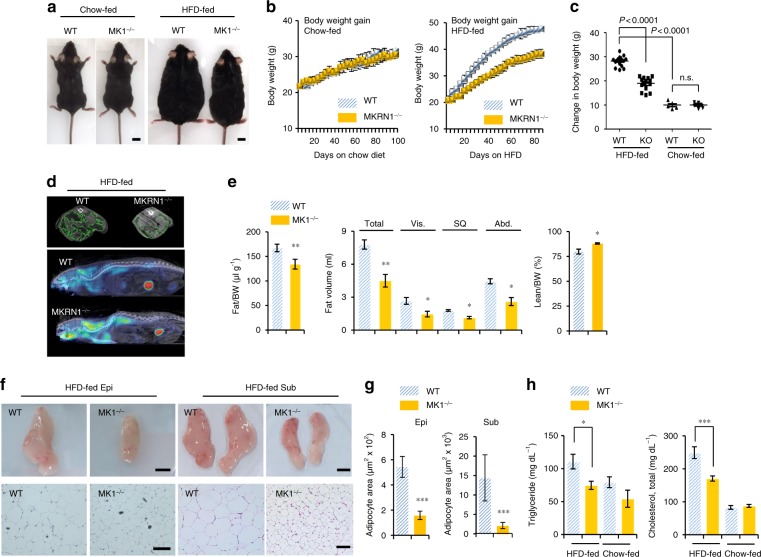
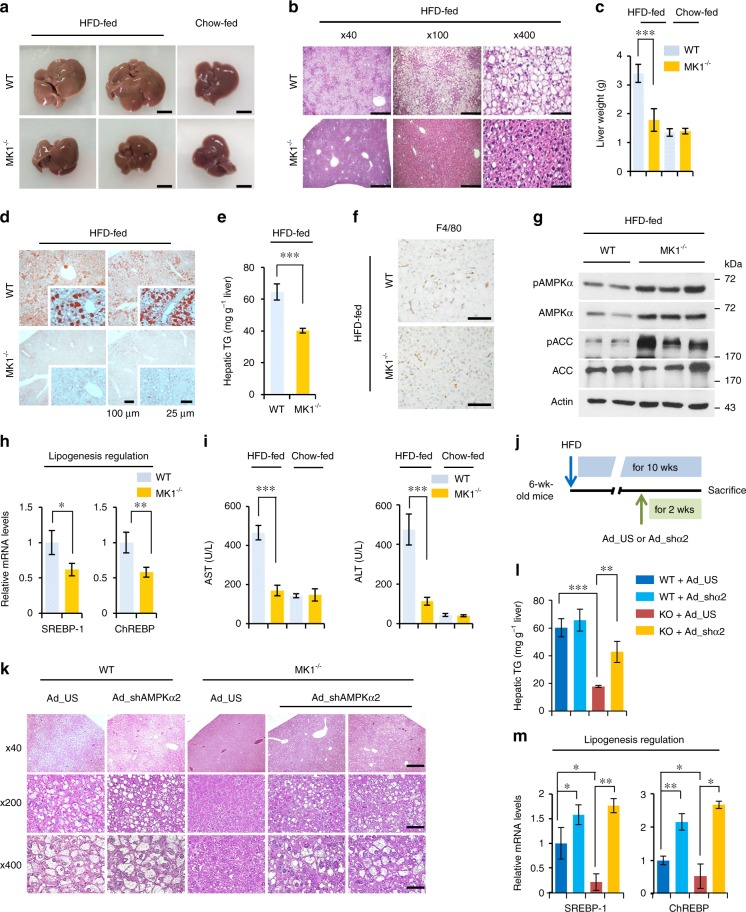
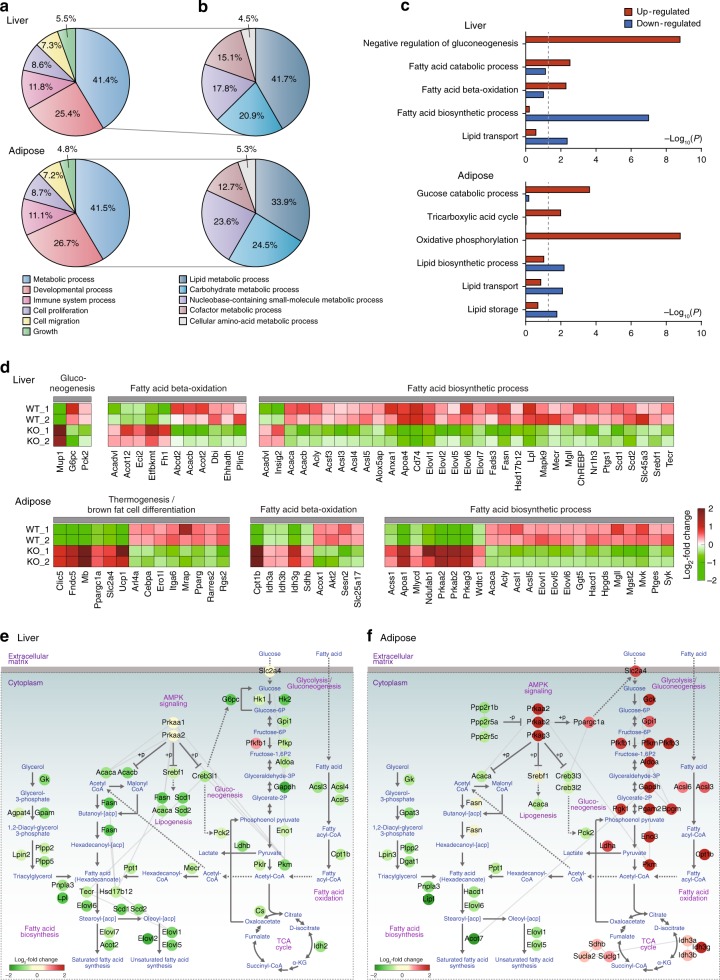
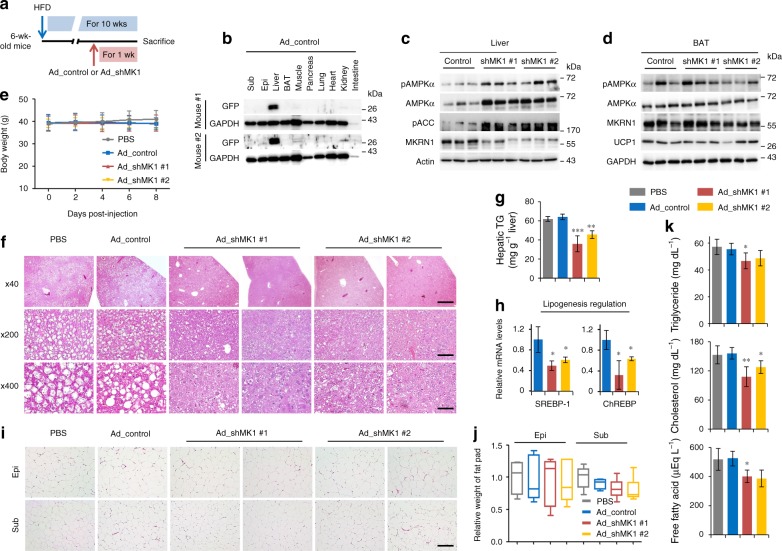
AMP-activated protein kinase (AMPK) plays a key role in controlling energy metabolism in response to physiological and nutritional status. Although AMPK activation has been proposed as a promising molecular target for treating obesity and its related comorbidities, the use of pharmacological AMPK activators has been met with contradictory therapeutic challenges. Here we show a regulatory mechanism for AMPK through its ubiquitination and degradation by the E3 ubiquitin ligase makorin ring finger protein 1 (MKRN1). MKRN1 depletion promotes glucose consumption and suppresses lipid accumulation due to AMPK stabilisation and activation. Accordingly, MKRN1-null mice show chronic AMPK activation in both liver and adipose tissue, resulting in significant suppression of diet-induced metabolic syndrome. We demonstrate also its therapeutic effect by administering shRNA targeting MKRN1 into obese mice that reverses non-alcoholic fatty liver disease. We suggest that ubiquitin-dependent AMPK degradation represents a target therapeutic strategy for metabolic disorders.


Conflict of interest statement

The authors declare no competing interests.

Figures

Fig. 1
Fig. 1
MKRN1 depletion stimulates glucose metabolism by activating AMPK signalling. Analysis of wild-type (WT) or MKRN1-knockout (MK1/) littermate primary mouse embryonic fibroblasts (MEFs) and HepG2 cells transduced with two independent siRNAs targeting MKRN1 (siMK1 #6 and siMK1 #7) or a control siRNA for 48 h. a Glucose consumption in MK1/ MEFs (left) or MKRN1-depleted HepG2 cells (right) was measured based on the absorption of 2-[N-(7-nitrobenz-2-oxa-1,3-diazol-4-yl) amino]-2-deoxy-d-glucose (2-NBDG) by the cells. b, c Intracellular levels of glycolytic and citric acid cycle intermediates were determined by capillary electrophoresis–time-of-flight mass spectrometry of the MEFs. Each bar represents the relative amount of a metabolite for WT MEFs. G6P glucose-6-phosphate, F6P fructose-6-phosphate, F1,6-BP fructose-1,6-bisphosphate, G3P glucose-3-phosphate, 1,3-BG 1,3-bisphosphoglycerate, 3PG 3-phosphoglycerate, 2PG 2-phosphoglycerate, AcCoA acetyl-CoA, α-KG α-ketoglutarate. d, f To validate the AMPK signalling pathway or mRNA levels of AMPKα subunits, immunoblotting or quantitative real-time PCR analysis was performed using MEFs (d) and HepG2 cells (f). Cell lysates were immunoblotted with antibodies against pAMPKα, AMPKα, pACC, ACC, MKRN1 and actin. e The mRNA levels of glycolytic or lipogenic enzymes in MEFs were analysed by quantitative real-time PCR. g, h FFA-induced steatosis in HepG2 cells. Oil Red O staining (g) and TG levels (scale bar = 100 µm (top), 50 µm (bottom) (h) of the cells treated with FFA/FFA-free bovine serum albumin (BSA), which served as controls. All the experiments with MEFs were conducted in cells within the first 3–6 passages. i Fatty acid oxidation was analysed in MKRN1-depleted HepG2 cells. j The basal oxygen consumption rate (OCR) was measured in WT and MK1−/− MEFs. k After sequential treatment with oligomycin, FCCP and rotenone/antimycin-A in the presence of BSA or BSA conjugated to palmitate, OCR was measured in WT or MK1/− MEFs. The results were normalised against total protein levels using XF-Analyze. All data are presented as the mean ± standard deviation (s.d.) of triplicate samples and are representative of at least three independent experiments. two-tailed Student’s t-test; *P ≤ 0.05, **P ≤ 0.01, ***P ≤ 0.001
Fig. 2
Fig. 2
The E3 ubiquitin ligase MKRN1 ubiquitinates and degrades AMPKα subunits. a MKRN1 knockdown increases AMPKα1 protein levels. The HepG2 cells were transfected with MKRN1 siRNAs (#6 and #7). b MKRN1 knockout stabilises AMPKα. WT or MK1−/− MEFs were treated with CHX (100 mg ml−1) at the indicated time points. c, d MKRN1 expression promotes the proteasomal degradation of AMPKα subunits. The protein levels of ectopically expressed AMPK subunits were analysed using HEK293T cells. GFP was used as a transfection control (c). HepG2 cells were infected with retrovirus expressing MKRN1, followed by selection using puromycin. The cells were treated with 20 µM of MG132 for 6 h, and AMPKα1, α2, MKRN1 and actin were detected with the indicated antibodies (d). e MKRN1 induces both AMPKα1 and α2 ubiquitination. Constructs expressing FLAG/AMPKα1, α2, β1, γ1, 3.1/MKRN1 and HA/Ub were transfected into 293T cells. The ubiquitination assay was performed using cell lysates under denaturing conditions (in 1% SDS buffer). f, g MKRN1 directly ubiquitinates AMPKα subunits. In vitro ubiquitination of AMPKα1 (f) and α2 (g). h, i MKRN1 is required for the ubiquitination of AMPKα. Ubiquitinated endogenous AMPKα was determined under denaturing conditions using MG132-treated MEFs (h) and HepG2 cells (i). All the experiments with MEFs were conducted in cells within the first 3–6 passages. The data are representative of at least three independent experiments
Fig. 3
Fig. 3
A lack of MKRN1 expression reduces obesity in mice placed on an HFD. Male WT and MK1−/− mice fed a chow diet or an HFD for 16 weeks. a Representative images of male WT and MK1−/− mice fed a chow diet (left) or an HFD (right). b The body weights of male mice on a chow diet (left) or on an HFD (right) were measured every 4 days. c Body weight gain in male mice fed a chow diet or an HFD for 12 weeks (chow, WT n = 10 and MK1−/− n = 12; HFD, WT n = 16 and MK1−/− n = 18). d, e Fat volume (Vis visceral, SQ subcutaneous, Abd abdominal adipose tissue) and lean mass weight were calculated (e) through micro-CT imaging (d) of WT and MK1−/− mice on an HFD (n = 5 mice per group). P-value compared with WT. f, g Representative images of epididymal fat (left), subcutaneous fat (right) (top, scale bar = 1 cm) and H&E staining (bottom, scale bar = 50 (Epi) or 100 (Sub) µm) (f) and quantitative analysis of the adipocyte area (g) in male WT and MK1−/− mice fed an HFD (n= 5 mice per group). P-value compared with WT. h Plasma concentrations of TG and cholesterol in 24 h-fasted male mice fed an HFD (n = 6 mice per group). The images in a, d and f are representative images from the respective experiments. Two-tailed Student’s t-test; *P ≤ 0.05, **P ≤ 0.01, ***P ≤ 0.001, n.s. not significant. Mean ± s.d.
Fig. 4
Fig. 4
Effect of MKRN1 deficiency on hepatic AMPK signalling and diet-induced NAFLD. Livers from male WT and MK1−/− mice fed a chow diet or an HFD for 16 weeks were analysed. a Representative livers from mice on an HFD (upper left; fatty livers of HFD-fed WT mice) or a chow diet (upper right; normal livers of chow-fed WT mice). Scale bar = 1 cm. b H&E staining of livers. Scale bar = left, 250 µm; middle, 100 µm; and right, 25 µm. c Liver weights (n = 9 HFD-fed mice, n = 6 chow-fed mice per group). d Representative images of Oil Red O-stained livers (n = 6 mice per group). Scale bar = 100 and 25 µm. e Liver TG contents (WT n = 6 and MK1−/− n = 7). f Representative images of immunohistochemical staining for macrophage antigens (F4/80) in liver sections. Scale bar = 100 µm. g Hepatic AMPK signalling in WT or MK1−/− mice. h Relative mRNA levels of genes related to hepatic lipogenesis (WT n = 5 and MK1−/− n = 6). i ALT and AST serum levels (WT n = 7 and MK1−/− n = 8). j Schedule of AMPKα2 knockdown. WT and MKRN1-null mice were injected with Ad_US (as control) or Ad_shα2 (shRNA targeting AMPKα2) via the tail vein. km Hepatic steatosis induced by MKRN1 deficiency was rescued by the ablation of AMPKα2 using adenovirus. k Representative image of H&E staining. Scale bar = up, 50 µm; middle, 100 µm; and bottom, 500 µm. l Plasma TG contents were measured. m Lipogenic enzymes were analysed by quantitative real-time PCR in livers from WT and MK1−/− mice infected with adenoviruses. The data in c, e, h, i, l and m are presented as the mean ± s.d. Two-tailed Student’s t-test; *P ≤ 0.05, **P ≤ 0.01, ***P ≤ 0.001, n.s. not significant
Fig. 5
Fig. 5
Regulation of lipid and glucose metabolism by MKRN1 and AMPK. a, b Relative proportions of DEGs in MKRN1-null liver and adipose tissues according to their associated GOBPs. The GOBP terms at level 1 (a) and levels 2–4 (b) were used for general cellular processes and metabolic processes, respectively. c Cellular processes related to lipid and carbohydrate metabolism enriched by the up- and downregulated genes identified in MKRN1-null liver or adipose tissue. The bars represent −log10 (P-value), where the P-value is the significance of the processes being enriched by the up- or downregulated genes. d Heat maps showing the changes in the expression of DEGs involved in fatty acid biosynthesis and β-oxidation, gluconeogenesis and thermogenesis. The colour bar shows the gradient of the log2 fold changes of mRNA expression levels in MKRN1-depleted samples relative to those in WT samples. e, f Network models describing alterations of metabolic reactions regulated by DEGs in MKRN1-null livers (e) and adipose tissue (f). Arrows denote metabolic reactions, and dotted lines denote the transportation of molecules or regulation involving intermediate regulators between the linked molecules. Node colours represent up- (red) or downregulation (green) in MKRN1-null livers or adipose tissue. The colour bar represents the gradient of the log2 fold changes of mRNA expression levels induced by MKRN1 ablation relative to those in WT
Fig. 6
Fig. 6
Ablation of hepatic MKRN1 improves hepatic steatosis in diet-induced obese mice. a Male B6 mice (6 weeks old) were fed an HFD for 9 weeks and then injected with either PBS or adenoviruses expressing GFP via the tail vein (Ad_control, Ad_shMK1 #1 and #2 (shRNA targeting MKRN1)). After 1 week of continuous HFD feeding, the mice were sacrificed and analysed. b Immunoblot analysis of GFP expression in extracts from the indicated tissues (Sub subcutaneous fat, Epi epididymal fat) of mice infected with adenovirus (n = 2). c, d Liver (e) and BAT (d) lysates from adenovirus-injected mice were analysed by immunoblotting as indicated. e Body weights of male mice fed with an HFD were measured in every 2 days for 8 days (n = 5 mice per group). f Representative H&E staining of liver sections. Scale bar = 50, 100 and 500 µm. g Liver TG levels were measured. h Lipogenic enzymes were analysed via quantitative real-time PCR (n = 5 mice per group). i Representative H&E staining of epididymal fat (top) and subcutaneous fat (bottom) sections. Scale bar = 500 µm. j The weights of fat tissues were recorded following sacrifice. k Liver TG levels (n = 5 mice per group). Plasma lipid (TG, cholesterol and FFA) concentrations in 24-h-fasted mice (n = 5 mice per group). The data are presented as the mean ± s.d. Two-tailed Student’s t-test; *P ≤ 0.05, **P ≤ 0.01, ***P ≤ 0.001.

Comment in

Similar articles

Cited by

References

    1. Dietrich MO, Horvath TL. Limitations in anti-obesity drug development: the critical role of hunger-promoting neurons. Nat. Rev. Drug Discov. 2012;11:675–691. doi: 10.1038/nrd3739. - DOI - PubMed
    1. Tseng YH, Cypess AM, Kahn CR. Cellular bioenergetics as a target for obesity therapy. Nat. Rev. Drug Discov. 2010;9:465–482. doi: 10.1038/nrd3138. - DOI - PMC - PubMed
    1. Grundy SM. Drug therapy of the metabolic syndrome: minimizing the emerging crisis in polypharmacy. Nat. Rev. Drug Discov. 2006;5:295–309. doi: 10.1038/nrd2005. - DOI - PubMed
    1. Spiegelman BM, Flier JS. Obesity and the regulation of energy balance. Cell. 2001;104:531–543. doi: 10.1016/S0092-8674(01)00240-9. - DOI - PubMed
    1. Ruderman NB, Carling D, Prentki M, Cacicedo JM. AMPK, insulin resistance, and the metabolic syndrome. J. Clin. Invest. 2013;123:2764–2772. doi: 10.1172/JCI67227. - DOI - PMC - PubMed

Publication types

MeSH terms

Substances