. 2018 Aug 24;9(1):3422.
doi: 10.1038/s41467-018-05464-2.

Active site localization of methane oxidation on Pt nanocrystals

Affiliations

Active site localization of methane oxidation on Pt nanocrystals

Dongjin Kim et al. Nat Commun. .

Abstract

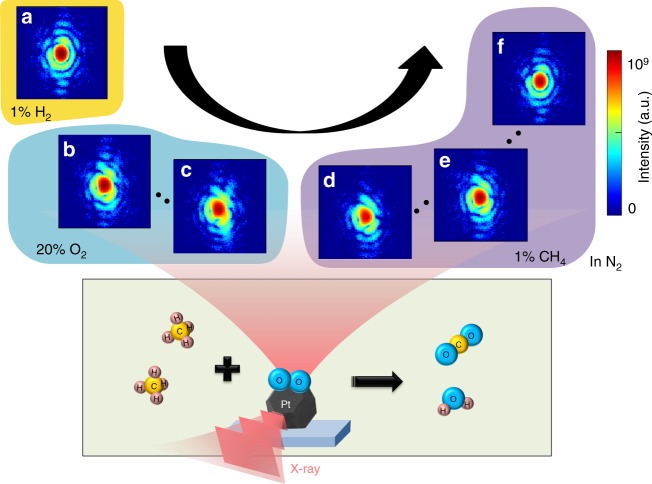
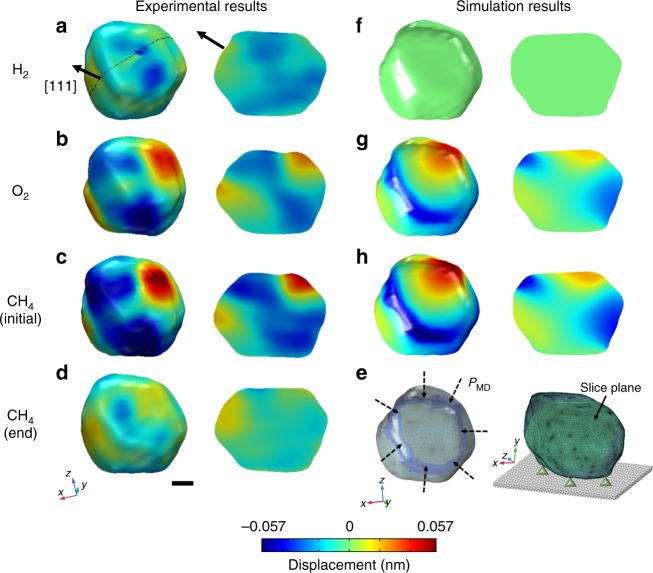
High catalytic efficiency in metal nanocatalysts is attributed to large surface area to volume ratios and an abundance of under-coordinated atoms that can decrease kinetic barriers. Although overall shape or size changes of nanocatalysts have been observed as a result of catalytic processes, structural changes at low-coordination sites such as edges, remain poorly understood. Here, we report high-lattice distortion at edges of Pt nanocrystals during heterogeneous catalytic methane oxidation based on in situ 3D Bragg coherent X-ray diffraction imaging. We directly observe contraction at edges owing to adsorption of oxygen. This strain increases during methane oxidation and it returns to the original state after completing the reaction process. The results are in good agreement with finite element models that incorporate forces, as determined by reactive molecular dynamics simulations. Reaction mechanisms obtained from in situ strain imaging thus provide important insights for improving catalysts and designing future nanostructured catalytic materials.


Conflict of interest statement

The authors declare no competing interests.

Figures

Fig. 1
Fig. 1
Schematic of in situ Bragg coherent X-ray diffraction imaging (BCDI). The BCDI measurement scheme during methane catalytic oxidation illustrates the acquisition of (111) Bragg coherent diffraction patterns from the same Pt nanocrystal throughout. Slices through the Bragg coherent diffraction patterns are measured for Pt nanocrystals above the catalytic activation temperature in the presence of different gases. a After 36 min in H2, b 2.6 min, and c 36 min after the O2 insertion, d ~2.6 min, e 16 min, and f 36 min after CH4 was introduced. Under a 20% O2 gas flow, the diffraction pattern becomes distorted (b and c), and continue to evolve when CH4 is added. The distortion fades in f owing to completion of the methane catalytic oxidation process in 1% CH4
Fig. 2
Fig. 2
The cross-correlation map of the coherent X-ray diffraction (CXD) patterns. a, b Contour of intensities for the CXD pattern shown in Fig. 1a and Fig. 1b, respectively, with the red contour identifying the first fringes. c The cross-correlation map between each CXD pattern above activation temperature as a function of different gas flow conditions. The areas used in the correlation analysis are indicated as dashed boxes in the Supplementary Fig. 3a, b. Gas environments together with the exposure times are indicated on the x and y axis. Black arrows on the top show the time and gas environment for Fig. 1a–f. Time 0 indicates the start of each gas flow (1% H2, 20% O2, 1% CH4, and 1% H2). The correlation coefficient, 1, means total positive linear correlation and 0 no linear correlation
Fig. 3
Fig. 3
Reactive molecular dynamics (RMD) simulation of Pt catalytic activity. Images of a Pt nanocrystal colored by displacement from RMD simulation results and expanded views of the region marked out in the upper image. a Pt in an environment of pure H2. b Pt in an environment of pure O2. Surficial Pt atoms are displaced from their original position by oxidation of the edge and corner sites; those on faces of the particle show only weak displacements. c Oxidized Pt nanocrystals in the presence of CH4. d Analysis of the RMD of the ratio of adsorbed methane molecules to adsorbed oxygen atoms on the Pt nanocrystal. Only a fraction of the absorbed oxygen atoms are active for final product formation owing to steric hindrance. The solid line is a fit to A × [1 − exp(−t/B)] with t in ps, A and B are fitting constants. Extrapolating to infinite time yields an adsorption ratio of 0.398 ± 0.003 at any given time
Fig. 4
Fig. 4
Displacement distribution from the experiments and finite element analysis (FEA). ad 3D reconstructed images (left) and sliced images (right) including lattice displacements at (111) with 25% isosurface amplitude of a 220 nm Pt nanocrystal under each of the four gas environments for Fig. 1a, b, d, f, respectively. Red (positive sign) indicates the projected displacements along the [111] direction and blue (negative sign) implies the opposite direction. These 3D images show lattice contraction along the edges and corners owing to adsorption of oxygen atoms and methane oxidation. The cross-sections show that the distortion propagates deep into the interior of the Pt nanocrystal and is released after catalytic methane oxidation. e Images on the left show meshing of BCDI result. RMD-derived reaction-induced pressure (PMD) is applied to the region shaded in blue. Images on the right show the Dirichlet constraint of zero displacement, included in the FEA. The slice plane used for fh is also shown. fh The FEA predictions for the Pt nanocrystal response to adsorption induced external force obtained from RMD corresponding to ac. Crystal and slice planes are colored by the [111] projected displacement. Scale bar corresponds to 50 nm

References

    1. Aricò A, et al. Nanostructured materials for advanced energy conversion and storage devices. Nat. Mater. 2005;4:366–377. doi: 10.1038/nmat1368. - DOI - PubMed
    1. Wokaun A, et al. Nanoparticles in energy technology: examples from electrochemistry and catalysis. Angew. Chem. Int. Ed. Engl. 2005;44:2190–2209. doi: 10.1002/anie.200460466. - DOI - PubMed
    1. Calle-Vallejo F, et al. Finding optimal surface sites on heterogeneous catalysts by counting nearest neighbors. Science. 2015;350:185–189. doi: 10.1126/science.aab3501. - DOI - PubMed
    1. Hendriksen BLM, et al. The role of steps in surface catalysis and reaction oscillations. Nat. Chem. 2010;2:730–734. doi: 10.1038/nchem.728. - DOI - PubMed
    1. Jiang T, et al. Trends in CO oxidation rates for metal nanoparticles and close-packed, steeped, and kinked surfaces. J. Phys. Chem. C. 2009;113:10548–10553. doi: 10.1021/jp811185g. - DOI

Publication types

LinkOut - more resources