. 2018 Aug 24;9(1):3437.
doi: 10.1038/s41467-018-05872-4.

Immunomodulatory role of Keratin 76 in oral and gastric cancer

Affiliations

Immunomodulatory role of Keratin 76 in oral and gastric cancer

Inês Sequeira et al. Nat Commun. .

Abstract

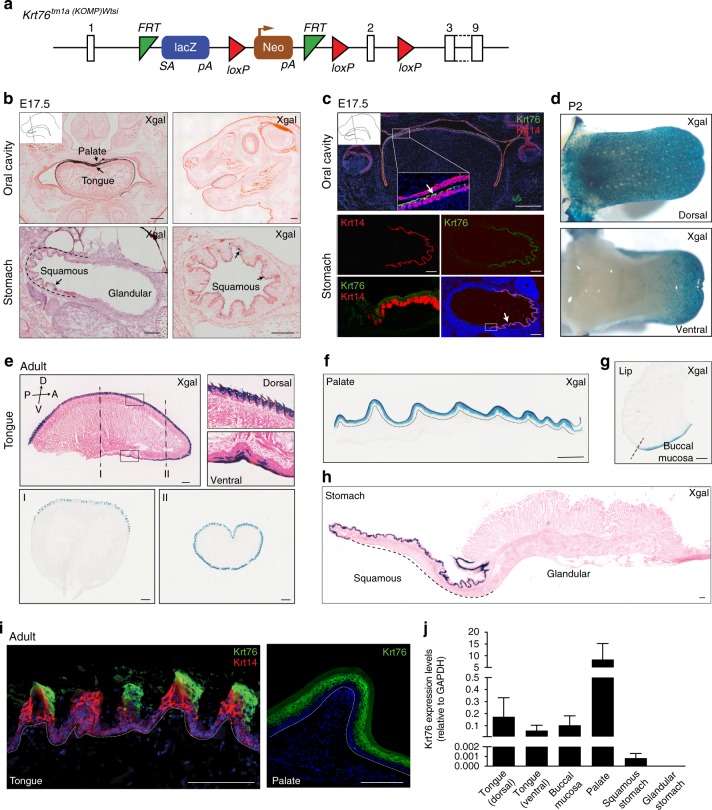
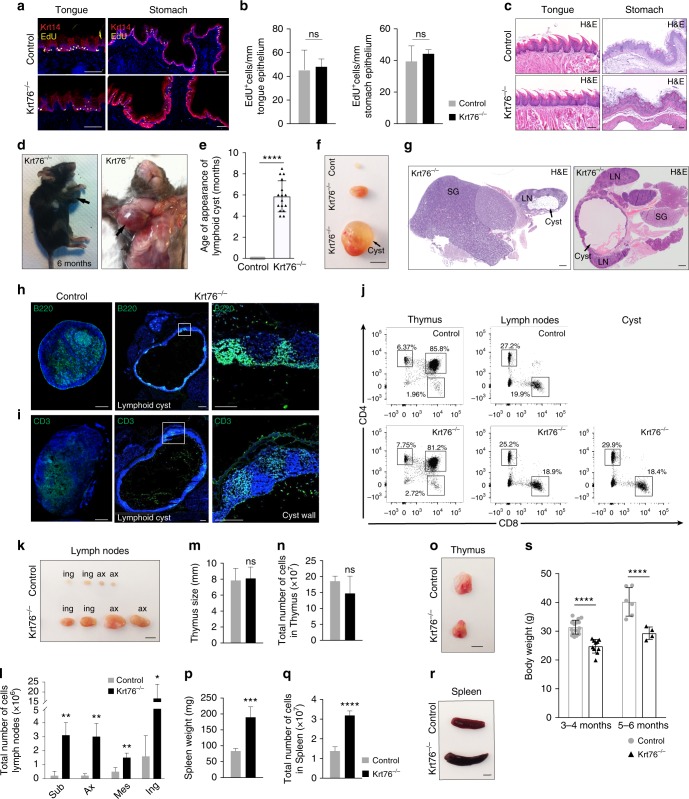
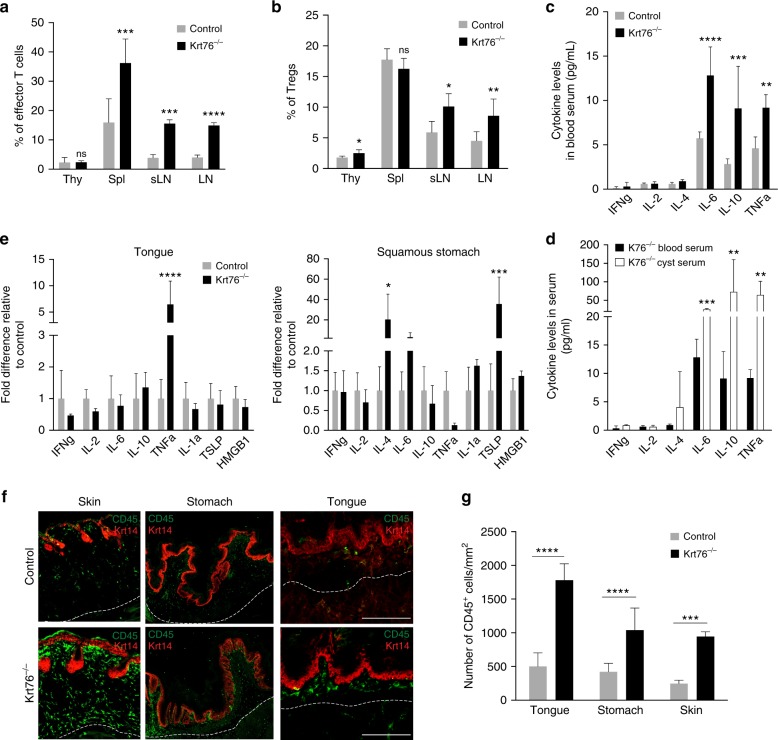
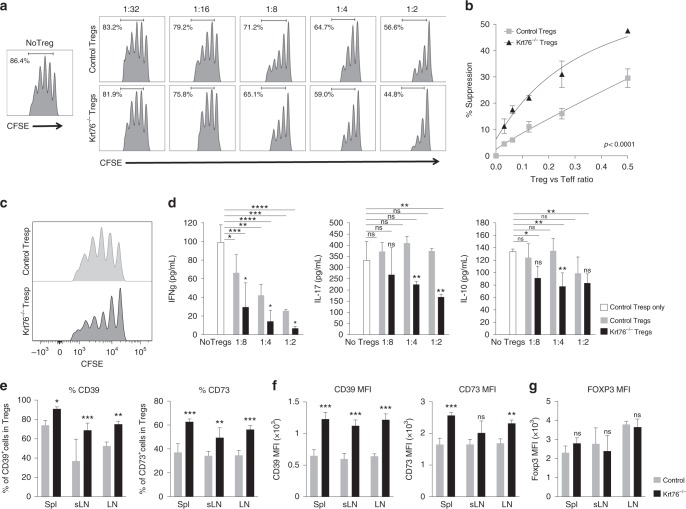
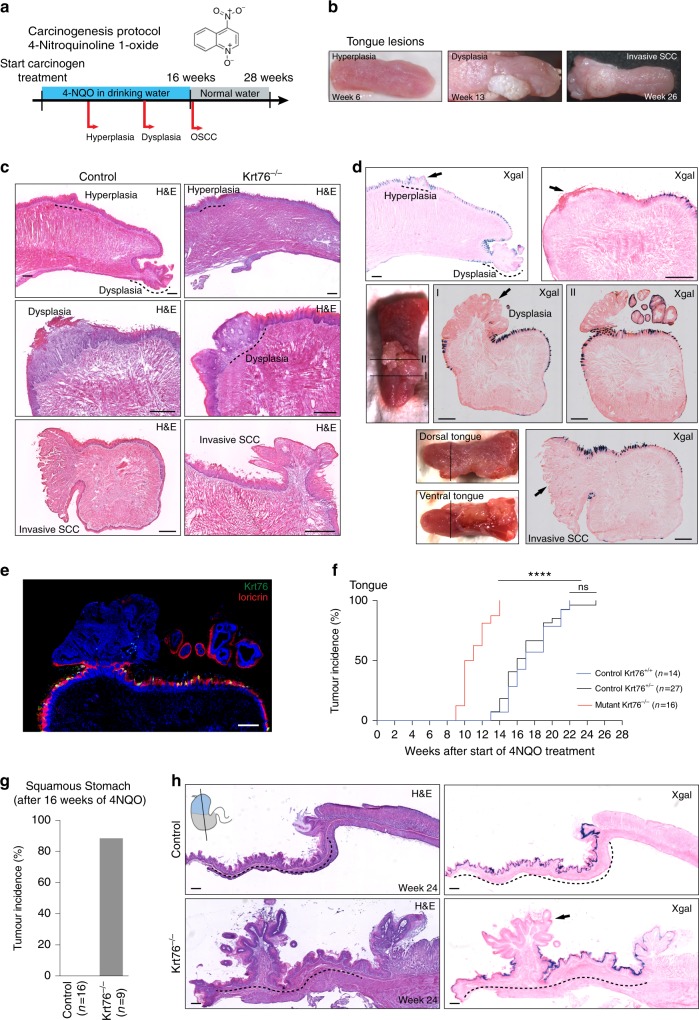
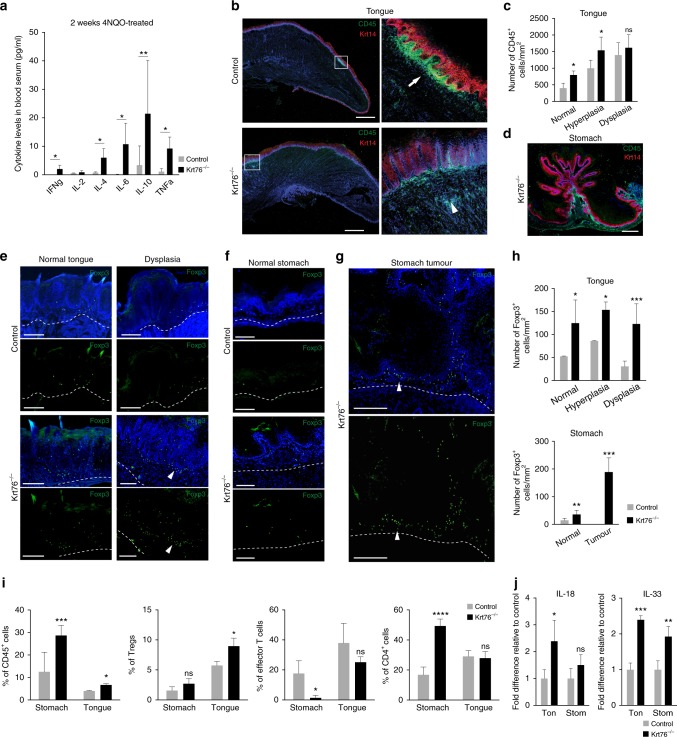
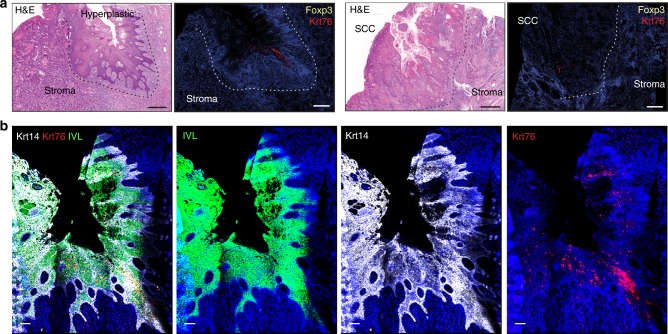
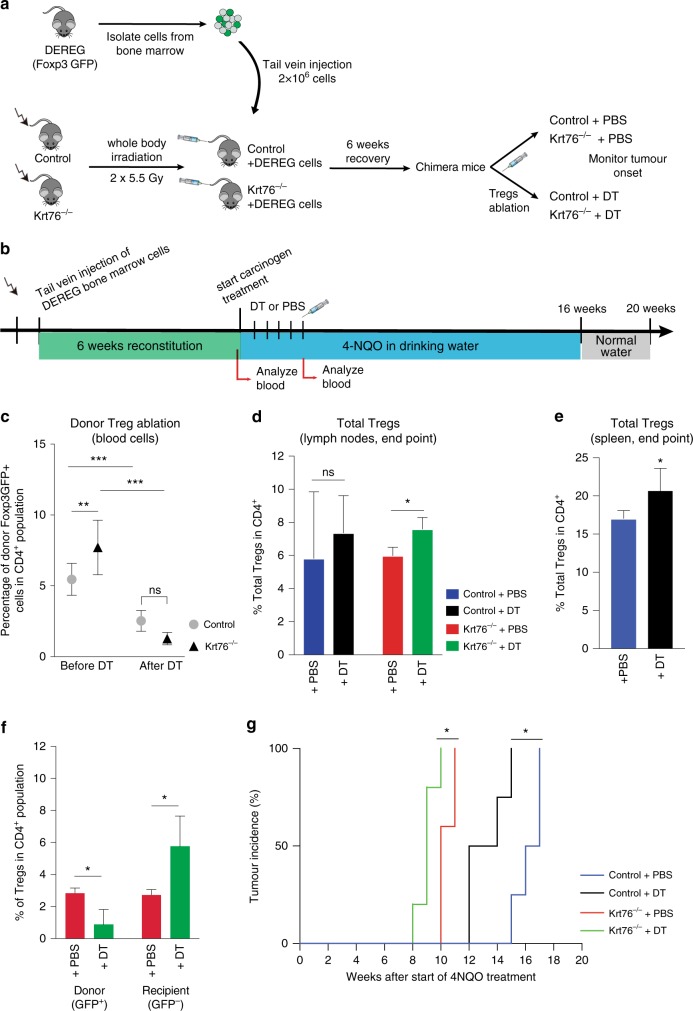
Keratin 76 (Krt76) is expressed in the differentiated epithelial layers of skin, oral cavity and squamous stomach. Krt76 downregulation in human oral squamous cell carcinomas (OSCC) correlates with poor prognosis. We show that genetic ablation of Krt76 in mice leads to spleen and lymph node enlargement, an increase in regulatory T cells (Tregs) and high levels of pro-inflammatory cytokines. Krt76-/- Tregs have increased suppressive ability correlated with increased CD39 and CD73 expression, while their effector T cells are less proliferative than controls. Loss of Krt76 increases carcinogen-induced tumours in tongue and squamous stomach. Carcinogenesis is further increased when Treg levels are elevated experimentally. The carcinogenesis response includes upregulation of pro-inflammatory cytokines and enhanced accumulation of Tregs in the tumour microenvironment. Tregs also accumulate in human OSCC exhibiting Krt76 loss. Our study highlights the role of epithelial cells in modulating carcinogenesis via communication with cells of the immune system.


Conflict of interest statement

F.M.W. is currently on secondment as Executive Chair of the UK Medical Research Council. The remaining authors declare no competing interests.

Figures

Fig. 1
Fig. 1
Keratin 76 is expressed in the oral epithelia and squamous stomach. a Krt76 knockout strategy. Krt76−/− mice were generated by disruption of the Krt76 gene via a knockout first allele targeting construct (reporter-tagged insertion with conditional potential). These animals have a splice acceptor-LacZ reporter gene integrated in the targeting gene, between exon 1 and 2, which allows tracing of gene expression whilst disrupting Krt76 protein expression. b X-gal staining (blue) of beta-galactosidase expressed under the control of the Krt76 promoter in the oral cavity and stomach (arrows) of Krt76+/− mouse embryos at E17.5. c Immunofluorescence labelling with anti-Krt76 (green) and anti-Krt14 (red) antibodies in the oral cavity and stomach of mouse embryos at E17.5. Bottom row: left hand panel is higher magnification view of boxed area in right hand panel. d Whole-mount X-gal staining of Krt76+/− reporter mice at post-natal day 2 (P2) shows Krt76 expression in the dorsal and lateral tongue, with partial expression in the ventral tongue. eh X-gal staining (blue) of beta-galactosidase expressed under the control of the Krt76 promoter in tongue (e), palate (f), lip and buccal mucosa (g) and in stomach (h) of Krt76+/− adult mice. h Mouse stomach is subdivided into two major histologically distinct regions: the squamous stomach lined with a stratified squamous epithelium and the glandular stomach, separated by the limiting ridge from the stratified squamous epithelium of the squamous stomach. Krt76 expression is restricted to the squamous stomach region. i Immunofluorescence labelling with anti-Krt76 (green) and anti-Krt14 (red) antibodies of adult wild-type mouse tissues, confirming the specificity of both anti-Krt76 antibody and X-gal staining. Samples were counterstained with nuclear dye DAPI (4′,6-diamidino-2-phenylindole). Dotted line delineates basement membrane. j Krt76 mRNA qRT-PCR analysis of adult tissues, relative to Gapdh (n = 3 mice, means ± s.e.m. are shown). Scale Bars = 500 µm (b, c), 100 µm (ei)
Fig. 2
Fig. 2
Loss of Krt76 leads to enlarged lymph nodes and spleen, without affecting tongue and stomach epithelial homoeostasis. Immunostaining (a) and quantification (b) of EdU-labelled cells per mm of tongue and squamous stomach epithelia (n = 3 mice/genotype, 2 sections/mouse and >6 fields quantified per section, means ± s.e.m. are shown). c Hematoxylin-eosin (H&E) stained sections. d Krt76−/− 6 month-old mouse with a neck cyst (arrowed). e Mean age (±s.e.m.) of onset of macroscopic neck lymphoid cysts in Krt76−/− (n = 16) and control mice (n = 41) (****p ≤ 0.0001, unpaired t-test). f Macroscopic views of submandibular lymph nodes from control and Krt76−/− mice and cyst from Krt76−/− mouse. Pictures are representative of 9 mice/genotype. g Hematoxylin-eosin stained sections of neck lymphoid cyst inside the lymph nodes (LN) at early (left) and advanced (right) stages, juxtaposed to the salivary glands (SG). h, i Immunofluorescence staining of lymph nodes and lymphoid cyst sections with (h) anti-B220 (B cell marker) and (i) anti-CD3 (T cell marker) with DAPI counterstain. j Representative flow cytometry dot plots showing T cell populations from thymus (CD4+ and CD8+), submandibular lymph nodes (CD4+ or CD8+) and neck lymphoid cyst (CD4+ or CD8+, as the lymph nodes) from Krt76−/− and control mice, showing percentages of total live cells (n = 3 experiments, n = 4 mice/experiment/genotype). k Lymph nodes from control and Krt76−/− mice. Pictures are representative of 9 mice from each genotype. l Quantification of the total absolute number of cells in lymph nodes of control and Krt76−/− mice. m, n Thymus size (m) and thymus cell number (n) in control and Krt76−/− mice. o Representative photograph of thymus from control and Krt76−/− mice. p, q Spleen weight (p) and absolute spleen cell numbers (q) in control and Krt76−/− mice. r Representative photograph of spleens from control and Krt76−/− mice. s Total body weight of control (n = 27) and Krt76−/− (n = 10) mice. l, m, n, p, q mean ± s.e.m., *p ≤ 0.05, **p ≤ 0.01, ***p ≤ 0.001, ****p ≤ 0.0001, unpaired t-test, n = 4 mice/genotype, measured in duplicate and experiment repeated twice. Scale bars: 100 µm (a, c, gi), 500 µm (f, k, o, r). Sub submandibular, Ax axillar, Mes mesenteric, Ing inguinal
Fig. 3
Fig. 3
Loss of Krt76 results in local and circulating increase in cytokines and expansion of Tregs. a, b Summary of flow cytometric analysis of % effector T cells (CD44high CD62Llow) (a) and Foxp3+ Tregs (b) in total TCRβ+ CD3+ CD4+ T cells in thymus (Thy), spleen (Spl) and lymph nodes (LN; sLN, submandibular lymph nodes) from control and Krt76−/− mice (n = 4 mice/genotype, mean ± s.e.m., unpaired t-test). c, d Levels of cytokines in blood serum (c) and cyst fluid (d) of control and Krt76−/− mice assessed by CBA analysis (n = 4 mice per genotype; experiment repeated twice, mean ± s.e.m., unpaired t-test). The same blood serum measurements for Krt76−/− mice are shown in c and d. e Quantitative RT-PCR of cytokine mRNAs, relative to Gapdh, in tongue and squamous stomach epithelia (n = 4 mice/genotype, mean ± s.e.m. of biological and technical triplicates; unpaired t-test). f, g Representative images of CD45 (green) and Keratin14 (red) stained sections of skin, tongue and squamous stomach epithelia (f), and quantification of infiltrating CD45+ leucocytes/mm2 of stromal region (g). Stromal region corresponds to area between the epithelium and the white dotted line; n = 3 mice per condition, 2 sections per mouse and >4 microscopic views per mice, means ± s.e.m., ***p ≤ 0.001, ****p ≤ 0.0001, unpaired t-test). *p ≤ 0.05; **p ≤ 0.01; ***p ≤ 0.001; ***p ≤ 0.001; ns non-significant. Scale bars: 100 µm
Fig. 4
Fig. 4
Phenotype and suppressive function of Krt76−/− Tregs. a Representative plots from a suppression assay involving different ratios of Tresp to Treg, showing CFSE profile quantified by flow cytometry after gating on CD4+ cells. This illustrates dose-dependent suppression of wild-type CD4+ CD25- Tresp proliferation in the presence of control or Krt76−/− Tregs. b Cumulative data showing % control Tresp suppression at each Tresp:Treg ratio in the presence of control or Krt76−/− Tregs. Mean ± s.e.m, two independent experiments, 2-way ANOVA, p < 0.0001, Non-linear regression (curve fit) of Treg suppression. c Representative plots of Tresp CFSE profiles after gating on CD4+ cells, illustrating proliferation of Tresp from Krt76−/− and control mice in the absence of Tregs. d Levels of cytokines in cell culture medium for each Tresp:Treg ratio, assessed by CBA analysis (means ± s.e.m., multiple t-tests and two-way ANOVA, each culture condition in triplicate, measured in duplicate, experiment repeated twice). e Summary of flow cytometric analysis of % CD39+ and CD73+ Tregs from total Tregs (CD4+ CD25+ Foxp3+) in spleen (Spl), lymph nodes (LN) and submandibular LN (sLN) from control and Krt76−/− mice. f, g Maximum intensity fluorescence (MFI) of CD39, CD73 (f) and Foxp3 (g) expression in CD4+ CD25+ Foxp3+ Tregs (n = 4 mice/genotype, experiment repeated twice, mean ± s.e.m., unpaired t-test). *p ≤ 0.05; **p ≤ 0.01; ***p ≤ 0.001; ****p ≤ 0.0001; ns non-significant
Fig. 5
Fig. 5
Tongue and squamous stomach tumour incidence in Krt76−/− mice. a Schematic of 4NQO tumorigenesis protocol. b Representative macroscopic views of each stage of tongue tumour development. c, d Representative images of hematoxylin & eosin staining (H&E) (c) and X-gal staining (blue) (d) and respective macroscopic views of the tongue of control (n = 41 mice) and Krt76−/− mice (n = 16 mice). X-gal staining is used to visualize Krt76 expression. e Immunostaining for Krt76 (green) and Loricrin (red) (terminal differentiation marker) in a tongue section bearing two tumours, one of which expresses Krt76. f Tumour incidence in Krt76+/+ (n = 14, median = 17 weeks), Krt76+/− (n = 27, median = 16 weeks) and Krt76−/− mice (n = 16 mice, median = 10.5 weeks) (no significant difference between the wild-type Krt76+/+ and the heterozygous Krt76+/− controls; ****p < 0.0001 for Krt76−/− when compared to both controls; one-way ANOVA, Mantel–Cox test and Grehan–Breslow–Wilcoxon test). g Incidence of squamous stomach tumours in control (Krt76+/+ and Krt76+/−) (n = 16) and Krt76−/− mice (n = 9) harvested 16–28 weeks after the initiation of 4NQO treatment. h Representative images of H&E and X-gal staining (blue) of tumours in the squamous stomach. X-gal staining is used to visualize Krt76 expression. Dotted lines delineate the squamous stomach area. Scale bars: 100 µm
Fig. 6
Fig. 6
Infiltration of immune cell populations in tumour stroma. a Levels of cytokines in blood serum of control and Krt76−/− mice after 2 weeks of 4NQO treatment, assessed by CBA analysis (means ± s.e.m., unpaired t-test, 4 mice per genotype, measured in duplicate, experiment repeated twice). b Representative images of CD45 and Keratin 14 immunostaining in tongue lesions treated with 4NQO. Arrow and arrowhead indicate local accumulations of CD45+ cells. c Quantification of infiltrating CD45+ leucocytes in 4NQO-treated tongue (n = 3–8 mice/genotype, >4 microscopic views per region, means ± s.e.m., unpaired t-test). d Representative image of CD45 and Keratin 14 expression in stomach tumour. e Representative images of Foxp3+ Tregs in 4NQO-treated normal tongue (i.e., prior to development of hyperplasia) and dysplasias in control and Krt76−/− mice. f, g Representative images of immunostaining of Foxp3+ Tregs in 4NQO-treated normal stomach (f) and tumours (g). eg Dashed lines denote epithelial-stromal boundary; arrowheads denote FoxP3+ cells. h Quantification of infiltrating Foxp3+ Tregs in 4NQO-treated tongue and squamous stomach (n = 3–8 mice per condition and per genotype,>4 microscopic views per region, means ± s.e.m., unpaired t-test). i Summary of flow cytometric analysis of % CD45+, CD4+ or effector T cells (CD4+ CD44+ CD62Llow) cells in total live cells, and Foxp3+ Tregs in total CD4+ CD25+ T cells, in tongue and stomach epithelia after 4NQO treatment of control and Krt76−/− mice (n = 4 mice/genotype, means ± s.e.m., unpaired t-test). j Quantitative RT-PCR of IL-18 and IL-33 mRNAs in 4NQO-treated tongue and squamous stomach, normalised to glyceraldehyde 3-phosphate dehydrogenase (n = 4 mice/genotype, means ± s.e.m. of biological and technical triplicates; unpaired t-test). *p ≤ 0.05, **p ≤ 0.01, ***p ≤ 0.001; ****p ≤ 0.0001; ns non-significant. Scale bars: 100 µm
Fig. 7
Fig. 7
Krt76 expression and Foxp3+ Treg infiltration in human OSCC. a Representative images of H&E staining and immunostaining for Krt76 and Foxp3+ Tregs in human OSCCs. b Representative images of immunostaining of Krt76, keratin 14 (Krt14) and involucrin (IVL) with nuclear DAPI counterstain in human OSCC. Scale bars: 100 µm
Fig. 8
Fig. 8
4NQO-induced carcinogenesis in DEREG chimeric mice. a Experimental scheme. Recipient mice were irradiated with 5.5 Gy twice and received 2 × 106 cells from DEREG mouse BM by tail vein injection. Mice were allowed to recover for 6 weeks before injecting DT to ablate Treg. Control mice were injected with PBS. b Schematic of BM transfer and Treg ablation by injecting PBS control or DT for 5 weeks, followed by the 4NQO tumorigenesis protocol. c Efficiency of engraftment by Foxp3GFP+ donor Tregs and percentage of donor Treg depletion after DT treatment confirmed by flow cytometric analysis of blood cells. d, e Summary of flow cytometric analysis of % total Tregs (CD4+ CD25+ Foxp3+) in total CD4+ cells in lymph nodes (d) and spleen (e) of control DEREG/Krt76+/− (d, e) and DEREG/Krt76−/− (d) chimeric mice treated with DT or PBS. (n = 4–6 animals/group, mean ± s.e.m., Mann–Whitney test). f Summary of flow cytometric analysis of % donor (CD4+ CD25+ Foxp3+ GFP+) and recipient (CD4+ CD25+ Foxp3+ GFP-) Foxp3+ Tregs in total CD4+ lymph node cells from DEREG/Krt76−/− chimera mice treated with DT or PBS (n = 4–6 animals/group, mean ± s.e.m., unpaired t-test). g Tumour incidence in DEREG/Krt76+/+ and DEREG/Krt76−/− chimeric mice treated with DT or PBS (n = 5–6 animals/group, one-way ANOVA, Mantel-Cox test, p = 0.013 for DEREG/Krt76−/− and p = 0.016 DEREG/Krt76+/−). *p ≤ 0.05, **p ≤ 0.01, ***p ≤ 0.001; ns non-significant

Comment in

References

    1. Moll R, Divo M, Langbein L. The human keratins: biology and pathology. Histochem. Cell. Biol. 2008;129:705–733. doi: 10.1007/s00418-008-0435-6. - DOI - PMC - PubMed
    1. Herrmann H, Aebi U. Intermediate filaments: structure and assembly. Cold Spring Harb. Perspect. Biol. 2016;8:a018242. doi: 10.1101/cshperspect.a018242. - DOI - PMC - PubMed
    1. Hobbs RP, Lessard JC, Coulombe PA. Keratin intermediate filament proteins—novel regulators of inflammation and immunity in skin. J. Cell Sci. 2012;125:5257–5258. doi: 10.1242/jcs.122929. - DOI - PMC - PubMed
    1. Fischer H, et al. Loss of keratin K2 expression causes aberrant aggregation of K10, hyperkeratosis, and inflammation. J. Invest. Dermatol. 2014;134:2579–2588. doi: 10.1038/jid.2014.197. - DOI - PubMed
    1. Roth W, et al. Keratin 1 maintains skin integrity and participates in an inflammatory network in skin through interleukin-18. J. Cell Sci. 2012;125:5269–5279. doi: 10.1242/jcs.116574. - DOI - PubMed

Publication types