. 2018 Aug 24;8(1):12793.
doi: 10.1038/s41598-018-30839-2.

Mutant KLF1 in Adult Anemic Nan Mice Leads to Profound Transcriptome Changes and Disordered Erythropoiesis

Affiliations

Mutant KLF1 in Adult Anemic Nan Mice Leads to Profound Transcriptome Changes and Disordered Erythropoiesis

Danitza Nébor et al. Sci Rep. .

Abstract

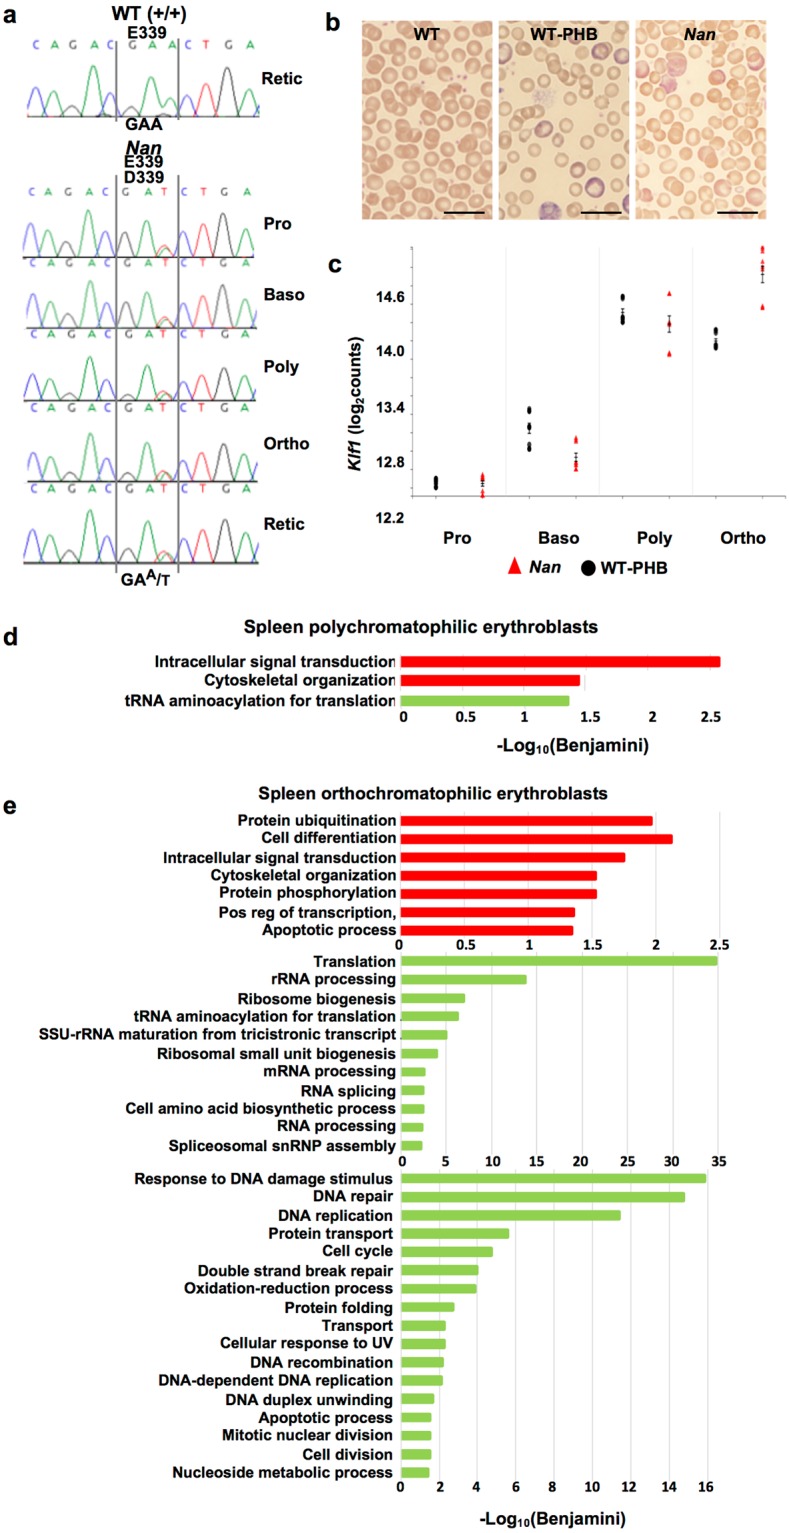
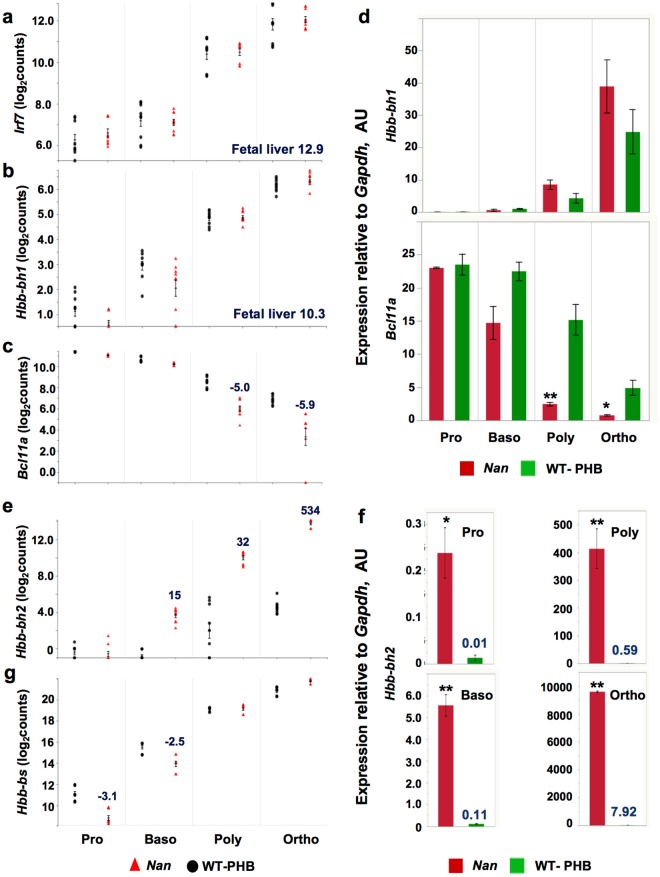
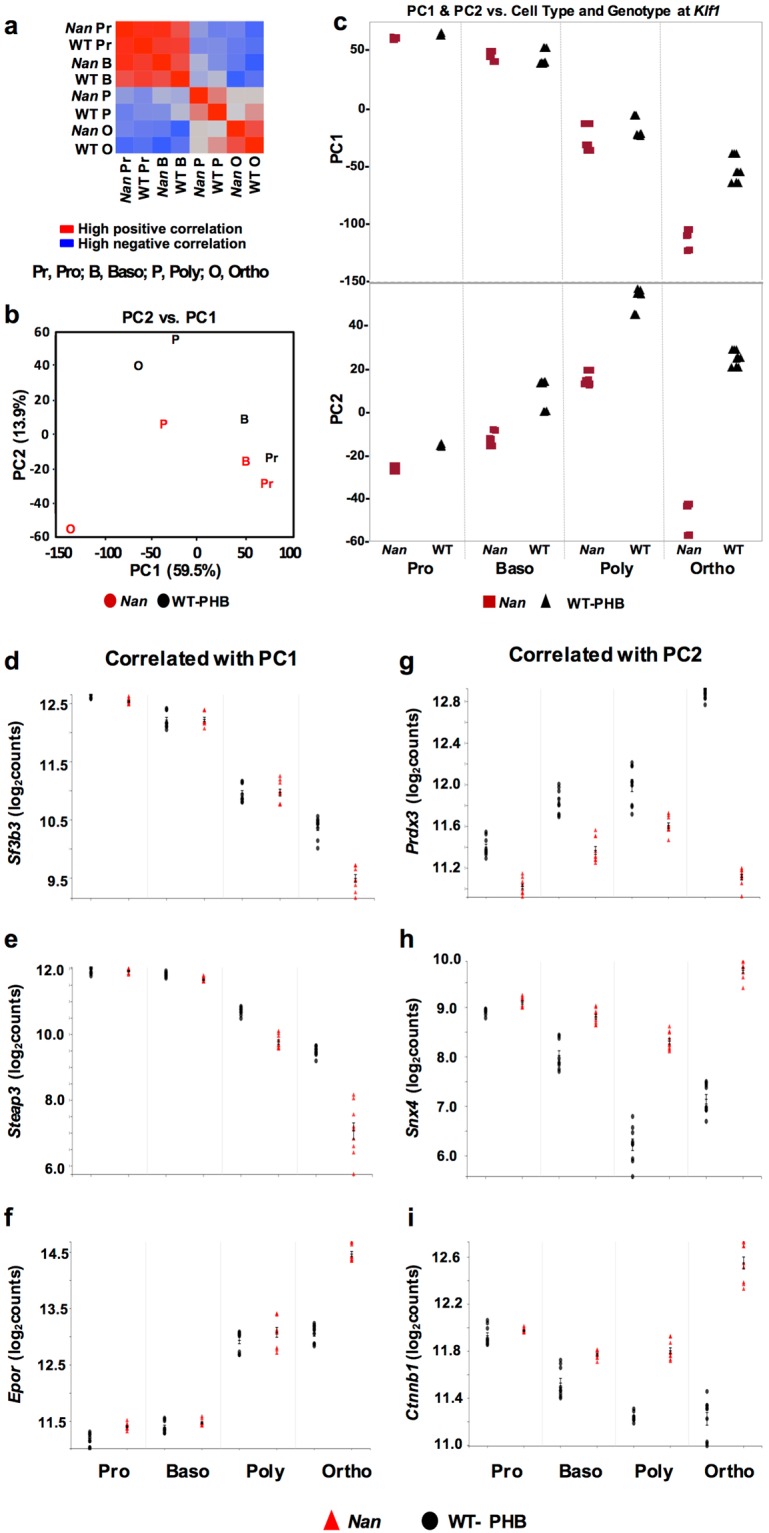
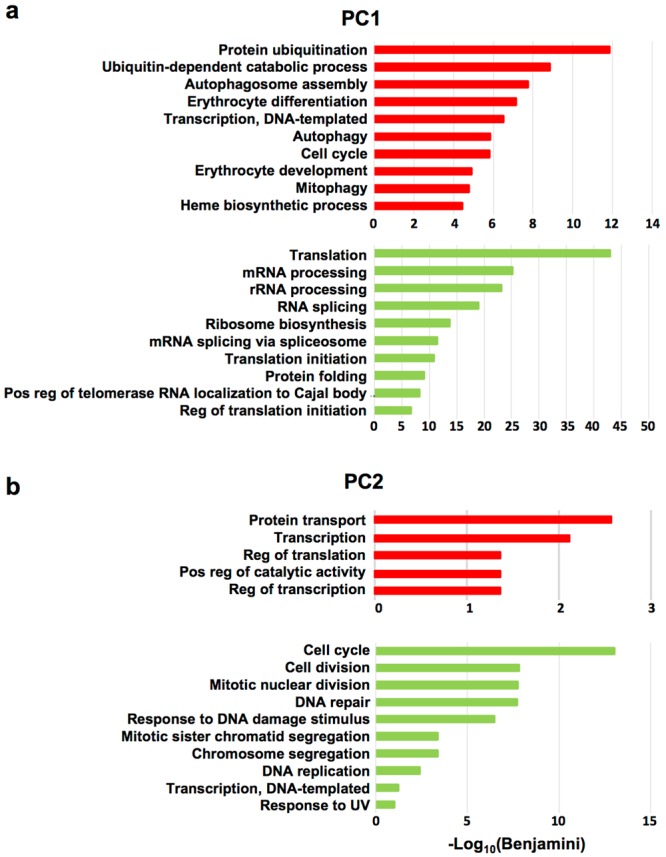
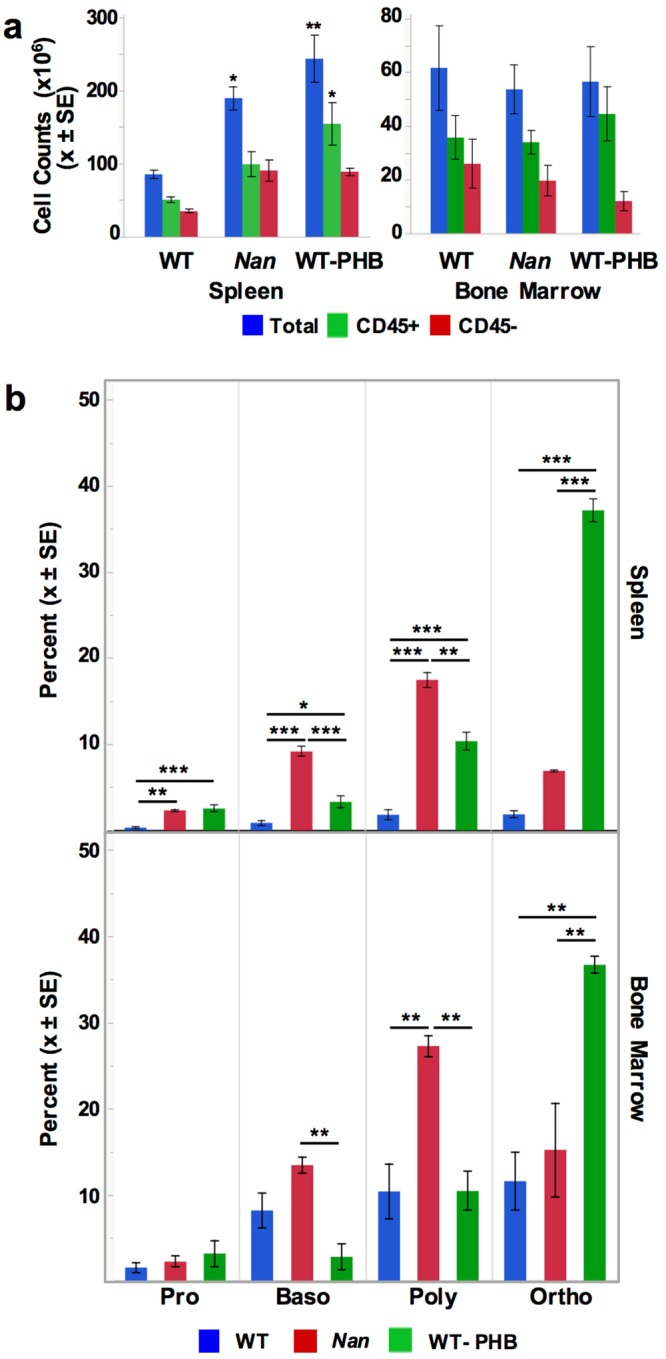
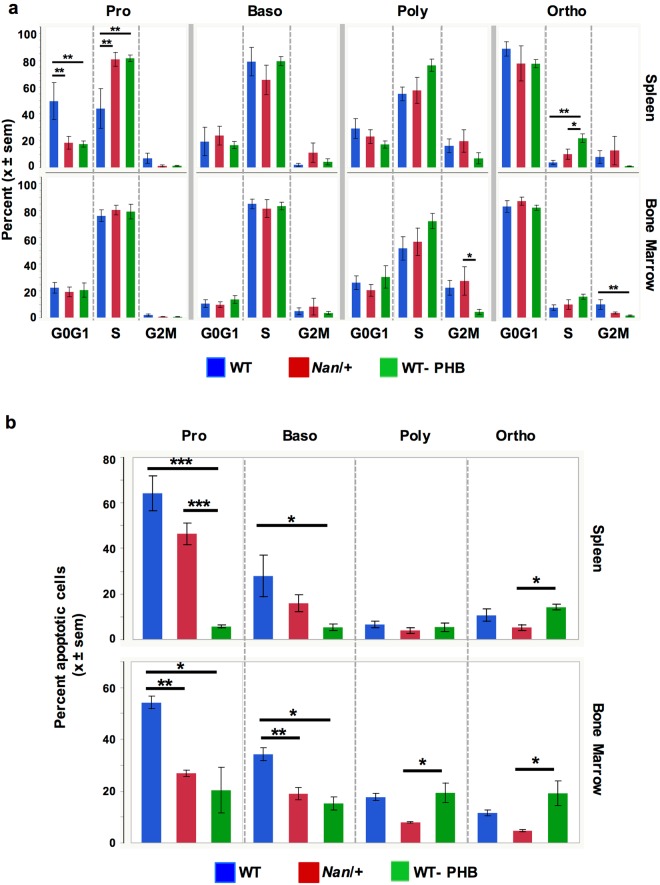
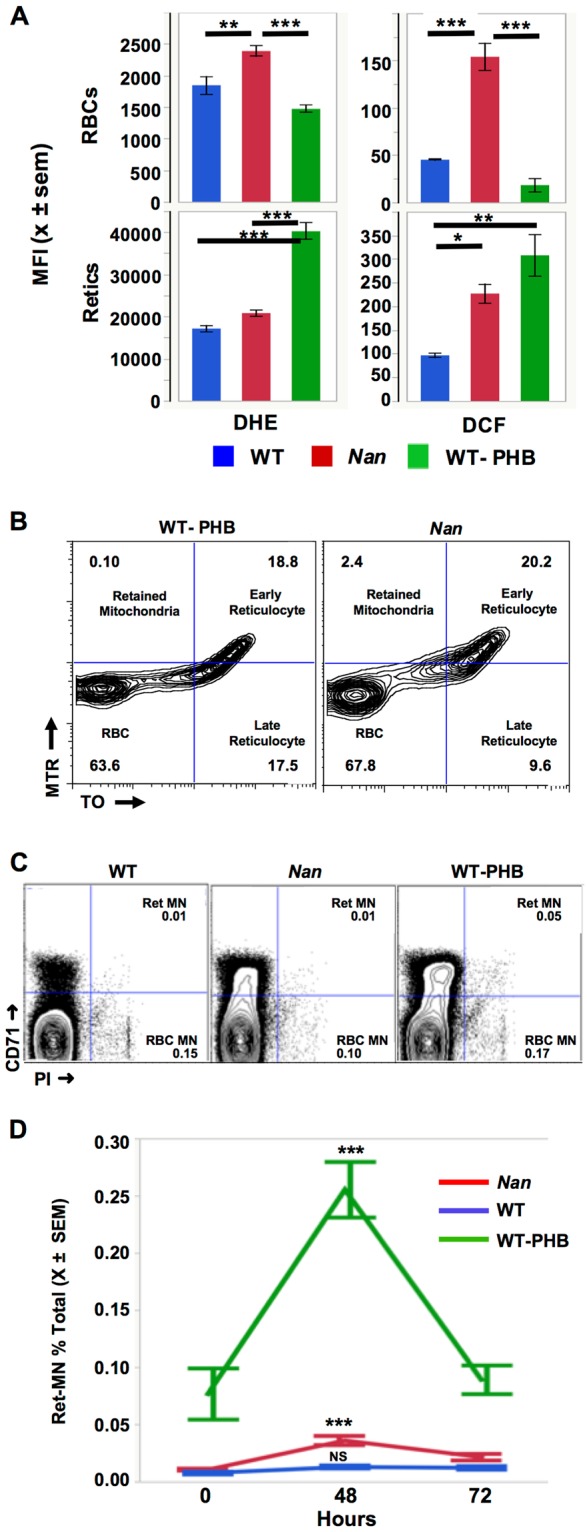
Anemic Nan mice carry a mutation (E339D) in the second zinc finger of erythroid transcription factor KLF1. Nan-KLF1 fails to bind a subset of normal KLF1 targets and ectopically binds a large set of genes not normally engaged by KLF1, resulting in a corrupted fetal liver transcriptome. Here, we performed RNAseq using flow cytometric-sorted spleen erythroid precursors from adult Nan and WT littermates rendered anemic by phlebotomy to identify global transcriptome changes specific to the Nan Klf1 mutation as opposed to anemia generally. Mutant Nan-KLF1 leads to extensive and progressive transcriptome corruption in adult spleen erythroid precursors such that stress erythropoiesis is severely compromised. Terminal erythroid differentiation is defective in the bone marrow as well. Principle component analysis reveals two major patterns of differential gene expression predicting that defects in basic cellular processes including translation, cell cycle, and DNA repair could contribute to disordered erythropoiesis and anemia in Nan. Significant erythroid precursor stage specific changes were identified in some of these processes in Nan. Remarkably, however, despite expression changes in large numbers of associated genes, most basic cellular processes were intact in Nan indicating that developing red cells display significant physiological resiliency and establish new homeostatic set points in vivo.


Conflict of interest statement

The authors declare no competing interests.

Figures

Figure 1
Figure 1
Aberrant erythroid transcriptome in adult anemic Nan mice. (a) cDNA sequence chromatograms showing transcription of Klf1 alleles in wild type control (WT, +/+) and sorted Nan spleen erythroid cells. Both the normal and mutant alleles are equally expressed in Nan throughout terminal differentiation. (b) Peripheral blood smears from untreated (non-anemic) WT and phlebotomized WT control (WT-PHB) and Nan adult mice. Bars, 10 µM. (c) Expression level (log2 counts) of Klf1 in WT-PHB and Nan spleen erythroid precursors. Differences in Klf1 expression do not meet filtering criterion (fold change ≥2, false discovery rate ≤0.05) for differentially expressed genes in any of the precursor populations. The graph shows the three technical replicates for each of the 3 biological replicates, giving 9 points per genotype per cell type. Tick marks, mean ± SD. (d,e) Top functional annotations associated with up- (red) and down- (green) regulated gene expression in Nan spleen poly- and orthochromatophilic erythroblasts suggest multiple mechanisms could contribute to anemia in Nan. Note: In panel e terms broadly associated with translation and RNA processing are shown separately (middle) in order to display other highly significant functional annotations (bottom).
Figure 2
Figure 2
Nan- and erythroid niche-specific expression changes. Expression of (a) Irf7 and (b) Hbb-bh1 is not differentially regulated in Nan vs. WT-PHB spleen erythroid precursor cells while both are markedly upregulated in Nan fetal liver (fold change in Nan fetal liver from Supplemental Table 2 in blue). (c) Expression of Bcl11a. Fold change vs. WT-PHB in blue. (d) Confirmation of Hbb-bh1 (top) and Bcl11a (bottom) expression by quantitative RT-PCR. AU, arbitrary units, no significant differences. n = 3 for Nan and WT-PHB. (e) Hbb-bh2 is progressively upregulated during erythropoiesis in Nan, reaching a 534-fold increase at the orthochromatophilic stage. (f) Confirmation of dramatically up-regulated Hbb-bh2 expression in Nan by quantitative RT-PCR. Average values for WT-PHB are shown in blue to facilitate comparison to Nan. AU, arbitrary units; *p < 0.01 and **< 0.001 Nan vs. WT-PHB. n = 5 (Nan) and 6 (WT-PHB) except Ortho (n = 2 and 3, respectively). (g) Adult β-globin, Hbb-bs, is downregulated in Nan pro- and basophilic erythroblasts. The duplicated adult globin locus, Hbb-bt, shows the same pattern (http://nanexpression.mdibl.org/). Neither Hbb-bh2 nor Hbb-bt are differentially expressed in Nan whole fetal liver. Tick marks, mean ± SD. Note: All expression values are log2-transformed, normalized counts; therefore, values below 1 are considered background (no expression).
Figure 3
Figure 3
Principle component analysis (PCA). (a) Hierarchical clustering showing that expression differences are greatest in later stages of development (poly- and orthochromatophilic erythroblasts). (b) The first PC is dominated by cell type and accounts for 59.5% of the variation in expression while PC2 (13.9%) separates the samples within each cell type by genotype. (c) PC1 (top) and PC2 (bottom) plotted by genotype as differentiation proceeds from pro- orthochromatophilic erythroblasts reveal two major patterns of differential expression in Nan. (d) Sf3b3 (splicing factor 3b, subunit 3) and (e) Steap3 (STEAP family member 3) are positively, and (f) Epor (erythropoietin receptor) negatively correlated with PC1 where the most prominent expression differences are late in differentiation at the orthochromatophilic stage. (g) Prdx3 (Peroxiredoxin 3) is negatively correlated with PC2 while (h) Snx4 (Sorting nexin-4) and (i) Ctnnb1 (β-catenin) are positively correlated with PC2. Genes correlated with PC2 show severe dysregulation throughout differentiation in Nan with a striking reversal at the orthochromatophilic stage. Tick marks, X ± SD.
Figure 4
Figure 4
Functional annotation GO terms for PC1- and PC2- correlated DEGs. Top functional annotations associated with (a) PC1 and (b) PC2 DEGs. Genes negatively correlated with each PC are shown at the top in red and those positively correlated below in green. Note that correlation and expression are inversely related for PC1 genes (e.g., expression of negatively correlated genes increases during differentiation), but directly related in the case of PC2 (refer to Fig. 3c). Red and green also correspond to up- and down-regulated DEGs, respectively, in Nan. For this analysis, only the most significantly correlated genes (Supplemental Table 9) were included. For PC1, a cutoff of ±0.9 was used. For PC2, the cutoffs were −0.60 and +0.75 for negatively and positively correlated genes, respectively. Expanded correlation values were included for PC2 GO analysis due to the lower number of genes in this category.
Figure 5
Figure 5
Erythropoiesis is delayed in Nan spleen. (a) Total, CD45 positive and CD45 negative cell counts in WT, Nan, and WT-PHB spleen (n = 3, 10, and 4, respectively) and bone marrow (n = 4/group). (b) Quantitation of the different spleen populations demonstrates an accumulation of pro-, baso and- polychromatophilic erythroblasts in Nan spleen (top panel) and baso- and- polychromatophilic erythroblasts in Nan bone marrow (bottom). As a result, production of orthochromatophilic erythroblasts markedly lags that of WT-PHB. n = 4/group. *P < 0.05; **p < 0.01; ***p < 0.001.
Figure 6
Figure 6
Cell cycle status and apoptosis in spleen and bone marrow. (a) Cell cycle status determined using BrdU in spleen (top) and bone marrow (bottom) erythroid precursors. Spleen, n = 6 (WT), 8 (Nan), 9 (WT-PHB); bone marrow, n = 3/group. (b) Apoptosis in spleen (top) and bone marrow (bottom) erythroid precursors. Spleen, n = 9 (WT), 10 (Nan), 7 (WT-PHB); bone marrow, n = 3 per group. *P < 0.05; **p < 0.01; ***p < 0.001.
Figure 7
Figure 7
ROS generation, mitophagy, and DNA damage in Nan. (A) Quantitation of ROS production in Ter119 positive, CD71 low (mature red blood cells) and Ter119 positive CD71 high (reticulocytes) populations. As expected, DCF and DHE production in mature red cells is lower than in reticulocytes. n = 3 per group. (B) Flow cytometry of MitoTracker Red (MTR) and Thiazole Orange (TO) stained WT and Nan red blood cells to assess mitochondria and ribosome content three days post-phlebotomy. Early reticulocytes are ribosome-positive, mitochondria-positive (upper right quadrant), late reticulocytes ribosome-positive, mitochondria-negative (lower right quadrant), and retained mitochondria ribosome-negative, mitochondria- positive (upper left quadrant). Cytograms representative of 3 samples/group. (C) Representative micronucleus assay results in non-irradiated mice. (D) Quantitation of induced micronuclei 48 and 72 hours following irradiation. n = 4 per group; ***p < 0.001 (within group comparison at 0 and 48 hours). PI, propidium iodide.

Similar articles

Cited by

References

    1. Siatecka M, et al. Severe anemia in the Nan mutant mouse caused by sequence-selective disruption of erythroid Kruppel-like factor. Proc Natl Acad Sci USA. 2010;107:15151–15156. doi: 10.1073/pnas.1004996107. - DOI - PMC - PubMed
    1. Heruth DP, et al. Mutation in erythroid specific transcription factor KLF1 causes Hereditary Spherocytosis in the Nan hemolytic anemia mouse model. Genomics. 2010;96:303–307. doi: 10.1016/j.ygeno.2010.07.009. - DOI - PMC - PubMed
    1. Miller IJ, Bieker JJ. A novel, erythroid cell-specific murine transcription factor that binds to the CACCC element and is related to the Kruppel family of nuclear proteins. Mol Cell Biol. 1993;13:2776–2786. doi: 10.1128/MCB.13.5.2776. - DOI - PMC - PubMed
    1. Drissen R, et al. The erythroid phenotype of EKLF-null mice: defects in hemoglobin metabolism and membrane stability. Mol Cell Biol. 2005;25:5205–5214. doi: 10.1128/MCB.25.12.5205-5214.2005. - DOI - PMC - PubMed
    1. Hodge D, et al. A global role for EKLF in definitive and primitive erythropoiesis. Blood. 2006;107:3359–3370. doi: 10.1182/blood-2005-07-2888. - DOI - PMC - PubMed

Publication types

MeSH terms

Substances