Comparative Study
. 2018 Aug 24;8(1):12769.
doi: 10.1038/s41598-018-31128-8.

Whole-genome sequencing and comparative analysis of two plant-associated strains of Rhodopseudomonas palustris (PS3 and YSC3)

Affiliations
Comparative Study

Whole-genome sequencing and comparative analysis of two plant-associated strains of Rhodopseudomonas palustris (PS3 and YSC3)

Kai-Jiun Lo et al. Sci Rep. .

Abstract

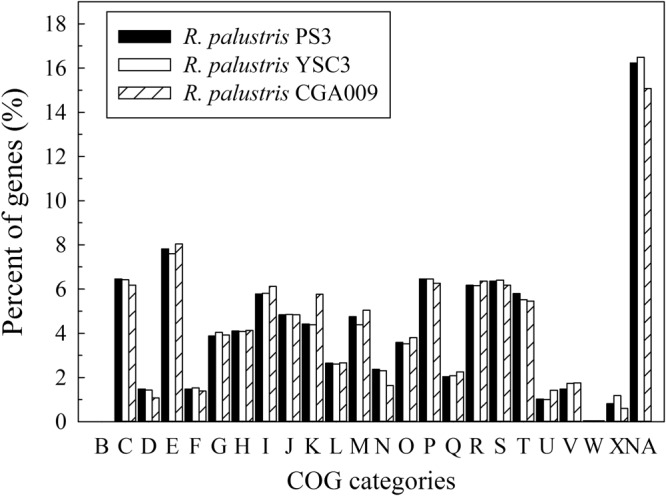
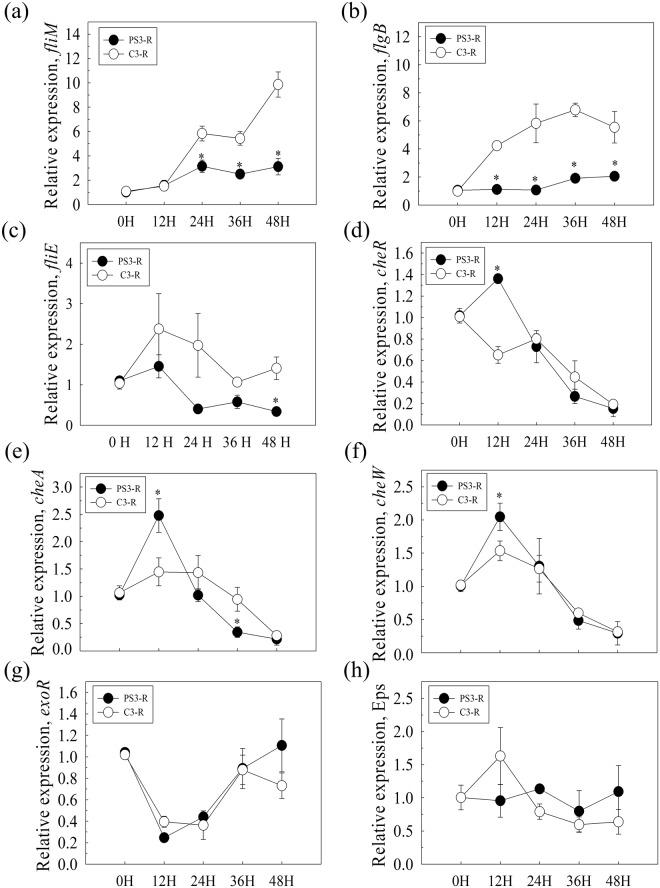
Rhodopseudomonas palustris strains PS3 and YSC3 are purple non-sulfur phototrophic bacteria isolated from Taiwanese paddy soils. PS3 has beneficial effects on plant growth and enhances the uptake efficiency of applied fertilizer nutrients. In contrast, YSC3 has no significant effect on plant growth. The genomic structures of PS3 and YSC3 are similar; each contains one circular chromosome that is 5,269,926 or 5,371,816 bp in size, with 4,799 or 4,907 protein-coding genes, respectively. In this study, a large class of genes involved in chemotaxis and motility was identified in both strains, and genes associated with plant growth promotion, such as nitrogen fixation-, IAA synthesis- and ACC deamination-associated genes, were also identified. We noticed that the growth rate, the amount of biofilm formation, and the relative expression levels of several chemotaxis-associated genes were significantly higher for PS3 than for YSC3 upon treatment with root exudates. These results indicate that PS3 responds better to the presence of plant hosts, which may contribute to the successful interactions of PS3 with plant hosts. Moreover, these findings indicate that the existence of gene clusters associated with plant growth promotion is required but not sufficient for a bacterium to exhibit phenotypes associated with plant growth promotion.


Conflict of interest statement

The authors declare no competing interests.

Figures

Figure 1
Figure 1
Genome map of Rhodopseudomonas palustris PS3 (a) and YSC3 (b). Rings from the outside as follows: (1) scale marks (unit, Mb), (2) genomic island, (3) protein-coding genes on the forward strand colored by COG category, (4) protein-coding genes on the reverse strand (same color scheme as the second circle), (5) rRNA genes, (6) GC content (deviation from average), and (7) GC skew in blue (below average) and yellow (above average).
Figure 2
Figure 2
Phylogenetic tree and genome alignments of R. palustris based on housekeeping and functional genes and nucleotide levels. Maximum-likelihood tree based on concatenated recA-rpoB-dnaK gene sequences (a) and puf gene sequences (b) showing the relationships among the R. palustris strains. Both bootstrap values (1000 replicates) are given at branch points and generated in MEGA7. (c,d) Pairwise genome alignments among R. palustris PS3, YSC3 and CGA009. Synteny plots show the comparison of the PS3 genome (c and d, vertical axis) with the genomes of YSC3 (c, horizontal axis) and CGA009 (d, horizontal axis). Forward matches are plotted in red, and reverse matches are plotted in blue. The nucleotide sequence similarities were calculated by software MUMmer with the nucmer function and represented as “*”.
Figure 3
Figure 3
Distribution patterns of homologous gene clusters. The homologous gene clusters are those located at the intersection of R. palustris PS3, YSC3 and CGA009.
Figure 4
Figure 4
COG categories in the three R. palustris strains. Functional categorization of genes was performed by the COG database. The y-axis indicates the percentage of genes assigned with the COG category relative to all genes. The x-axis represents the COG functional category. The groups in each COG category are as follows: (B) chromatin structure and dynamics; (C) energy production and conversion; (D) cell cycle control, cell division and chromosome partitioning; (E) amino acid transport and metabolism; (F) nucleotide transport and metabolism; (G) carbohydrate transport and metabolism; (H) coenzyme transport and metabolism; (I) lipid transport and metabolism; (J) translation, ribosomal structure and biogenesis; (K) transcription; (L) replication, recombination and repair; (M) cell wall/membrane/envelope biogenesis; (N) cell motility; (O) posttranslational modification, protein turnover and chaperones; (P) inorganic ion transport and metabolism; (Q) secondary metabolite biosynthesis, transport and catabolism; (R) general function prediction only; (S) function unknown; (T) signal transduction mechanisms; (U) intracellular trafficking, secretion and vesicular transport; (V) defense mechanisms; (W) extracellular structures; (X) mobilome: prophages and transposons; and (NA) no COG assignment.
Figure 5
Figure 5
Schematic depiction of genes involved in metabolism (PPP, TCA cycle, glycolysis, nitrogen assimilation), rhizosphere adaptation and plant growth promotion in R. palustris. Genes annotated in each strain are marked with colored circles representing PS3 (blue), YSC3 (green), and CGA009 (orange). Red arrows represent nonspecific genes that were annotated among the three strains. “?” represents unknown function.
Figure 6
Figure 6
Effects of Chinese cabbage root exudates on growth and biofilm formation of the R. palustris PS3 and YSC3 strains. (a) Growth curve of R. palustris strains in Hoagland NS and root exudate solution. (b) Biofilm formation was evaluated by 0.1% crystal violet staining for 15 min at 24 h postincubation. Both R. palustris strains were incubated in either half-strength Hoagland NS or root exudate solution (10% (v/v)). The letters indicate statistically significant differences based on Student’s t-test (P < 0.05).
Figure 7
Figure 7
Gene expression patterns of R. palustris strains in response to Chinese cabbage root exudate solution. R. palustris strains were incubated with Chinese cabbage root exudates, and then, the expression of flagella (fliM, flgB, fliE), chemotaxis (cheR, cheW, cheA) and biofilm formation (Eps and exo) genes was determined by qPCR relative to an internal control gene, clpX. Relative expression values (SE) were obtained from three biological repeats and measured for three technical repeats. Asterisks indicate significant differences based on Student’s t-test (P < 0.05).

References

    1. Kloepper, J. W. & Schroth, M. N. In Proceedings of the 4th international conference on plant pathogenic bacteria. (ed. Station de Pathologie Végétale et Phyto-Bactériologie) 879–882 (1978).
    1. Ahemad M, Kibret M. Mechanisms and applications of plant growth promoting rhizobacteria: Current perspective. J. King Saud Univ. Sci. 2014;26:1–20. doi: 10.1016/j.jksus.2013.05.001. - DOI
    1. Lugtenberg B, Kamilova F. Plant-growth-promoting rhizobacteria. Annu Rev Microbiol. 2009;63:541–556. doi: 10.1146/annurev.micro.62.081307.162918. - DOI - PubMed
    1. Goswami D, Thakker JN, Dhandhukia PC. Portraying mechanics of plant growth promoting rhizobacteria (PGPR): a review. Cogent Food Agric. 2016;2:1127500–1127518.
    1. Beneduzi A, Ambrosini A, Passaglia LMP. Plant growth-promoting rhizobacteria (PGPR): Their potential as antagonists and biocontrol agents. Genet Mol Biol. 2012;35:1044–1051. doi: 10.1590/S1415-47572012000600020. - DOI - PMC - PubMed

Publication types

MeSH terms

LinkOut - more resources