. 2018 Dec;57(12):653-664.
doi: 10.1002/gcc.22679. Epub 2018 Oct 25.

Genomic analysis reveals recurrent deletion of JAK-STAT signaling inhibitors HNRNPK and SOCS1 in mycosis fungoides

Affiliations

Genomic analysis reveals recurrent deletion of JAK-STAT signaling inhibitors HNRNPK and SOCS1 in mycosis fungoides

Armando N Bastidas Torres et al. Genes Chromosomes Cancer. 2018 Dec.

Abstract

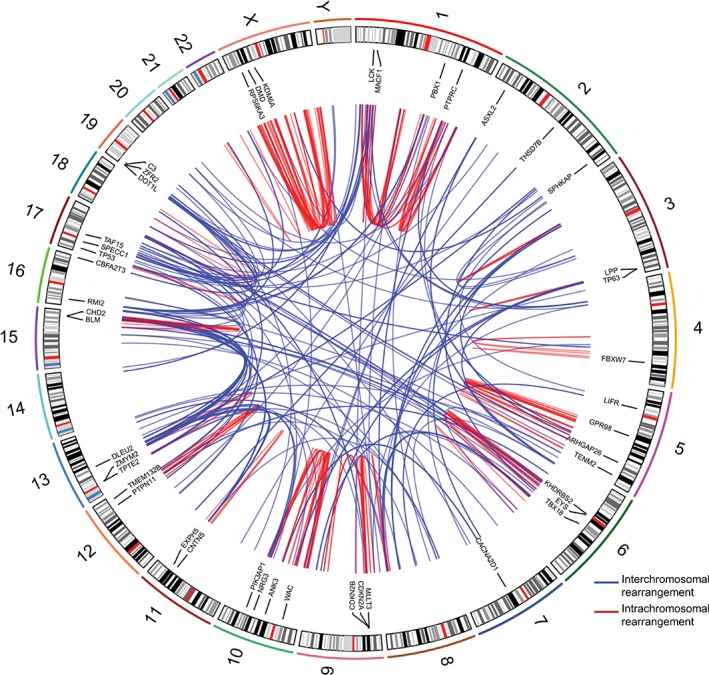
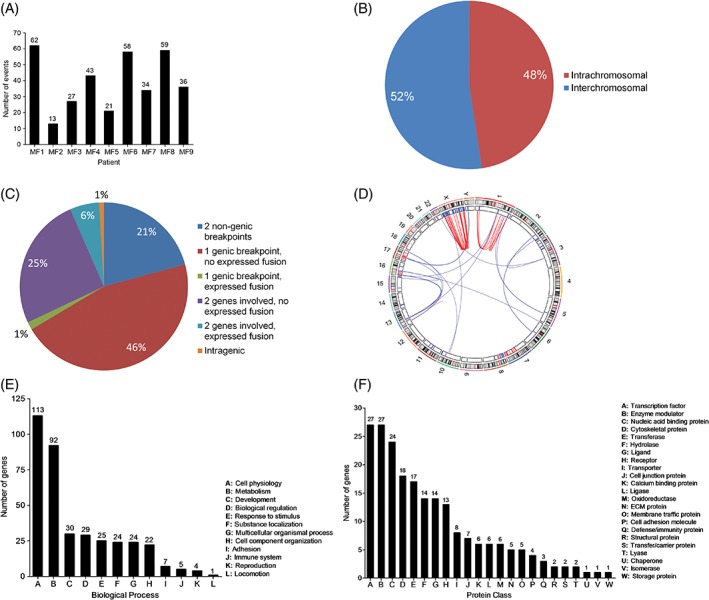
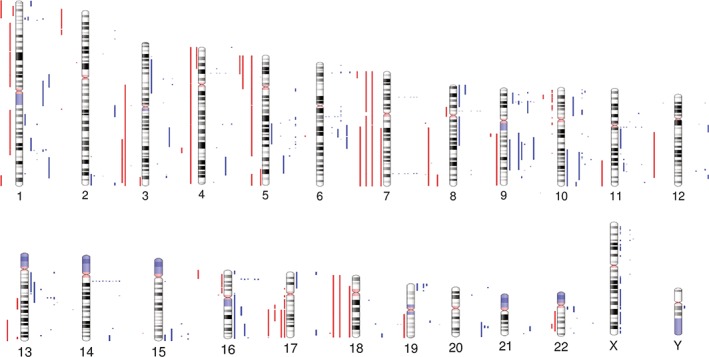
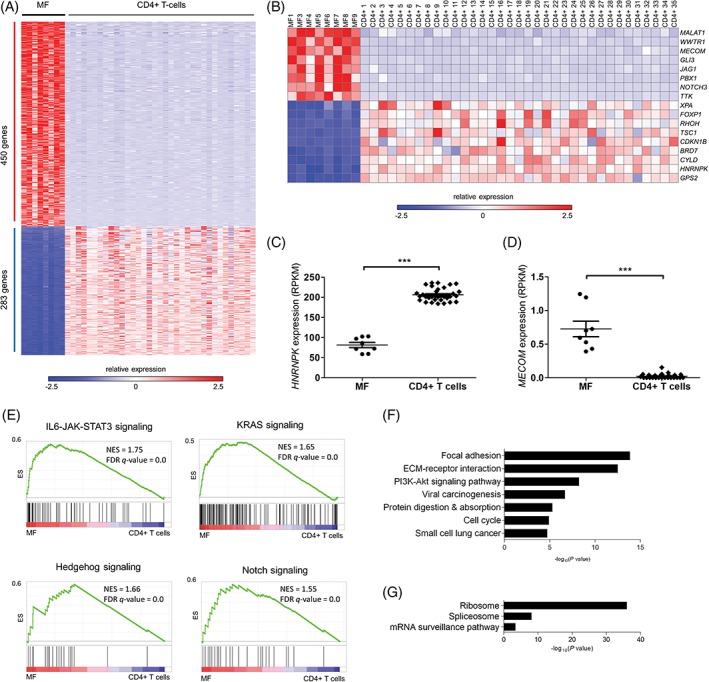
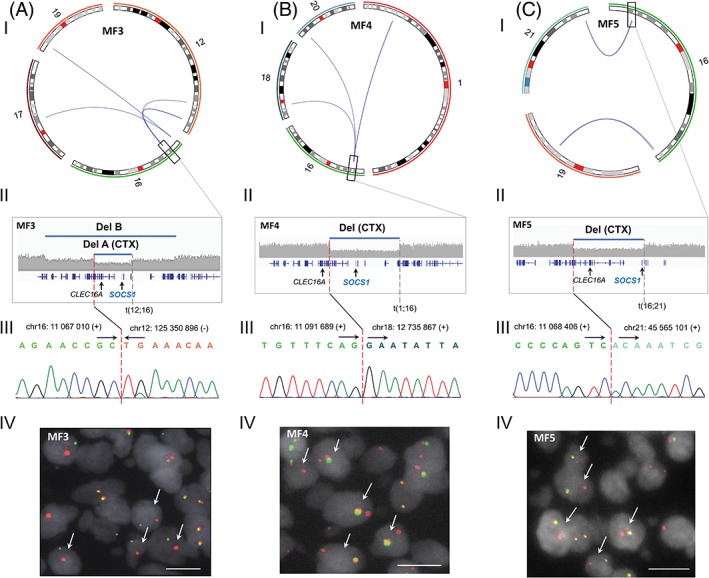
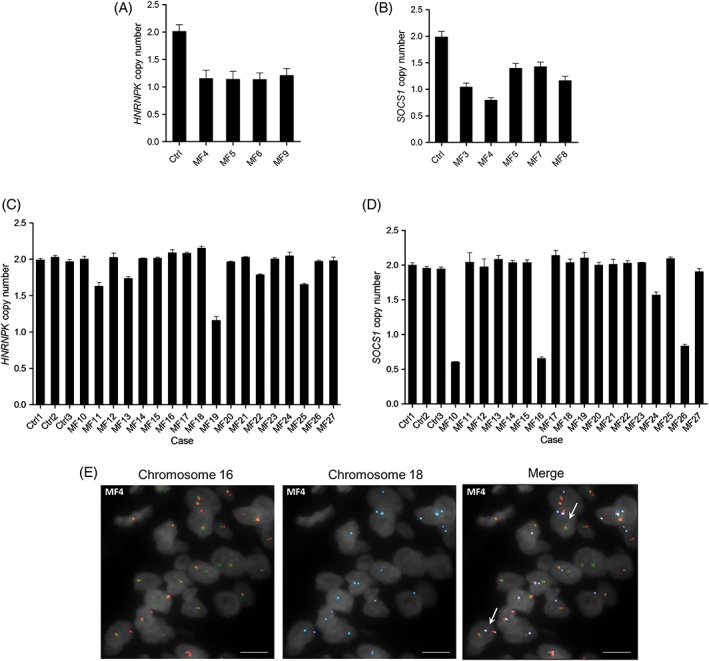
Mycosis fungoides (MF) is the most common cutaneous T-cell lymphoma (CTCL). Causative genetic alterations in MF are unknown. The low recurrence of pathogenic small-scale mutations (ie, nucleotide substitutions, indels) in the disease, calls for the study of additional aspects of MF genetics. Here, we investigated structural genomic alterations in tumor-stage MF by integrating whole-genome sequencing and RNA-sequencing. Multiple genes with roles in cell physiology (n = 113) and metabolism (n = 92) were found to be impacted by genomic rearrangements, including 47 genes currently implicated in cancer. Fusion transcripts involving genes of interest such as DOT1L, KDM6A, LIFR, TP53, and TP63 were also observed. Additionally, we identified recurrent deletions of genes involved in cell cycle control, chromatin regulation, the JAK-STAT pathway, and the PI-3-K pathway. Remarkably, many of these deletions result from genomic rearrangements. Deletion of tumor suppressors HNRNPK and SOCS1 were the most frequent genetic alterations in MF after deletion of CDKN2A. Notably, SOCS1 deletion could be detected in early-stage MF. In agreement with the observed genomic alterations, transcriptome analysis revealed up-regulation of the cell cycle, JAK-STAT, PI-3-K and developmental pathways. Our results position inactivation of HNRNPK and SOCS1 as potential driver events in MF development.

Keywords: JAK-STAT signaling; RNA sequencing; cutaneous T-cell lymphoma; genomic rearrangements; mycosis fungoides; whole-genome sequencing.


Figures

Figure 1
Figure 1
Landscape of genomic rearrangements in mycosis fungoides. Circos plot depicting 352 genomic rearrangements identified in nine MF genomes by WGS. The outer ring consists of chromosome ideograms arranged circularly end to end. The inner area in the plot shows arcs that represent interchromosomal (blue) and intrachromosomal (red) rearrangements. The ring between the chromosome ideograms and the arcs contains labels indicating rearranged genes implicated in cancer [Color figure can be viewed at http://wileyonlinelibrary.com]
Figure 2
Figure 2
Distribution and functional annotation of genomic rearrangements in mycosis fungoides. A, Number of genomic rearrangements per sample. B, Distribution of inter‐ and intrachromosomal rearrangements. C, Distribution of genomic rearrangements based on the type of DNA sequences involved in the event (genic or nongenic) and the expression of fusion sequences determined through integration of WGS and RNA‐seq data. D, Circos plot illustrating chromothripsis‐like events in chromosomes 1 and X of sample MF1. The plot shows that complex rearrangements are associated with deletion of genomic regions. E, Distribution of rearranged genes according to the biological process their protein products take part in. F, Distribution of rearranged genes according to the protein class they encode (143 of 270 rearranged genes were assigned to a protein class by Panther) [Color figure can be viewed at http://wileyonlinelibrary.com]
Figure 3
Figure 3
Overview of CNAs in mycosis fungoides. Human chromosome ideograms showing regions of gain and loss identified by WGS in nine MF genomes. Red bars to the left of each chromosome represent regions of gain while blue bars to the right of each chromosome represent regions of loss [Color figure can be viewed at http://wileyonlinelibrary.com]
Figure 4
Figure 4
Distribution of recurrent CNAs and pathogenic SNVs in mycosis fungoides. Upper panel, broad CNAs (>3 Mb); middle panel, focal MCRs (≤3 Mb) shared by CNAs. Bona fide cancer genes contained within each focal MCR are indicated; bottom panel, pathogenic SNVs. Only SNVs for which functional validation has been reported in literature are shown [Color figure can be viewed at http://wileyonlinelibrary.com]
Figure 5
Figure 5
RNA‐seq identifies differentially expressed cancer genes and deregulated signaling pathways in mycosis fungoides. A, Heat map of differentially expressed (DE) genes (FDR < 0.01) in MF when compared to CD4+ T cells. Of 733 DE genes, 450 were commonly up‐regulated and 283 were commonly down‐regulated. B, Oncogenes and tumor suppressors with roles in cell cycle control and development are among the group of DE genes. C and D, HNRNPK and MECOM, whose deregulation (down‐ and up‐, respectively) are reported to enhance the JAK‐STAT pathway, are differentially expressed in MF (HNRNPK: −2.5‐fold average, ***P < 1 × 10⁻⁴; MECOM: 31‐fold average, ***P < 1 × 10⁻⁴, Mann‐Whitney test). E, Gene set enrichment analysis. Select GSEA plots showing up‐regulation of STAT3 signaling (upper left), KRAS signaling (upper right), Hedgehog signaling (lower left) and Notch signaling (lower right) in MF compared to CD4+ T cells (see Supporting Information Table 15 for a complete list of GSEA signatures). NES, normalized enrichment score; FDR q‐value, false discovery rate q‐value. F and G, Pathway analysis by DAVID reveals up‐regulation of the PI‐3‐K/Akt pathway, the cell cycle and cancer signatures, and down‐regulation of ribosome, spliceosome and mRNA surveillance (see Supporting Information Table 16 for a complete list of enriched terms/processes) [Color figure can be viewed at http://wileyonlinelibrary.com]
Figure 6
Figure 6
Genomic rearrangements at 16q13.13 are associated with focal SOCS1 deletions in mycosis fungoides. (I) Circos plots displaying genomic rearrangements at 16q13.13. (II) Magnified views of deletions at 16q13.13 resulting from structural alterations. Genomic rearrangements at 16q13.13 validated by (III) Sanger sequencing and (IV) break apart FISH in (A) MF3, (B) MF4, and (C) MF5. Del, deletion. CTX, interchromosomal translocation. Scale bar, 10 μm [Color figure can be viewed at http://wileyonlinelibrary.com]
Figure 7
Figure 7
HNRNPK and SOCS1 are recurrently deleted in mycosis fungoides. Deletion of (A) HNRNPK and (B) SOCS1 in sequenced tumor samples was confirmed by ddPCR. Deletion of (C) HNRNPK and (D) SOCS1 was also identified in samples from the extension cohort by ddPCR. E, The translocation responsible for SOCS1 deletion in sample MF4 was found in (early‐stage) plaque tissue by FISH. Ctrl, CD4+ T cells. Scale bar, 10 μm [Color figure can be viewed at http://wileyonlinelibrary.com]

References

    1. Willemze R, Jaffe ES, Burg G, et al. WHO‐EORTC classification for cutaneous lymphomas. Blood. 2005;105:3768‐3785. - PubMed
    1. Nicolae‐Cristea AR, Benner MF, Zoutman WH, et al. Diagnostic and prognostic significance of CDKN2A/CDKN2B deletions in patients with transformed mycosis fungoides and primary cutaneous CD30‐positive lymphoproliferative disease. Br J Dermatol. 2015;172:784‐788. - PubMed
    1. Laharanne E, Chevret E, Idrissi Y, et al. CDKN2A‐CDKN2B deletion defines an aggressive subset of cutaneous T‐cell lymphoma. Mod Pathol. 2010;23:547‐558. - PubMed
    1. van Doorn R, Dijkman R, Vermeer MH, Starink TM, Willemze R, Tensen CP. A novel splice variant of the Fas gene in patients with cutaneous T‐cell lymphoma. Cancer Res. 2002;62:5389‐5392. - PubMed
    1. van Doorn R, van Kester MS, Dijkman R, et al. Oncogenomic analysis of mycosis fungoides reveals major differences with Sezary syndrome. Blood. 2009;113:127‐136. - PubMed

Publication types

MeSH terms

Substances