Task-evoked functional connectivity does not explain functional connectivity differences between rest and task conditions
- PMID: 30144210
- PMCID: PMC6397020
- DOI: 10.1002/hbm.24335
Task-evoked functional connectivity does not explain functional connectivity differences between rest and task conditions
Abstract
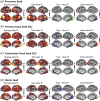
During complex tasks, patterns of functional connectivity differ from those in the resting state. However, what accounts for such differences remains unclear. Brain activity during a task reflects an unknown mixture of spontaneous and task-evoked activities. The difference in functional connectivity between a task state and the resting state may reflect not only task-evoked functional connectivity, but also changes in spontaneously emerging networks. Here, we characterized the differences in apparent functional connectivity between the resting state and when human subjects were watching a naturalistic movie. Such differences were marginally explained by the task-evoked functional connectivity involved in processing the movie content. Instead, they were mostly attributable to changes in spontaneous networks driven by ongoing activity during the task. The execution of the task reduced the correlations in ongoing activity among different cortical networks, especially between the visual and non-visual sensory or motor cortices. Our results suggest that task-evoked activity is not independent from spontaneous activity, and that engaging in a task may suppress spontaneous activity and its inter-regional correlation.
Keywords: natural vision; spontaneous activity; task evoked functional connectivity; task-rest interaction.
© 2018 Wiley Periodicals, Inc.
Figures


Similar articles
-
Intersubject consistent dynamic connectivity during natural vision revealed by functional MRI.Neuroimage. 2020 Aug 1;216:116698. doi: 10.1016/j.neuroimage.2020.116698. Epub 2020 Mar 1. Neuroimage. 2020. PMID: 32130972 Free PMC article.
-
Catecholaminergic Neuromodulation Shapes Intrinsic MRI Functional Connectivity in the Human Brain.J Neurosci. 2016 Jul 27;36(30):7865-76. doi: 10.1523/JNEUROSCI.0744-16.2016. J Neurosci. 2016. PMID: 27466332 Free PMC article.
-
Brain network profiling defines functionally specialized cortical networks.Hum Brain Mapp. 2018 Dec;39(12):4689-4706. doi: 10.1002/hbm.24315. Epub 2018 Aug 4. Hum Brain Mapp. 2018. PMID: 30076763 Free PMC article.
-
Can brain state be manipulated to emphasize individual differences in functional connectivity?Neuroimage. 2017 Oct 15;160:140-151. doi: 10.1016/j.neuroimage.2017.03.064. Epub 2017 Mar 31. Neuroimage. 2017. PMID: 28373122 Free PMC article. Review.
-
Task-based dynamic functional connectivity: Recent findings and open questions.Neuroimage. 2018 Oct 15;180(Pt B):526-533. doi: 10.1016/j.neuroimage.2017.08.006. Epub 2017 Aug 3. Neuroimage. 2018. PMID: 28780401 Free PMC article. Review.
Cited by
-
Stimulus type shapes the topology of cellular functional networks in mouse visual cortex.Nat Commun. 2024 Jul 9;15(1):5753. doi: 10.1038/s41467-024-49704-0. Nat Commun. 2024. PMID: 38982078 Free PMC article.
-
Functionally distinct language and Theory of Mind networks are synchronized at rest and during language comprehension.J Neurophysiol. 2019 Apr 1;121(4):1244-1265. doi: 10.1152/jn.00619.2018. Epub 2019 Jan 2. J Neurophysiol. 2019. PMID: 30601693 Free PMC article.
-
Anesthetic modulations dissociate neuroelectric characteristics between sensory-evoked and spontaneous activities across bilateral rat somatosensory cortical laminae.Sci Rep. 2022 Jul 8;12(1):11661. doi: 10.1038/s41598-022-13759-0. Sci Rep. 2022. PMID: 35804171 Free PMC article.
-
Population-level task-evoked functional connectivity via Fourier analysis.J R Stat Soc Ser C Appl Stat. 2024 Mar 14;73(4):857-879. doi: 10.1093/jrsssc/qlae015. eCollection 2024 Aug. J R Stat Soc Ser C Appl Stat. 2024. PMID: 39145309 Free PMC article.
-
The relationship between interhemispheric homotopic functional connectivity and left-right difference of intrahemispheric functional integration in the human brain.Imaging Neurosci (Camb). 2024 Jun 26;2:imag-2-00205. doi: 10.1162/imag_a_00205. eCollection 2024. Imaging Neurosci (Camb). 2024. PMID: 40800411 Free PMC article.
References
-
- Arfanakis, K. , Cordes, D. , Haughton, V. M. , Moritz, C. H. , Quigley, M. A. , & Meyerand, M. E. (2000). Combining independent component analysis and correlation analysis to probe interregional connectivity in fMRI task activation datasets. Magnetic Resonance Imaging, 18, 921–930. - PubMed
-
- Arieli, A. , Sterkin, A. , Grinvald, A. , & Aertsen, A. (1996). Dynamics of ongoing activity: Explanation of the large variability in evoked cortical responses. Science, 273, 1868–1871. - PubMed
Publication types
MeSH terms
Grants and funding
LinkOut - more resources
Full Text Sources
Other Literature Sources

