

Determinants of methicillin-resistant Staphylococcus aureus (MRSA) prevalence in the Asia-Pacific region: A systematic review and meta-analysis
- PMID: 30145271
- PMCID: PMC6658325
- DOI: 10.1016/j.jgar.2018.08.014
Determinants of methicillin-resistant Staphylococcus aureus (MRSA) prevalence in the Asia-Pacific region: A systematic review and meta-analysis
Abstract
Objectives: Published literature on methicillin-resistant Staphylococcus aureus (MRSA) in the Asia-Pacific region was reviewed to document the prevalence of MRSA in the region and to examine the impact of variability in study design on the reported MRSA prevalence data.
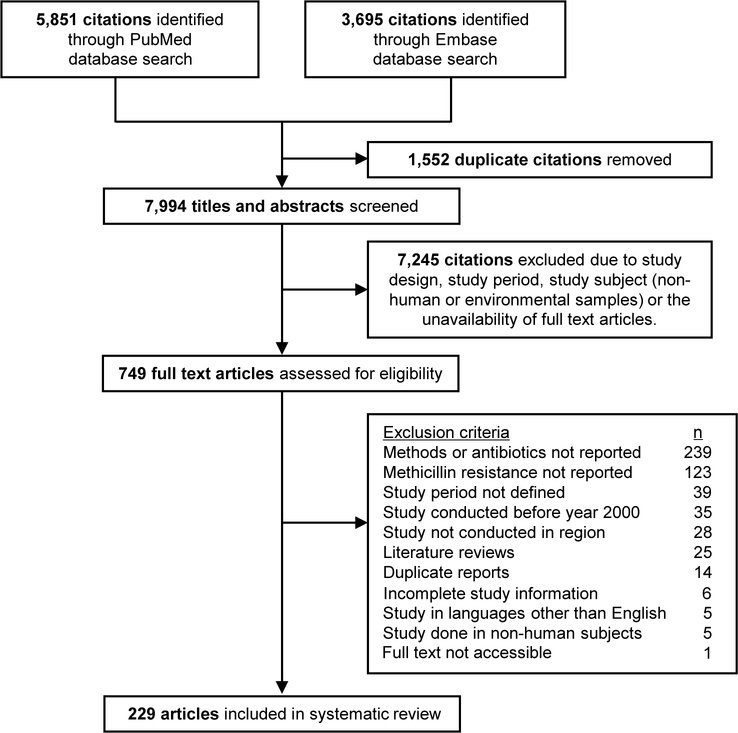
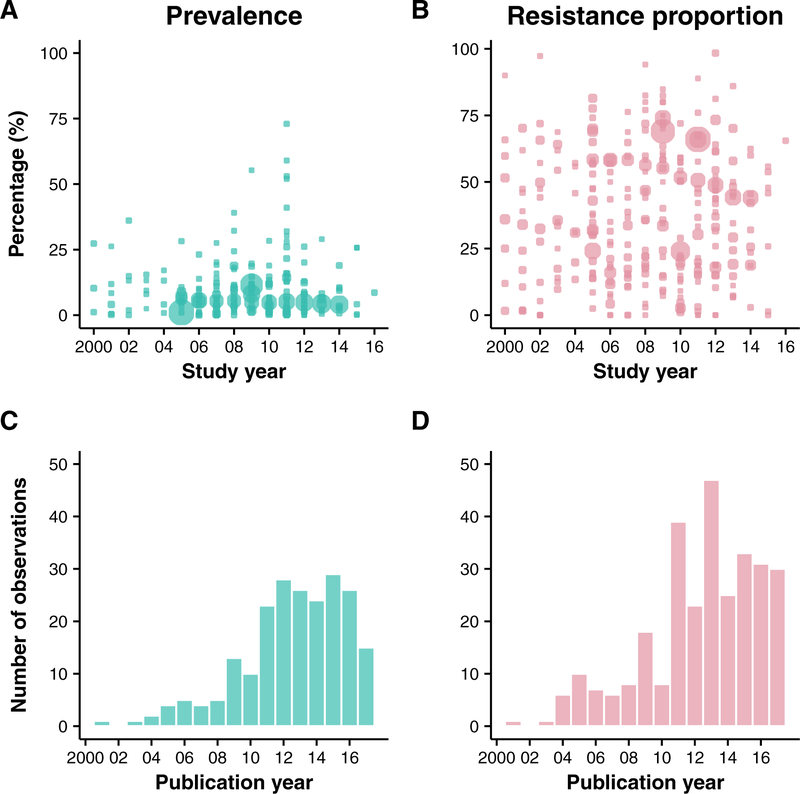
Methods: This review included studies reporting MRSA prevalence between 2000 and 2016. Studies were excluded if they did not contain complete information on antimicrobial susceptibility testing (AST) methods. Primary outcomes were the proportion of MRSA among S. aureus isolates (resistance proportion) or among individual samples (prevalence).
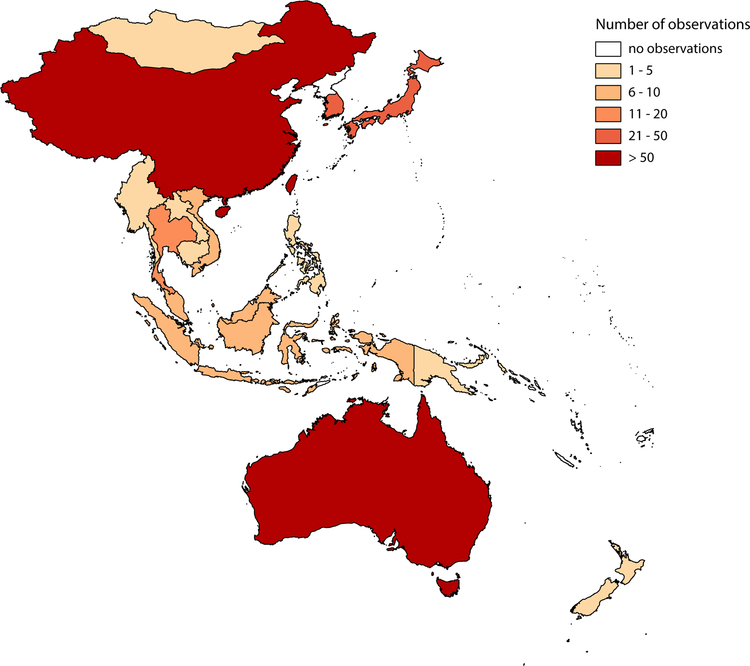
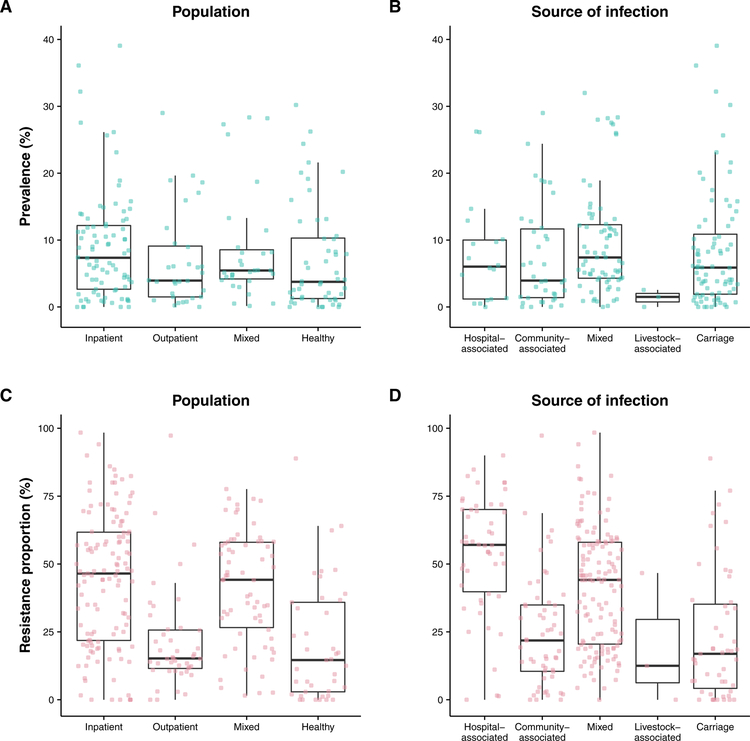
Results: A total of 229 studies in 19 countries/territories were included in the study. There was substantial heterogeneity in both outcomes (resistance proportion, I2=99.59%; prevalence, I2=99.83%), precluding pooled averages, and meta-regression analyses revealed that these variations were explained by country income status and participant characteristics but not by methodological differences in AST. Also, no significant secular changes in MRSA prevalence or resistance proportions in Asia-Pacific were found.
Conclusion: The resistance proportions and prevalence of MRSA infections in Asia-Pacific are comparable with those reported in other regions with no significant secular changes in the past decade. Country income status and characteristics of the sample population explained more variation in the reported resistance proportions and prevalence of MRSA than methodological differences in AST across locations in the region.
Keywords: Antimicrobial resistance; Asia-Pacific; MRSA; Methicillin resistance; Staphylococcus aureus.
Copyright © 2018 International Society for Chemotherapy of Infection and Cancer. Published by Elsevier Ltd. All rights reserved.
Conflict of interest statement
COMPETING INTERESTS
BJC has received research funding from Sanofi Pasteur for a study of influenza vaccine effectiveness. The authors declare no other potential competing interests.
Figures
References
-
- Centers for Disease Control and Prevention. Antibiotic resistance threats in the United States, 2013. [Internet]. 2013. [cited 2017 Nov 14]. Available from: https://www.cdc.gov/drugresistance/threat-report-2013/.
-
- Jean S-S, Hsueh P-R. High burden of antimicrobial resistance in Asia. Int J Antimicrob Agents. 2011;37(4):291–5. - PubMed
-
- World Health Organisation. Global report on surveillance. Geneva: World Health Organisation; 2014.
-
- European Centre for Disease Prevention and Control. Summary of the latest data on antibiotic resistance in the European Union: EARS-Net surveillance data. [Internet]. 2016. [cited 2017 Nov 15]. Available from: https://ecdc.europa.eu/sites/portal/files/documents/antibiotics-EARS-Net....
-
- Klein EY, Mojica N, Jiang W, Cosgrove SE, Septimus E, Morgan DJ, et al. Trends in methicillin-resistant Staphylococcus aureus hospitalizations in the United States, 2010–2014. Clin Infect Dis. 2017;65(11):1921–3. - PubMed
Publication types
MeSH terms
Substances
Grants and funding
LinkOut - more resources
Full Text Sources
Other Literature Sources
Medical
Miscellaneous
