

Evaluation of the Healthy Eating Index-2015
- PMID: 30146073
- PMCID: PMC6718954
- DOI: 10.1016/j.jand.2018.05.019
Evaluation of the Healthy Eating Index-2015
Erratum in
-
Erratum.J Acad Nutr Diet. 2019 Oct;119(10):1759. doi: 10.1016/j.jand.2019.07.026. Epub 2019 Aug 20. J Acad Nutr Diet. 2019. PMID: 31444137 No abstract available.
Abstract
Background: The Healthy Eating Index (HEI), a diet quality index that measures alignment with the Dietary Guidelines for Americans, was updated with the 2015-2020 Dietary Guidelines for Americans.
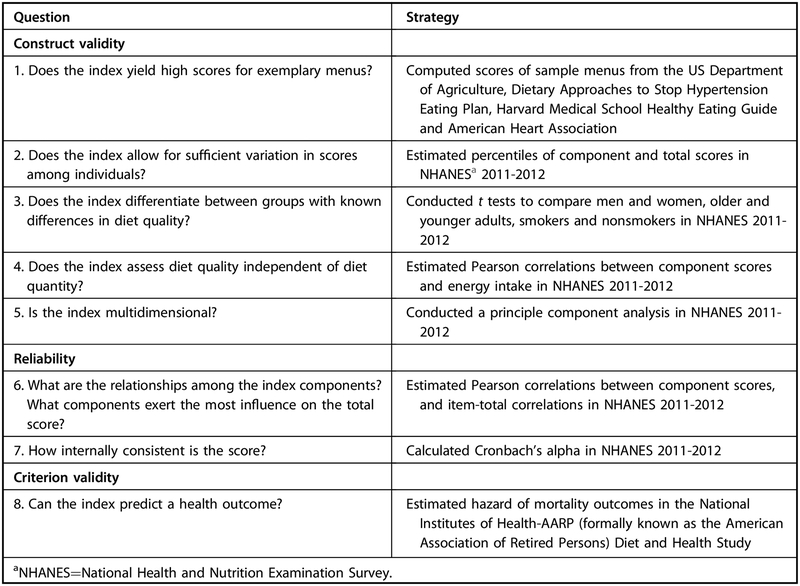
Objective and design: To evaluate the psychometric properties of the HEI-2015, eight questions were examined: five relevant to construct validity, two related to reliability, and one to assess criterion validity.
Data sources: Three data sources were used: exemplary menus (n=4), National Health and Nutrition Examination Survey 2011-2012 (N=7,935), and the National Institutes of Health-AARP (formally known as the American Association of Retired Persons) Diet and Health Study (N=422,928).
Statistical analyses: Exemplary menus: Scores were calculated using the population ratio method. National Health and Nutrition Examination Survey 2011-2012: Means and standard errors were estimated using the Markov Chain Monte Carlo approach. Analyses were stratified to compare groups (with t tests and analysis of variance). Principal components analysis examined the number of dimensions. Pearson correlations were estimated between components, energy, and Cronbach's coefficient alpha. National Institutes of Health-AARP Diet and Health Study: Adjusted Cox proportional hazards models were used to examine scores and mortality outcomes.
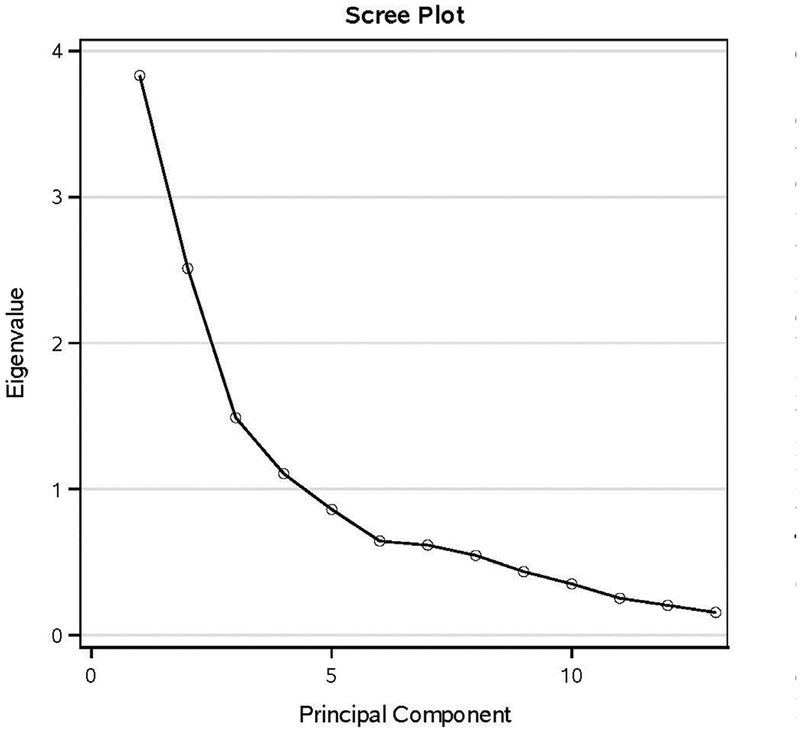
Results: For construct validity, the HEI-2015 yielded high scores for exemplary menus as four menus received high scores (87.8 to 100). The mean score for National Health and Nutrition Examination Survey was 56.6, and the first to 99th percentile were 32.6 to 81.2, respectively, supporting sufficient variation. Among smokers, the mean score was significantly lower than among nonsmokers (53.3 and 59.7, respectively) (P<0.01), demonstrating differentiation between groups. The correlation between diet quality and diet quantity was low (all <0.25) supporting these elements being independent. The components demonstrated multidimensionality when examined with a scree plot (at least four dimensions). For reliability, most of the intercorrelations among the components were low to moderate (0.01 to 0.49) with a few exceptions, and the standardized Cronbach's alpha was .67. For criterion validity, the highest vs the lowest quintile of HEI-2015 scores were associated with a 13% to 23% decreased risk of all-cause, cancer, and cardiovascular disease mortality.
Conclusions: The results demonstrated evidence supportive of construct validity, reliability, and criterion validity. The HEI-2015 can be used to examine diet quality relative to the 2015-2020 Dietary Guidelines for Americans.
Keywords: Diet indexes; Diet quality; Dietary patterns; Evaluation; Healthy Eating Index.
Copyright © 2018 Academy of Nutrition and Dietetics. Published by Elsevier Inc. All rights reserved.
Conflict of interest statement
STATEMENT OF POTENTIAL CONFLICT OF INTEREST
No potential conflict of interest was reported by the authors.
Figures
References
-
- Nutrition and Your Health: 2015–2020 Dietary Guidelines for Americans. 8th edition Washington, DC: US Government Printing Office; 2015. Home and Garden Bulletin No. 232.
-
- Jahns L, Scheett AJ, Johnson LK, et al. Diet quality of items advertised in supermarket sales circulars compared to diets of the US population, as Assessed by the Healthy Eating Index-2010. J Acad Nutr Diet. 2016;116(1):115–122. - PubMed
Publication types
MeSH terms
Grants and funding
LinkOut - more resources
Full Text Sources
Other Literature Sources
Medical
