. 2018 Sep 6;103(3):377-388.
doi: 10.1016/j.ajhg.2018.08.001. Epub 2018 Aug 23.

Genetic Regulatory Mechanisms of Smooth Muscle Cells Map to Coronary Artery Disease Risk Loci

Affiliations

Genetic Regulatory Mechanisms of Smooth Muscle Cells Map to Coronary Artery Disease Risk Loci

Boxiang Liu et al. Am J Hum Genet. .

Abstract

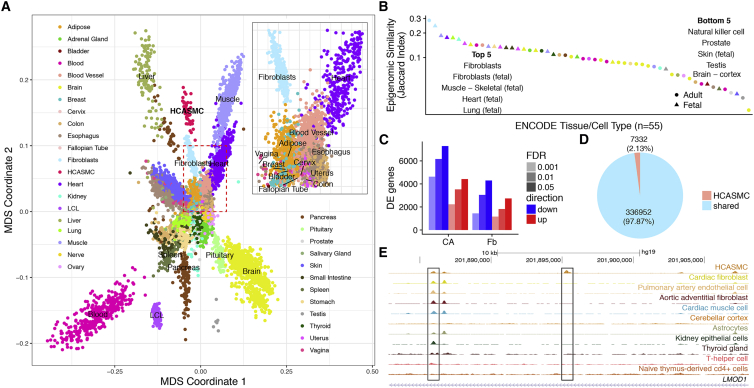
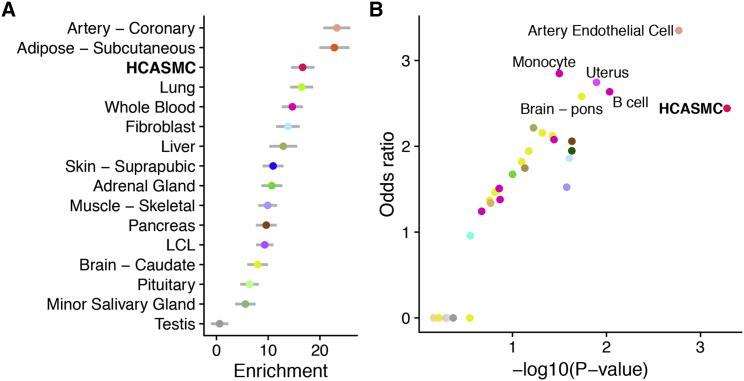
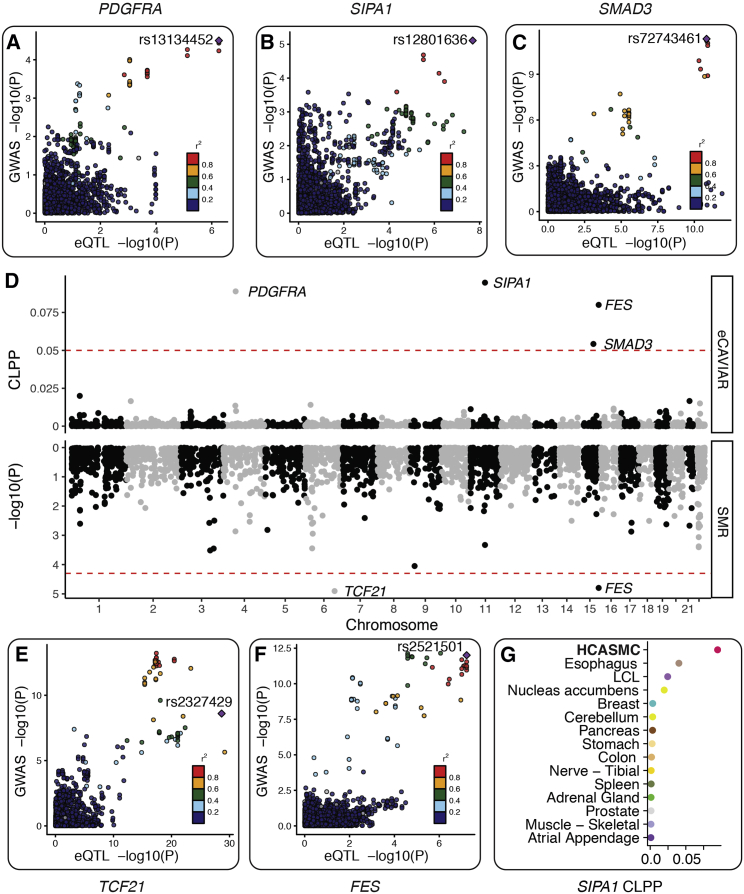
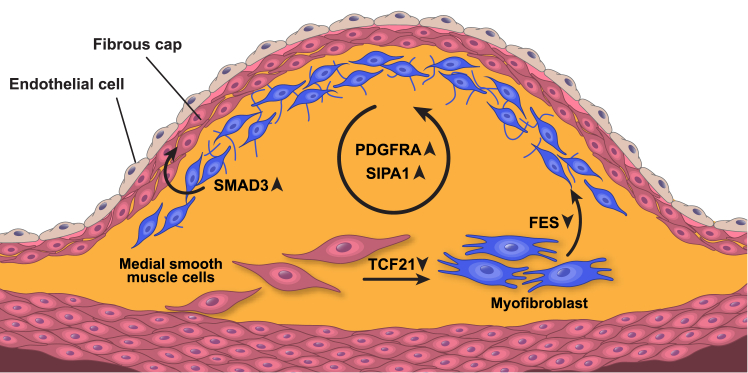
Coronary artery disease (CAD) is the leading cause of death globally. Genome-wide association studies (GWASs) have identified more than 95 independent loci that influence CAD risk, most of which reside in non-coding regions of the genome. To interpret these loci, we generated transcriptome and whole-genome datasets using human coronary artery smooth muscle cells (HCASMCs) from 52 unrelated donors, as well as epigenomic datasets using ATAC-seq on a subset of 8 donors. Through systematic comparison with publicly available datasets from GTEx and ENCODE projects, we identified transcriptomic, epigenetic, and genetic regulatory mechanisms specific to HCASMCs. We assessed the relevance of HCASMCs to CAD risk using transcriptomic and epigenomic level analyses. By jointly modeling eQTL and GWAS datasets, we identified five genes (SIPA1, TCF21, SMAD3, FES, and PDGFRA) that may modulate CAD risk through HCASMCs, all of which have relevant functional roles in vascular remodeling. Comparison with GTEx data suggests that SIPA1 and PDGFRA influence CAD risk predominantly through HCASMCs, while other annotated genes may have multiple cell and tissue targets. Together, these results provide tissue-specific and mechanistic insights into the regulation of a critical vascular cell type associated with CAD in human populations.

Keywords: coronary disease; expression quantitative traits; genetics; genome-wide association; genomics; smooth muscle cells.


Figures

Figure 1
Figure 1
The Relationship between HCASMCs and GTEx and ENCODE Cell and Tissue Types (A) The multidimensional scaling plot of gene expression shows that HCASMCs form a distinct cluster, which neighbors fibroblast, skeletal muscle, heart, blood vessel, and various types of smooth muscle tissues such as esophagus and vagina (inset). (B) Jaccard similarity index between HCASMCs and ENCODE cell and tissue types reveals that fibroblast, skeletal muscle, heart, and lung are most closely related to HCASMCs. (C) Thousands of genes are differentially expressed between HCASMCs and its close neighbors, fibroblast, as well as the tissue of origin, coronary artery. (D) A total of 344,284 open chromatin peaks are found in HCASMCs, of which 7,332 (2.1%) are HCASMC specific. (E) An example of a HCASMC-specific peak located within the intron of LMOD1, which is an HCASMC-specific gene.
Figure 2
Figure 2
Tissue- and Cell Type-Specific Contribution to CAD Risk (A) Tissue-specific enrichment of CAD heritability. We used stratified LD score regression to estimate the CAD risk explained by SNPs close to tissue-specific genes, defined as the 2,000 genes with highest expression z-scores (see Material and Methods). Genes whose expression is specific to coronary artery, adipose, and HCASMCs harbor SNPs with large effects on CAD. Error bars indicate standard error of the enrichments. (B) Overlap between CAD risk variants and tissue- and cell type-specific open chromatin regions. We used a modified version of GREGOR (see Material and Methods) to estimate the probability and odds ratio (compared with matched background SNPs) of overlap between CAD risk variants and open chromatin regions in HCASMCs and across ENCODE tissues. HCASMCs, arterial endothelial cells, monocytes, B cell, uterus (composed primarily of smooth muscle), and pons (possibly through regulation of blood pressure) showed the highest degrees of overlap.
Figure 3
Figure 3
Colocalization between HCASMC eQTL and Coronary Artery Disease GWASs (A–C) Three candidate genes identified by eCAVIAR. (A) Platelet-derived growth factor alpha (PDFGRA) eQTL signal colocalized with the KDR GWAS locus, which has p value < 3.16 × 10−5 (FDR < 0.05) in the latest CARDIoGRAMplusC4D and UK Biobank GWAS meta-analysis. (B) Signal-Induced Proliferation-Associated 1 (SIPA1) eQTL signal colocalized with the PCNX3 locus, which has p value < 7.75 × 10−6 in the UK Biobank meta-analysis, and reached genome-wide significance (p value < 9.71 × 10−9) in Howson et al. Note that the latter study has a larger sample size than the UK Biobank study. (C) SMAD3 eQTL signal colocalized with the SMAD3 locus, which was identified in the UK Biobank meta-analysis. (D) Transcriptome-wide colocalization signals between HCASMC eQTL and CAD GWAS. We used eCAVIAR (top) and SMR (bottom) to fine-map GWAS causal variants and to identify eQTL signals that can explain CAD risk variants (see Material and Methods). We found five genes whose eQTL signals show significant colocalization with CAD GWAS signal (SMR FDR < 0.05 or eCAVIAR colocalization posterior probability > 0.05). (E and F) Two candidate genes identified by SMR. (E) Transcription factor 21 (TCF21) eQTL signal colocalized with the TCF21 locus, which was identified by Schunkert et al. and replicated in the UK Biobank meta-analysis. (F) FES eQTL signal colocalized with the FURIN-FES locus, which was identified by Deloukas et al. and replicated in the UK Biobank meta-analysis. (G) SIPA1 colocalization is strongest in HCASMCs, suggesting that this gene may influence CAD risk through this specialized cell type.
Figure 4
Figure 4
Candidate Genes Are Involved in HCASMC-Related Vascular Remodeling Hypothetical functions of five candidate genes. Upregulation of TCF21 facilitates the transition of smooth muscle cells from a contractile to a synthetic state. Upon phenotypic transition, FES assists in smooth muscle cell migration to the neo-intima. Both SIPA1 and PDGFRA promote HCASMC proliferation., SMAD3 induces synthetic smooth muscle re-differentiation into the synthetic phenotype for vessel wall repair. Upward arrows indicate genetic upregulation increases CAD risk, and downward arrows indicate genetic upregulation is protective against CAD risk.

References

    1. Benjamin E.J., Blaha M.J., Chiuve S.E., Cushman M., Das S.R., Deo R., de Ferranti S.D., Floyd J., Fornage M., Gillespie C., American Heart Association Statistics Committee and Stroke Statistics Subcommittee Heart disease and stroke statistics-2017 update: a report from the American Heart Association. Circulation. 2017;135:e146–e603. - PMC - PubMed
    1. Khera A.V., Emdin C.A., Drake I., Natarajan P., Bick A.G., Cook N.R., Chasman D.I., Baber U., Mehran R., Rader D.J. Genetic risk, adherence to a healthy lifestyle, and coronary disease. N. Engl. J. Med. 2016;375:2349–2358. - PMC - PubMed
    1. Won H.-H., Natarajan P., Dobbyn A., Jordan D.M., Roussos P., Lage K., Raychaudhuri S., Stahl E., Do R. Disproportionate contributions of select genomic compartments and cell types to genetic risk for coronary artery disease. PLoS Genet. 2015;11:e1005622. - PMC - PubMed
    1. Zdravkovic S., Wienke A., Pedersen N.L., Marenberg M.E., Yashin A.I., De Faire U. Heritability of death from coronary heart disease: a 36-year follow-up of 20 966 Swedish twins. J. Intern. Med. 2002;252:247–254. - PubMed
    1. Howson J.M.M., Zhao W., Barnes D.R., Ho W.-K., Young R., Paul D.S., Waite L.L., Freitag D.F., Fauman E.B., Salfati E.L., CARDIoGRAMplusC4D. EPIC-CVD Fifteen new risk loci for coronary artery disease highlight arterial-wall-specific mechanisms. Nat. Genet. 2017;49:1113–1119. - PMC - PubMed

Publication types

MeSH terms