. 2018 Sep 20;175(1):200-211.e13.
doi: 10.1016/j.cell.2018.07.042. Epub 2018 Aug 23.

Chromosome Segregation Fidelity in Epithelia Requires Tissue Architecture

Affiliations

Chromosome Segregation Fidelity in Epithelia Requires Tissue Architecture

Kristin A Knouse et al. Cell. .

Abstract

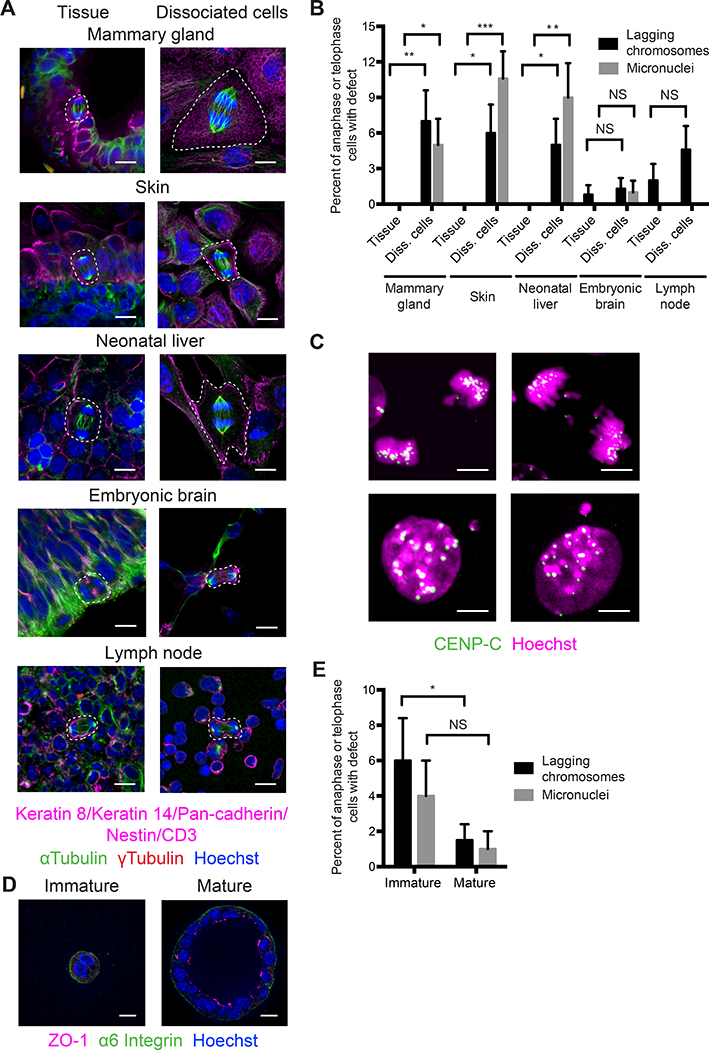
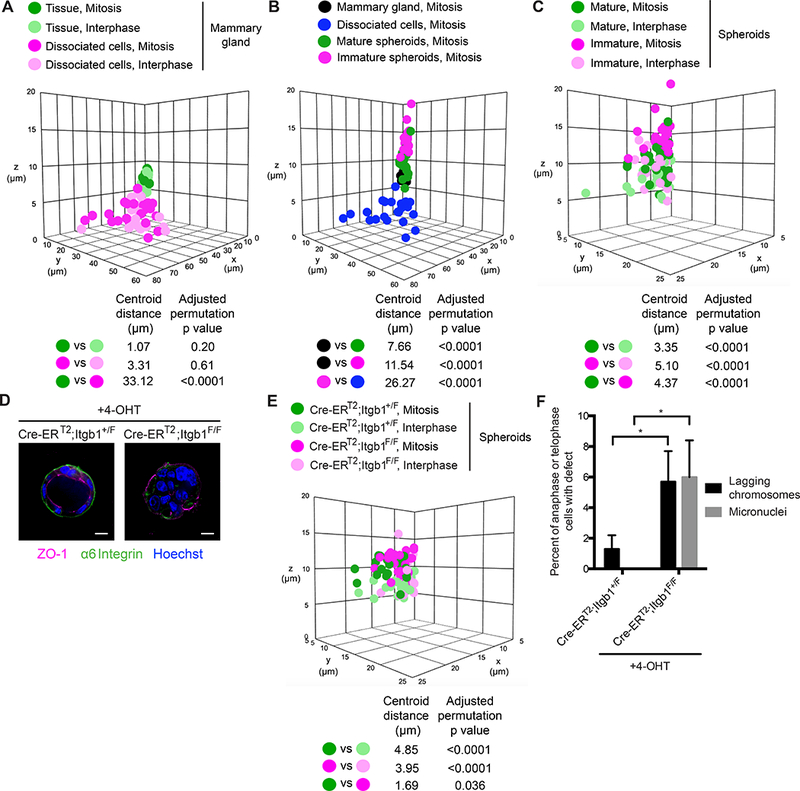
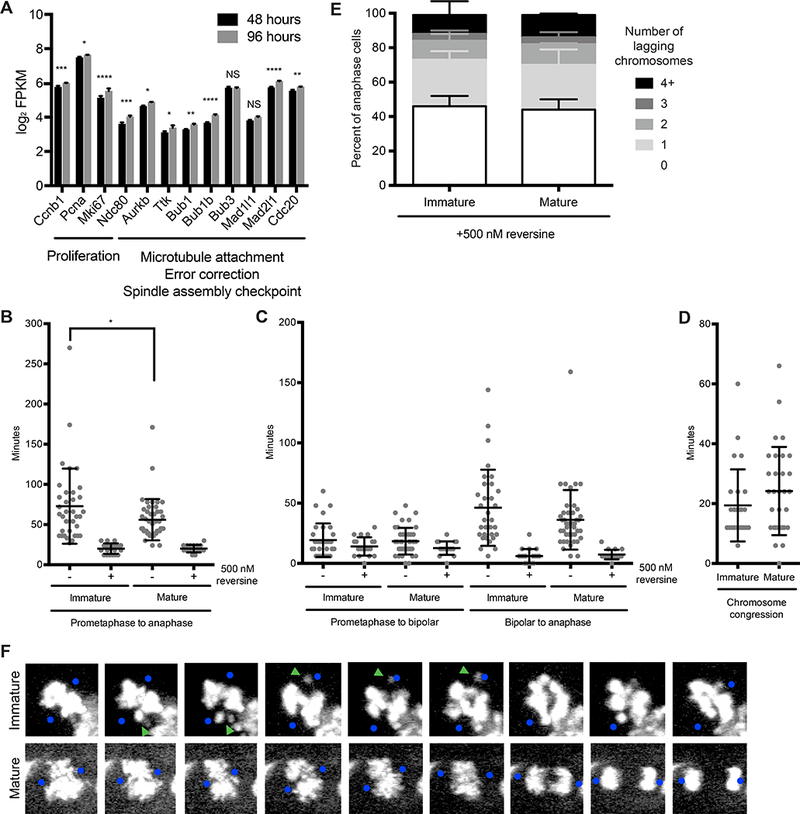
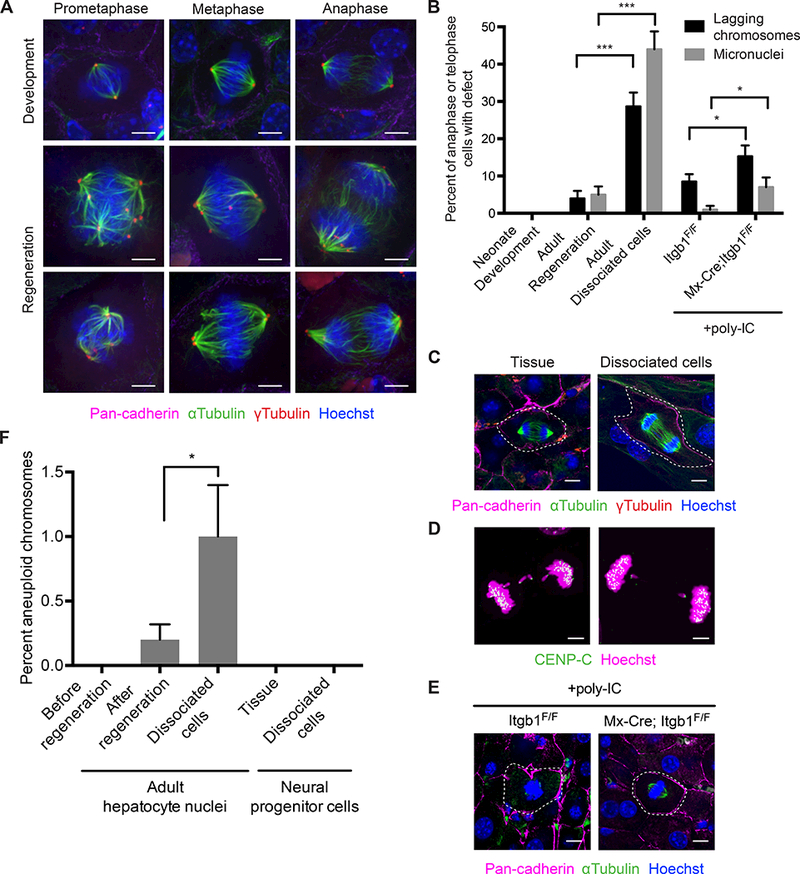
Much of our understanding of chromosome segregation is based on cell culture systems. Here, we examine the importance of the tissue environment for chromosome segregation by comparing chromosome segregation fidelity across several primary cell types in native and nonnative contexts. We discover that epithelial cells have increased chromosome missegregation outside of their native tissues. Using organoid culture systems, we show that tissue architecture, specifically integrin function, is required for accurate chromosome segregation. We find that tissue architecture enhances the correction of merotelic microtubule-kinetochore attachments, and this is especially important for maintaining chromosome stability in the polyploid liver. We propose that disruption of tissue architecture could underlie the widespread chromosome instability across epithelial cancers. Moreover, our findings highlight the extent to which extracellular context can influence intrinsic cellular processes and the limitations of cell culture systems for studying cells that naturally function within a tissue.

Keywords: aneuploidy; chromosome segregation; integrin; tissue architecture.


Conflict of interest statement

DECLARATION OF INTERESTS

The authors declare no competing interests.

Figures

Figure 1.
Figure 1.. Tissue architecture is required for chromosome segregation fidelity in epithelia.
(A) Images of mitotic cells (dashed white outline) in tissue and dissociated cells from mammary gland, skin, neonatal liver, embryonic brain, and lymph node immunostained for epithelial or cell type-specific markers (magenta), αtubulin (green), and ϒtubulin (red). DNA is stained with Hoechst (blue). Scale bars, 10 μm. (B) Prevalence of lagging chromosomes (black bars) and micronuclei (grey bars) in tissues and dissociated cells. Error bars represent standard deviation. P values are: p = 0.007 for lagging chromosomes in mammary gland tissue versus dissociated cells, p = 0.03 for micronuclei in mammary gland tissue versus dissociated cells, p = 0.01 for lagging chromosomes in skin tissue versus dissociated cells, p = 0.0004 for micronuclei in skin tissue versus dissociated cells, p = 0.03 for lagging chromosomes in neonatal liver tissue versus dissociated cells, and p = 0.002 for micronuclei in neonatal liver tissue versus dissociated cells by one-tailed Fisher’s exact test. NS, not significant. n ≥ 2 biological replicates totaling ≥ 100 anaphase cells and ≥ 100 telophase cells per condition. (C) Images of lagging chromosomes (arrowheads) in a dissociated keratinocyte (top panel, left) and a neonatal hepatocyte (top panel, right) and micronuclei (arrowheads) in dissociated mammary epithelial cells (bottom panel) immunostained for the centromere (CENP-C, green). DNA is stained with Hoechst (magenta). Scale bars, 5 μm. (D) Images of immature and mature spheroids after 48 and 96 hours of culture in Matrigel, respectively, immunostained for ZO-1 (magenta) and α6 integrin (green). DNA is stained with Hoechst (blue). Scale bars, 10 μm. (E) Prevalence of lagging chromosomes (black bars) and micronuclei (grey bars) in immature and mature spheroids. Error bars represent standard deviation. p = 0.04 for lagging chromosomes in immature versus mature spheroids by one-tailed Fisher’s exact test. NS, not significant. n ≥ 2 biological replicates totaling ≥ 100 anaphase cells and ≥ 100 telophase cells per condition. See also Figure S1.
Figure 2.
Figure 2.. Integrin function is required for chromosome segregation fidelity.
(A) Dimensions of mitotic (dark circles) and interphase (light circles) mammary epithelial cells in mammary gland (green circles) and as dissociated cells (pink circles). For dissociated cells, the z dimension always corresponds to the height of the cell relative to the coverslip. The distance between the centroids (in μm) of select pairs of conditions and the adjusted permutation p value using the Benjamini and Hochberg method for multiple comparisons are indicated below the graph. n = 2 biological replicates with ≥ 10 cells per replicate per condition. (B) Dimensions of mitotic mammary epithelial cells in mammary gland (black circles), as dissociated cells (blue circles), in mature spheroids (green circles), and in immature spheroids (pink circles). n = 2 biological replicates with ≥ 10 cells per replicate per condition. The mitotic cells from mammary gland and dissociated cells are replotted from Figure 2A. (C) Dimensions of mitotic (dark circles) and interphase (light circles) cells in mature (green circles) and immature (pink circles) spheroids. n = 2 biological replicates with ≥ 10 cells per replicate per condition. The mitotic cells from immature and mature spheroids are replotted from Figure 2B. (D) Images of control (Cre-ERT2; Itgb1+/F) and β1 integrin knockout (Cre-ERT2; Itgb1F/F) spheroids treated with 4-hydroxytamoxifen (4-OHT) immunostained for ZO-1 (magenta) and α6 integrin (green). DNA is stained with Hoechst (blue). Scale bars, 10 μm. (E) Dimensions of mitotic (dark circles) and interphase (light circles) cells in control and β1 integrin knockout spheroids treated with 4-hydroxytamoxifen (4-OHT). n = 2 biological replicates with ≥ 10 cells per replicate per condition. (F) Prevalence of lagging chromosomes (black bars) and micronuclei (grey bars) in control and β1 integrin knockout spheroids treated with 4-hydroxytamoxifen (4-OHT). Error bars represent standard deviation. P values are: p = 0.047 for lagging chromosomes in control versus β1 integrin knockout spheroids and p = 0.01 for micronuclei in control versus β1 integrin knockout spheroids by one-tailed Fisher’s exact test. n = 2 biological replicates totaling ≥ 100 anaphase cells and ≥ 100 telophase cells per condition. See also Figure S2.
Figure 3.
Figure 3.. Tissue architecture enhances the correction of merotelic microtubule-kinetochore attachments.
(A) Average expression (log2 FPKM) of genes involved in proliferation and chromosome segregation in spheroids cultured for 48 or 96 hours in Matrigel. Error bars represent standard deviation. P values are: p = 0.00046 (Ccnb1), 0.01 (Pcna), 2.1 × 10⁻⁸ (Mki67), 0.00044 (Ndc80), 0.01 (Aurkb), 0.039 (Ttk), 0.0047 (Bub1), 2.2 × 10⁻⁷ (Bub1b), 3.2 × 10⁻⁶ (Mad2l1), 0.0035 (Cdc20) by Wald test adjusted for multiple testing by the Benjamini and Hochberg method. NS, not significant. n = 3 biological replicates per condition. (B) Time elapsed from prometaphase to anaphase in mitotic mammary epithelial cells in Centrin 2-GFP;H2B-mCherry immature and mature spheroids in the absence (−) and presence (+) of 500 nM reversine. Horizontal lines represent mean and standard deviation. p = 0.04 for immature and mature spheroids in the absence of reversine by two-tailed unpaired t-test. n ≥ 2 biological replicates totaling ≥ 16 mitoses per condition. (C) Time elapsed from prometaphase to the establishment of a bipolar spindle and the establishment of a bipolar spindle to anaphase in mitotic mammary epithelial cells in Centrin 2-GFP;H2B-mCherry immature and mature spheroids in the absence (−) and presence (+) of 500 nM reversine. Horizontal lines represent mean and standard deviation. n ≥ 2 biological replicates totaling ≥ 16 mitoses per condition. (D) Duration of chromosome congression in mitotic mammary epithelial cells in Centrin 2-GFP;H2B-mCherry immature and mature spheroids. Horizontal lines represent mean and standard deviation. n ≥ 2 biological replicates totaling > 25 mitoses per condition. (E) Quantification of lagging chromosomes in anaphase of mammary epithelial cells in immature and mature spheroids in the presence of 500 nM reversine. Error bars represent standard deviation. n = 2 biological replicates with > 35 anaphase cells per replicate per condition. (F) Time lapse images of mitotic mammary epithelial cells in Centrin 2-GFP;H2B-mCherry immature (top panel) and mature (bottom panel) spheroids. Blue dots represent the position of Centrin 2-GFP foci when they could be visualized. Green arrowheads mark chromosomes expelled from the metaphase plate in immature spheroids. Number indicates minutes since prometaphase onset. Only the H2B-mCherry signal (white) is shown. See also Figure S3.
Figure 4.
Figure 4.. Tissue architecture is especially important for chromosome segregation fidelity in the polyploid liver.
(A) Images of mitotic hepatocytes in prometaphase, metaphase, and anaphase in liver during neonatal development and adult regeneration immunostained for pan-cadherin (magenta), αtubulin (green), and ϒtubulin (red). DNA is stained with Hoechst (blue). Scale bars, 5 μm. (B) Prevalence of lagging chromosomes (black bars) and micronuclei (grey bars) of hepatocytes in liver during neonatal development and adult regeneration, in dissociated cells from adult liver, and in control (Itgb1F/F) and β1 integrin knockout (Mx-Cre; Itgb1F/F) liver during adult regeneration after treatment with poly-IC. Error bars represent standard deviation. P values are: p = 0.0001 for lagging chromosomes in adult regeneration versus dissociated cells, p = 0.0001 for micronuclei in adult regeneration versus dissociated cells, p = 0.035 for lagging chromosomes in control versus β1 integrin knockout liver, and p = 0.03 for micronuclei in control versus β1 integrin knockout liver by one-tailed Fisher’s exact test. n ≥ 2 biological replicates totaling ≥ 100 anaphase cells and ≥ 100 telophase cells per condition. (C) Images of mitotic hepatocytes (dashed white outline) from adult liver during regeneration and dissociated cells from adult liver immunostained for pan-cadherin (magenta), αtubulin (green), and ϒtubulin (red). DNA is stained with Hoechst (blue). Scale bars, 10 μm. (D) Images of lagging chromosomes (arrowheads) in dissociated adult hepatocytes immunostained for the centromere (CENP-C, green). DNA is stained with Hoechst (magenta). Scale bars, 5 μm. (E) Images of mitotic hepatocytes (dashed white outline) from control and β1 integrin knockout liver during adult regeneration immunostained for pan-cadherin (magenta), and αtubulin (green). DNA is stained with Hoechst (blue). Scale bars, 10 μm. (F) Percent of aneuploid chromosomes in adult hepatocyte nuclei from liver before regeneration, after regeneration, and after expansion as dissociated cells, and neural progenitor cells from embryonic brain and after expansion as dissociated cells as determined by single nucleus or cell sequencing. Data for liver before regeneration and embryonic brain are from Knouse et al. 2014. p = 0.025 for adult hepatocyte nuclei after regeneration versus after expansion as dissociated cells by one-tailed Fisher’s exact test. n ≥ 1 biological replicate totaling > 25 nuclei or cells per condition. See also Figure S4.

Comment in

References

    1. Akhtar N, and Streuli CH (2012). An integrin--ILK--microtubule network orients cell polarity and lumen formation in glandular epithelium. Nature Publishing Group 15, 17–27. - PMC - PubMed
    1. Bergstralh DT, Haack T, and St Johnston D (2013). Epithelial polarity and spindle orientation: intersecting pathways. Philos. Trans. R. Soc. Lond., B, Biol. Sci 368, 20130291. - PMC - PubMed
    1. Cheeseman IM, Anderson S, Jwa M, Green EM, Kang J-S, Yates JR III, Chan CSM, Drubin DG, and Barnes G (2002). Phospho-Regulation of Kinetochore-Microtubule Attachments by the Aurora Kinase Ipl1p. Cell 111, 163–172. - PubMed
    1. Cimini D, Howell B, Maddox P, Khodjakov A, Degrassi F, and Salmon ED (2001). Merotelic kinetochore orientation is a major mechanism of aneuploidy in mitotic mammalian tissue cells. Journal of Cell Biology 153, 517–527. - PMC - PubMed
    1. Cimini D, Cameron LA, and Salmon ED (2004). Anaphase spindle mechanics prevent mis-segregation of merotelically oriented chromosomes. Current Biology 14, 2149–2155. - PubMed

Publication types