. 2018 Sep 19;99(6):1315-1328.e5.
doi: 10.1016/j.neuron.2018.07.036. Epub 2018 Aug 23.

Multi-dimensional Coding by Basolateral Amygdala Neurons

Affiliations

Multi-dimensional Coding by Basolateral Amygdala Neurons

Pinelopi Kyriazi et al. Neuron. .

Abstract

Conditioned appetitive and aversive responses (CRs) are thought to result from the activation of specific subsets of valence-coding basolateral amygdala (BLA) neurons. Under this model, the responses of BLA cells to conditioned stimuli (CSs) and the activity that drives CRs are closely related. We tested the strength of this correlation using a task where rats could emit different CRs in response to the same CSs. At odds with this model, the CS responses and CR-related activity of individual BLA cells were separable. Moreover, while the incidence of valence-coding cells did not exceed chance, at the population level there was similarity between valence coding for CSs and CRs. In fact, both lateral and basolateral neurons concurrently encoded multiple task features and behaviors. Thus, conditioned emotional behaviors may not depend on the recruitment of single cells that explicitly encode individual task variables but from multiplexed representations distributed across the BLA.

Keywords: amygdala; conditioning; population coding; punishment; reward; valence.


Conflict of interest statement

Competing financial interests statement

The authors declare that they have no competing financial interests.

Figures

Figure 1.
Figure 1.
Risk-reward interaction task. (A) Apparatus. LEDs at different locations signal reward availability (blue; behind left wall, CS-R1; behind right wall, CS-R2) or an impending shock (red; under one of three different floor sectors, CS-S1–3). (B) Acquisition of aversive (red) and appetitive (blue) CRs. Percent correct trials ± SEM (y-axis) as a function of training day (x-axis). (C) Examples of CRs. C1, active avoidance. C2, passive avoidance. C3, reward approach. Superimposed trajectory (start, red; end, yellow) of a rat on multiple types of trials where the rat’s starting position was in sector 1, on the left. Related to figure S1.
Figure 2.
Figure 2.
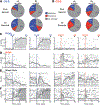
Activity of BLA neurons during the CS-Rs and CS-Ss. A, CS-R. B, CS-S. Proportion of LA or BL cells with significantly altered firing rates (rank-sum test, p<0.005) during the first second of the CSs (top) or their entire duration (bottom). C-F, Representative examples of cells that showed significant changes in firing rates during one or more of the CSs. S-Cells (C) and R-Cells (D) are neurons whose firing rates increased selectively during the CS-Rs or CS-Ss, respectively. Mixed cells (E,F) are neurons that displayed marked trial-to-trial variations in the late part of their CS-related activity. Ticks, individual spike times. Thick lines, z-scored averages of firing rates. Vertical dashed lines, onset of CS-Rs (blue) or CS-Ss (red). Abbreviations: CS-R, reward-predicting conditioned stimulus; CS-S, shock-predicting conditioned stimulus; US, unconditioned stimulus. Related to figures S2 and S3.
Figure 3.
Figure 3.
Behavioral correlates of unit activity. Arrows and arrowheads mark the onset of behaviors and CSs, respectively. (A,B) Individual examples of principal neurons that strongly increase their firing rates in relation to (A1) active avoidance (AA) but not passive avoidance (PA; A2) or (B2) reward anticipation (RAnt) but not reward approach (RA, B1). Vertical dashed lines, onset of reference behavior. Ticks, individual spike times (as many trials as rows of ticks are shown). Thick lines, z-scored averages of firing rates. Yellow ticks, onset of CS. Cyan ticks, end of reference behavior. (C) Comparison between z-scored averaged firing rate ± SEM of principal cells (n=81) during AA (red) vs. PA (blue), referenced to behavior onset (C1) or CS onset (C2). (D) Comparison between z-scored averaged firing rate ± SEM of principal cells during correct (black) and error (red) CS-S (D1; n=68) or CS-R (D2; n=53) trials. (E,F) Relation between behavior onset (arrows) and unit activity for CS-S (E) and CS-R trials (F). Individual principal cells are shown in E1 and F1 (z-scored average ± SEM of multiple trials). Z-scored average ± SEM of all available principal cells are shown in E2 and F2. Abbreviations: CS-R, reward-predicting conditioned stimulus; CS-S, shock-predicting conditioned stimulus.
Figure 4.
Figure 4.
Coding of task variables by example BLA cells, as estimated by the GLM. A and B, two different principal BLA cells. In both cases, the five top rows show GLM-estimated spiking (blue lines and left y-axis) for different task variables (gray lines and right y-axis) as a function of time (x-axis) whereas the bottom row superimposes the observed spiking of the cell (red lines) and estimated spiking (full model, blue lines) for each CS. CS-Ss and associated behaviors (red letters) are shown on the left whereas CS-Rs and associated behaviors (blue letters) are shown on the right of each panel. The same time (x) axis applies to all plots but the labels are only indicated in the bottom row. Related to figures S5-S7. Abbreviations: AA, active avoidance; CS-R, reward-predicting conditioned stimulus; CS-S, shock-predicting conditioned stimulus; Frz, freezing; PA, passive avoidance; RA, reward approach; RAnt, reward anticipation
Figure 5.
Figure 5.
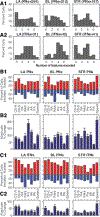
Multi-dimensional coding by BLA neurons, as determined by the GLM. In A-C, the left, middle, and right columns show data obtained in LA, BL, and striatum, respectively. (A) Frequency distributions of the number of task variables encoded by presumed principal cells (A1) and interneurons (A2). (B1) Proportion of presumed principal cells (y-axis) that exhibited excitatory (red) or inhibitory (blue) coding of different task variables (x-axis). (B2) Absolute average ± SEM modulation of firing rates in relation to each variable. (C1) Proportion of presumed interneurons (y-axis) that exhibited excitatory (red) or inhibitory (blue) coding of different task variables (x-axis). (C2) Absolute average ± SEM modulation of firing rates in relation to each variable. Abbreviations: AA, active avoidance; CS-R, reward-predicting conditioned stimulus; CS-S, shock-predicting conditioned stimulus; Frz, freezing; ITNs, interneurons; PA, passive avoidance; PNs, principal neurons; RA, reward approach; RAnt, reward anticipation. Related to figures S5-S7.
Figure 6.
Figure 6.
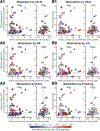
Relation between GLM-estimated coding of task variables and firing rate change observed during active conditioned behaviors. For all available principal cells (left) or interneurons (right), all panels plot the peak firing rate change observed during reward approach (y-axis) as a function of that seen during active avoidance (x-axis). Although the position of the circles representing each cell does not vary between plots, their color changes, reflecting the degree to which they were, according to the GLM, excited (red) or inhibited (blue) in relation to the following variables: (A1) CS-R; (A2) reward approach - RA; (A3) reward anticipation -RAnt; (B1) CS-S; (B2) active avoidance - AA; (B3) freezing - Frz. See color scale at bottom of figure. Abbreviations: CS-R, reward-predicting conditioned stimulus; CS-S, shock-predicting conditioned stimulus. Related to figures S6-S7.
Figure 7.
Figure 7.
Correlation between firing rate modulations associated with different behaviors and CSs. Spearman correlation matrices for LA (left), BL (middle) and striatal (right) principal cells (top) or interneurons (bottom). Warmer and cooler colors indicate positive and negative correlations, respectively, as indicated by the color scale on the left. Dots indicate significant correlations (p<0.001). Abbreviations: AA, active avoidance; CS-R, reward-predicting conditioned stimulus; CS-S, shock-predicting conditioned stimulus; Frz, freezing; PA, passive avoidance; RA, reward approach; RAnt, reward anticipation.
Figure 8.
Figure 8.
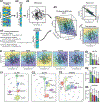
Coding for different task dimensions at the population level. (A1) Each neuron was described by a vector composed of their responses to CSs and behaviors. (A2,3) These were mapped to a two dimensional space using MDS. (A4) For each neuron we also computed a code value that was derived by contrasting responses to different stimuli and behaviors. Specifically, we ranked each dimension relative to the other units in the data set. Then, for each unit we constructed a feature vector (based on ranks) by taking the GLM-estimated peak modulations by the five stimuli (CS-R1, CS-R2, CS-S1, CS-S2, CS-S3) and five behaviors (RA, Rant, AA, Frz, speed). The coding dimensions were then calculated as specified in A4. (A5) PNs from each region were placed in a space where the first two dimensions were their MDS values, and the third was the value for one of their codes. A three dimensional plane was fit in this space that could capture a systematic mapping of the code under consideration in the low dimensional space. (B) Low dimensional maps of coding for LA PNs. Each PN (filled circle) was placed into a two dimensional space such that nearby PNs had similar response vectors. The code value for each neuron was then added (color of the filled circle). A code that is systematically represented in the low dimensional response space produces a strong gradient (e.g. ValBeh), and one that is not produces a weak gradient (e.g. BehCS). (C) Length and direction of plane gradients from the PNs recorded in each region. The gradient for each plane plotted on a polar plot as colored arrows. The plot was rotated so that the gradient with the longest length pointed up at 90 degrees. Contour plots with fading colors are the bootstrap probability distributions for the gradients. (D) Ordering of the coding gradients by length. Error bars denote the 95% bootstrap confidence intervals for the gradient length. Dashed lines are 95% confidence intervals returned by computing null gradients where code value was randomly permuted across the population. Related to figure S8.

References

    1. Ambroggi F, Ishikawa A, Fields HL, and Nicola SM (2008). Basolateral amygdala neurons facilitate reward-seeking behavior by exciting nucleus accumbens neurons. Neuron 59, 648–61. - PMC - PubMed
    1. Amir A, Lee SC, Headley DB, Herzallah MM, and Paré D (2015). Amygdala signaling during foraging in a hazardous environment. J. Neurosci 35, 12994–3005. - PMC - PubMed
    1. Amir A, Headley DB, Lee SC, Haufler D, and Paré D (2018). Vigilance-associated gamma oscillations coordinate the ensemble activity of basolateral amygdala neurons. Neuron 97, 656–69. - PMC - PubMed
    1. Barthó P, Hirase H, Monconduit L, Zugaro M, Harris KD, and Buzsáki G (2004). Characterization of neocortical principal cells and interneurons by network interactions and extracellular features. J. Neurophysiol 92, 600–8. - PubMed
    1. Belova MA, Paton JJ, and Salzman CD (2008). Moment-to-moment tracking of state value in the amygdala. J. Neurosci 28, 10023–30. - PMC - PubMed

Publication types