. 2018 Oct 18;72(2):239-249.e5.
doi: 10.1016/j.molcel.2018.08.010. Epub 2018 Aug 23.

Accurate Recycling of Parental Histones Reproduces the Histone Modification Landscape during DNA Replication

Affiliations

Accurate Recycling of Parental Histones Reproduces the Histone Modification Landscape during DNA Replication

Nazaret Reverón-Gómez et al. Mol Cell. .

Abstract

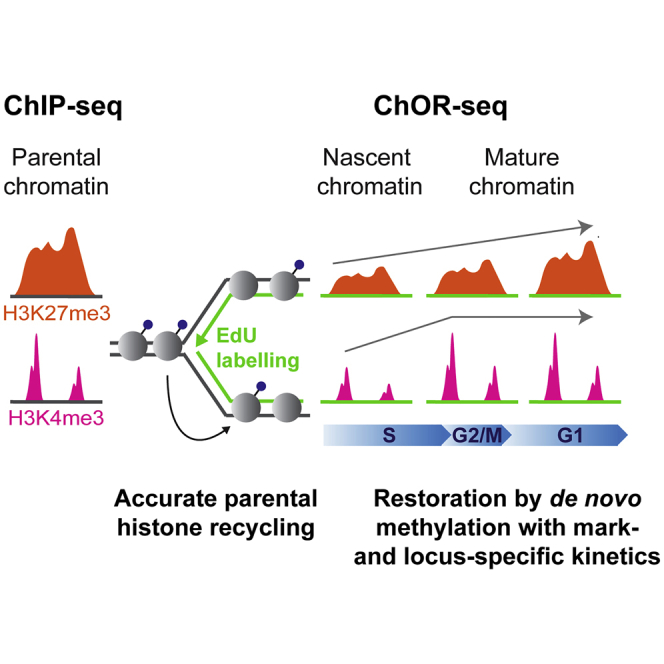
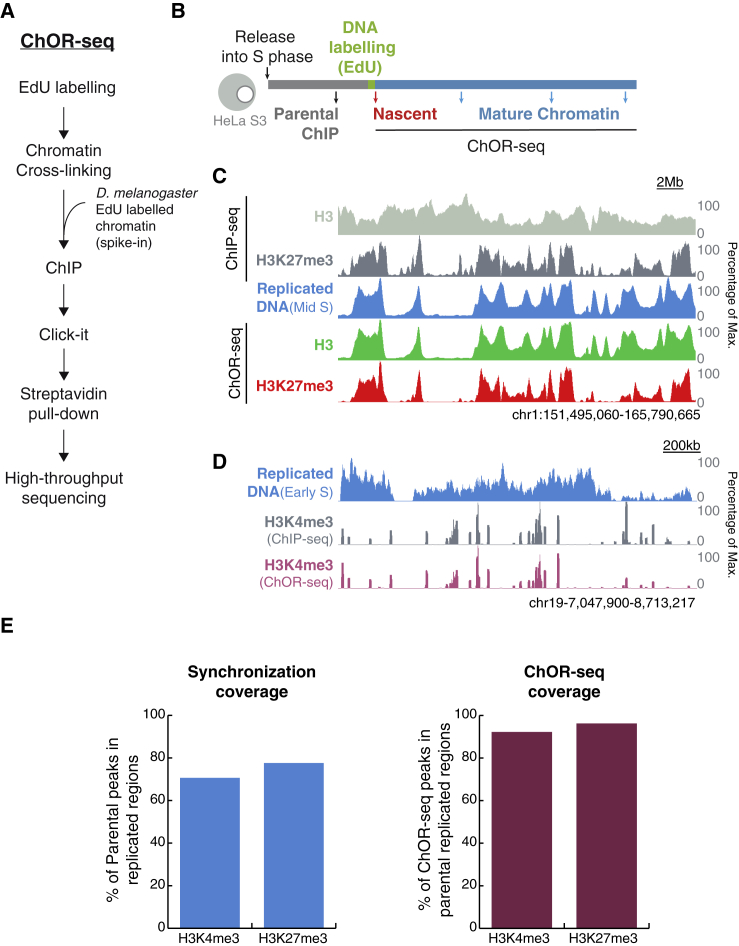
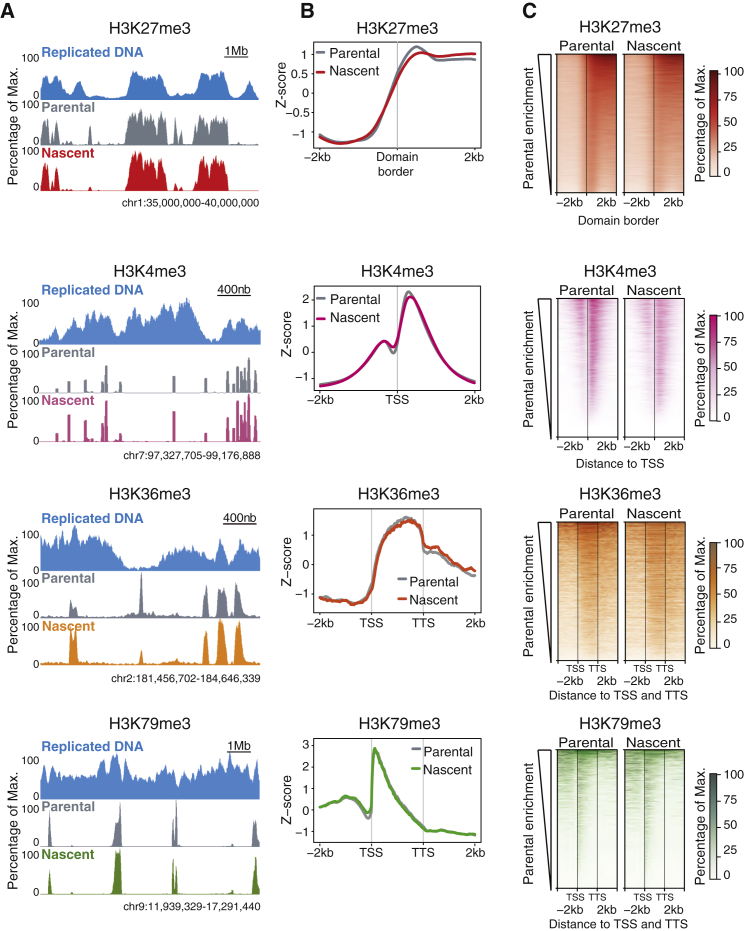
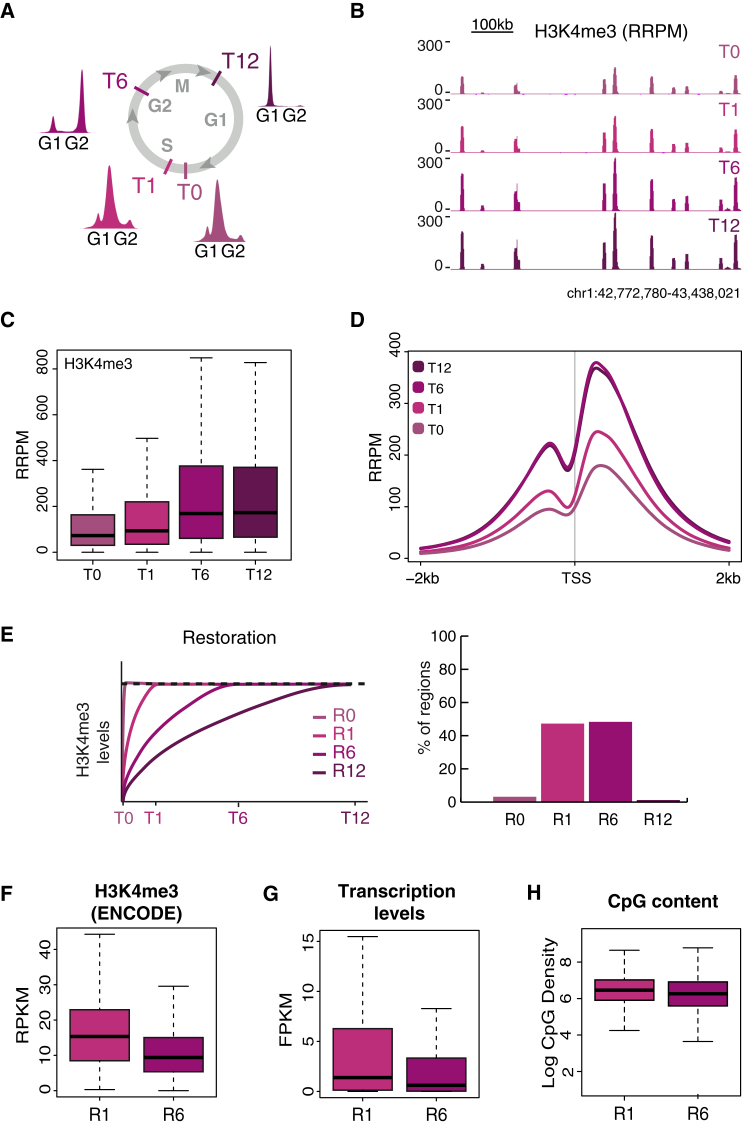
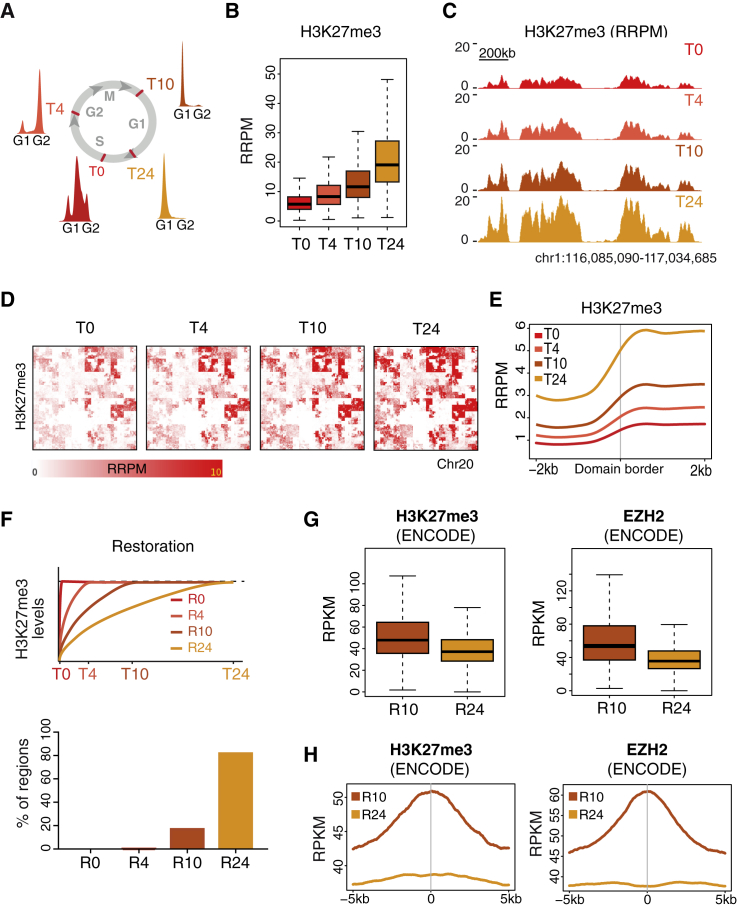
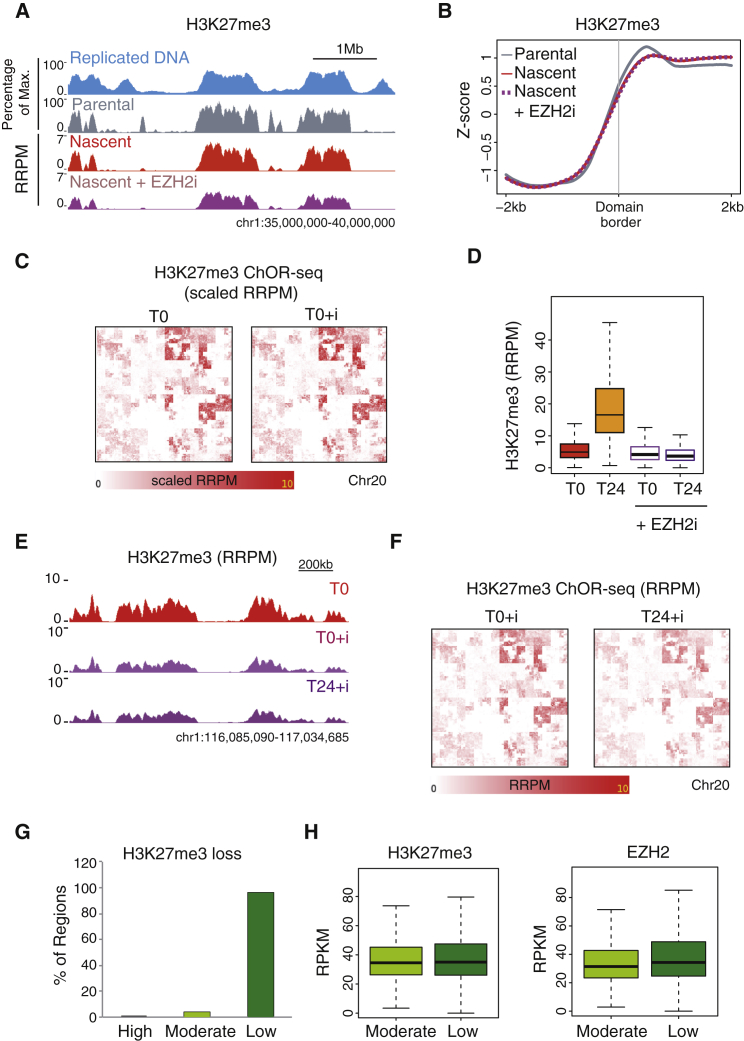
Chromatin organization is disrupted genome-wide during DNA replication. On newly synthesized DNA, nucleosomes are assembled from new naive histones and old modified histones. It remains unknown whether the landscape of histone post-translational modifications (PTMs) is faithfully copied during DNA replication or the epigenome is perturbed. Here we develop chromatin occupancy after replication (ChOR-seq) to determine histone PTM occupancy immediately after DNA replication and across the cell cycle. We show that H3K4me3, H3K36me3, H3K79me3, and H3K27me3 positional information is reproduced with high accuracy on newly synthesized DNA through histone recycling. Quantitative ChOR-seq reveals that de novo methylation to restore H3K4me3 and H3K27me3 levels occurs across the cell cycle with mark- and locus-specific kinetics. Collectively, this demonstrates that accurate parental histone recycling preserves positional information and allows PTM transmission to daughter cells while modification of new histones gives rise to complex epigenome fluctuations across the cell cycle that could underlie cell-to-cell heterogeneity.

Keywords: ChOR-seq; H3K27me3; H3K4me3; cell cycle; chromatin replication; epigenetics; epigenome maintenance; histone modification; histone recycling; quantitative ChIP-seq.


Figures

None
Graphical abstract
Figure 1
Figure 1
Tracking Histone PTM Occupancy after DNA Replication with ChOR-Seq (A) Overview of the ChOR-seq protocol. (B) Experimental setup. HeLa S3 cells were released into S phase from a thymidine block. Parental and nascent chromatin were collected 1 hr before or immediately after EdU labeling, respectively. The EdU label was then chased and mature chromatin harvested at selected time points along the cell cycle. (C and D) Parental ChIP-seq and nascent ChOR-seq profiles of pan-H3 and H3K27me3 (C) and H3K4me3 (D). Replicated DNA profiles are shown in blue. Signal is scaled as percentage of maximum at the locus depicted. (E) Bar plots showing the synchronization coverage (left) and ChOR-seq coverage (right) in the H3K4me3 and H3K27me3 datasets. Percentage is calculated from peaks subsetted into 500 bp non-overlapping windows. See also Figure S1.
Figure 2
Figure 2
The Histone H3 PTM Landscape Is Accurately Reproduced upon Replication of Active and Repressed Genomic Loci (A) Histone PTM profiles from ChIP-seq (parental) and ChOR-seq (nascent) of H3K27me3, H3K4me3, H3K36me3, and H3K79me3. Replicated DNA profiles are shown in blue. Signal is scaled as percentage of maximum at the locus depicted. (B) Average profiles of parental and nascent H3K27me3, H3K4me3, H3K36me3, and H3K79me3. H3K27me3 signal is plotted across 4 kb centered on borders of replicated H3K27me3 domains. H3K4me3 signal is plotted across 4 kb centered on replicated TSSs. H3K36me3 and H3K79me3 signal is plotted from 2 kb upstream to 2 kb downstream of replicated open reading frames. All data shown is Z score normalized. (C) Heatmaps of parental and nascent H3K27me3, H3K4me3, H3K36me3, and H3K79me3 signal across the regions described in (B). Color intensity represents percentage of maximum levels set separately for parental and nascent samples. See also Figure S2.
Figure 3
Figure 3
H3K4me3 Restoration Is Complete within 6 hr with Fastest Kinetics in Highly Expressed Promoters (A) Outline of H3K4me3 qChOR-seq time course analysis. Cell cycle progression was monitored by FACS analysis of DNA content. (B) Comparison of H3K4me3 nascent and mature qChOR-seq profiles. (C) Boxplot of H3K4me3 qChOR-seq signal in replicated parental peaks subsetted into 25 bp non-overlapping windows. (D) Average profiles of H3K4me3 qChOR-seq signal across 4 kb centered on replicated TSSs. In (B)–(D), signal is quantitated using reference-adjusted reads per million (RRPM). (E) Left: scheme of strategy used to parse H3K4me3-enriched regions by restoration kinetics. Regions were defined as R0, R1, R6, or R12 based on the time point at which R12 H3K4me3 levels were reached. Right: bar chart of the proportion of H3K4me3-enriched regions in each restoration category. Regions are defined as 500 bp non-overlapping windows in replicated parental peaks. (F) Boxplot of ENCODE H3K4me3 signal in R1 and R6 regions. Signal is quantitated using reads per kilobase per million (RPKM). (G) Boxplot of RNA-seq signal over genes associated with R1 and R6 promoters. RNA-seq data are from Mortazavi et al. (2008). Signal is quantitated using fragments per kilobase per million (FPKM). (H) Boxplot showing the CpG densities of CpG islands overlapping R1 and R6 regions. CpG content data are from Illingworth et al. (2010). See also Figure S3.
Figure 4
Figure 4
High PRC2 Occupancy Sites Show Faster H3K27me3 Restoration (A) Outline of H3K27me3 qChOR-seq time course analysis. Cell cycle progression was monitored by FACS analysis of DNA content. (B) Boxplots of H3K27me3 qChOR-seq signal in replicated parental peaks subsetted into 2 kb non-overlapping windows. (C) Comparison of H3K27me3 nascent and mature qChOR-seq profiles. (D) Hilbert curves of H3K27me3 qChOR-seq signal over chromosome 20 at the indicated time points. Colored areas reflect the size and signal of H3K27me3-enriched domains. (E) Average profiles of H3K27me3 qChOR-seq signal across 4 kb centered on the border of replicated H3K27me3 domains. In (B)–(E), signal is quantitated using reference-adjusted reads per million (RRPM). (F) Top: scheme of strategy used to parse H3K27me3-enriched regions by restoration kinetics. Regions were defined as R0, R4, R10, or R24 based on the time point at which R24 H3K27me3 levels were reached. Bottom: bar chart of the proportion of H3K27me3-enriched regions in each restoration category. Regions are defined as 2 kb non-overlapping windows in replicated parental peaks. (G) Boxplots of ENCODE H3K27me3 signal (left) and ENCODE EZH2 signal (right) in R10 and R24 regions. Signal is quantitated using reads per kilobase per million (RPKM). (H) Average profiles of ENCODE H3K27me3 signal (left) and ENCODE EZH2 signal (right) across 10 kb centered on R10 and R24 regions. See also Figure S4.
Figure 5
Figure 5
Parental H3K27me3 Domains Are Stable across the Cell Cycle (A) Profiles of parental H3K27me3 ChIP-seq (gray) and nascent H3K27me3 qChOR-seq in the absence (red) or presence (purple) of EZH2 inhibitor. Replicated DNA is shown in blue. Replicated DNA and parental ChIP-seq signal is scaled as a percentage of maximum at the locus depicted; nascent qChOR-seq signal is quantitated using reference-adjusted reads per million (RRPM). (B) Average profiles of parental H3K27me3 ChIP-seq (gray) nascent H3K27me3 qChOR-seq signal in the absence (red) or presence (purple dashes) of EZH2 inhibitor. Signal is shown across 4 kb centered on the border of replicated H3K27me3 domains and Z score normalized. (C) Hilbert curves of nascent (T0) H3K27me3 qChOR-seq signal over chromosome 20 in the absence or presence of EZH2 inhibitor. Scaled RRPM values are shown to compare the occupancy landscape (not absolute intensities). (D) Boxplots of H3K27me3 qChOR-seq signal at T0 and T24 and in the absence or presence of EZH2 inhibitor. Signal is calculated from 2 kb non-overlapping windows in replicated parental peaks. (E) Profiles of H3K27me3 qChOR-seq at T0 (red) and at T0 and T24 in the presence of EZH2 inhibitor (light and dark purple, respectively). (F) Hilbert curves of T0 and T24 H3K27me3 qChOR-seq signal over chromosome 20 in the presence of EZH2 inhibitor. In (D)–(F), signal is quantitated using RRPM. (G) Bar chart showing the proportion of H3K27me3 regions that exhibit high, moderate, and low qChOR-seq signal loss in the presence of EZH2 inhibitor. Regions were defined as high, moderate, or low loss by comparing T0 and T24 qChOR-seq signal in the presence of EZH2 inhibitor. (H) Boxplots of ENCODE H3K27me3 signal (left) and ENCODE EZH2 signal (right) in moderate and low loss regions. Signal is quantitated using reads per kilobase per million (RPKM). See also Figure S5.

References

    1. Afgan E., Baker D., van den Beek M., Blankenberg D., Bouvier D., Čech M., Chilton J., Clements D., Coraor N., Eberhard C. The Galaxy platform for accessible, reproducible and collaborative biomedical analyses: 2016 update. Nucleic Acids Res. 2016;44(W1):W3–W10. - PMC - PubMed
    1. Alabert C., Groth A. Chromatin replication and epigenome maintenance. Nat. Rev. Mol. Cell Biol. 2012;13:153–167. - PubMed
    1. Alabert C., Bukowski-Wills J.C., Lee S.B., Kustatscher G., Nakamura K., de Lima Alves F., Menard P., Mejlvang J., Rappsilber J., Groth A. Nascent chromatin capture proteomics determines chromatin dynamics during DNA replication and identifies unknown fork components. Nat. Cell Biol. 2014;16:281–293. - PMC - PubMed
    1. Alabert C., Barth T.K., Reverón-Gómez N., Sidoli S., Schmidt A., Jensen O.N., Imhof A., Groth A. Two distinct modes for propagation of histone PTMs across the cell cycle. Genes Dev. 2015;29:585–590. - PMC - PubMed
    1. Allis C.D., Jenuwein T. The molecular hallmarks of epigenetic control. Nat. Rev. Genet. 2016;17:487–500. - PubMed

Publication types