. 2018 Sep:35:204-221.
doi: 10.1016/j.ebiom.2018.08.001. Epub 2018 Aug 23.

The miR 495-UBE2C-ABCG2/ERCC1 axis reverses cisplatin resistance by downregulating drug resistance genes in cisplatin-resistant non-small cell lung cancer cells

Affiliations

The miR 495-UBE2C-ABCG2/ERCC1 axis reverses cisplatin resistance by downregulating drug resistance genes in cisplatin-resistant non-small cell lung cancer cells

Jiwei Guo et al. EBioMedicine. 2018 Sep.

Retraction in

Abstract

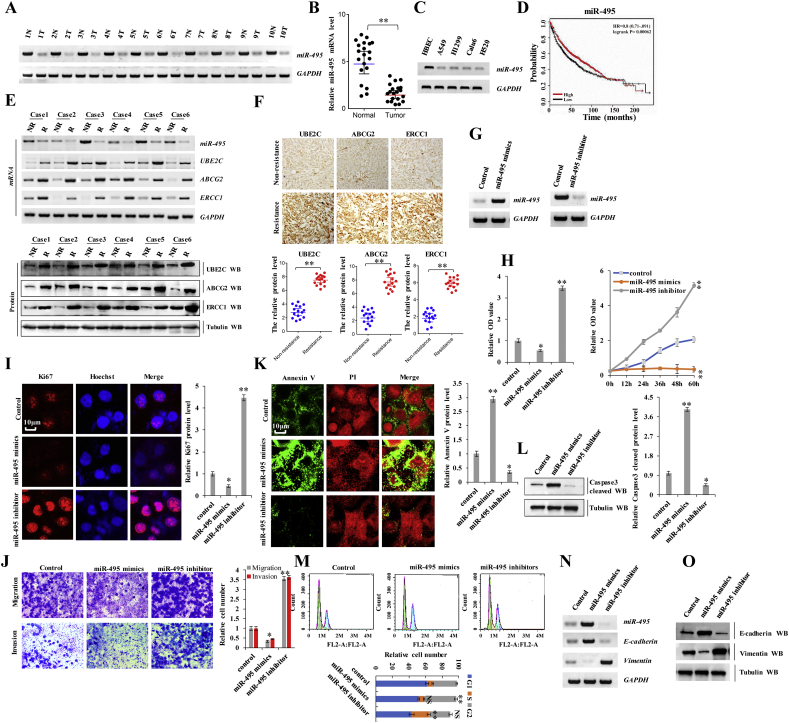
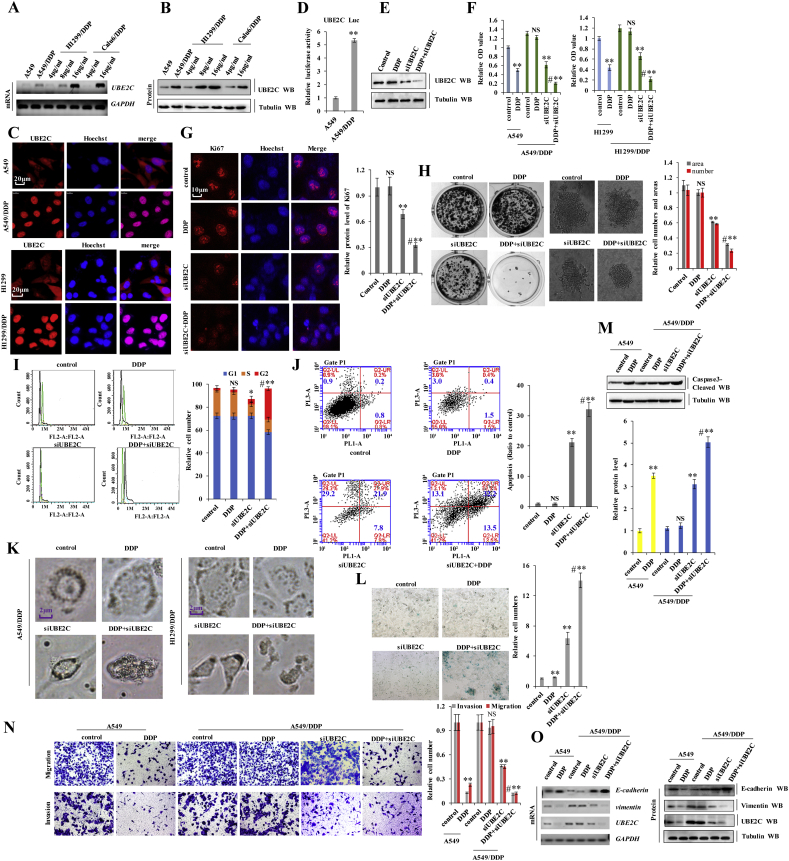
Cisplatin (DDP) resistance has become the leading cause of mortality in non-small cell lung cancer (NSCLC). miRNA dysregulation significantly contributes to tumor progression. In this study, we found that miR-495 was significantly downregulated in lung cancer tissue specimens. This study aimed to elucidate the functions, direct target genes, and molecular mechanisms of miR-495 in lung cancer. miR-495 downregulated its substrate UBE2C through direct interaction with UBE2C 3'- untranslated region. UBE2C is a proto-oncogene activated in lung cancer; however, its role in chemotherapeutic resistance is unclear. Herein, UBE2C expression levels were higher in DDP-resistant NSCLC cells; this was associated with the proliferation, invasion, and DDP resistance in induced cisplatin-resistant NSCLC cells. Furthermore, epithelial-mesenchymal transitions (EMT) contributed to DDP resistance. Moreover, UBE2C knockdown downregulated vimentin. In contrast, E-cadherin was upregulated. Importantly, miR-495 and UBE2C were associated with cisplatin resistance. We attempted to evaluate their effects on cell proliferation and cisplatin resistance. We also performed EMT, cell migration, and invasion assays in DDP-resistant NSCLC cells overexpressing miR-495 and under-expressing UBE2C. Furthermore, in silico assays coupled with western blotting and luciferase assays revealed that UBE2C directly binds to the 5'-UTR of the drug-resistance genes ABCG2 and ERCC1. Furthermore, miR-495 downregulated ABCG2 and ERCC1 via regulation of UBE2C. Together, the present results indicate that the miR495-UBE2C-ABCG2/ERCC1 axis reverses DDP resistance via downregulation of anti-drug genes and reducing EMT in DDP-resistant NSCLC cells.

Keywords: ABCG2; Cisplatin resistant; EMT; ERCC1; MicroRNA-495; UBE2C.


Figures

Fig. 1
Fig. 1
miR-495 was downregulated in lung cancer and inhibited cancer cell proliferation, migration, invasion and EMT in lung cancer cells. (a) RT-PCR assay showed that the mRNA level of miR-495 was lower in human lung cancer tissues compared with their normal adjacent lung tissues. (b) The mRNA expression of miR-495 in 20 lung cancer tumor tissues and adjacent normal tissues (n = 20). (c) Gel-based RT-PCR with densitometric quantitation demonstrating reduced the expression of miR-495 in human lung cancer cells compared with their normal control cell HBEC. (d) Kaplan Meier overall survival (OS) curves of miR-495 (n = 1926, p = .00062 by log-rank test for significance) for lung cancers. (e-f) The mRNA and protein levels of miR-495, UBE2C, ABCG2 and ERCC1 were analyzed by RT-PCR, Western blot (e) and immunohistochemical staining (f) assay in the DDP resistant lung cancer tissues and their non-resistant tissues with anthracyclines-based neoadjuvant chemotherapy. (g-o) A549 cells were transfected with miR-495-mimics and miR-495-inhibitor. (g) The expression level of miR-495 was analyzed by RT-PCR assay. (h) The cellular proliferation was analyzed by CCK8 and MTT assay. (i) The protein of Ki67 was analyzed by immunofluorescent staining. (j) Cellular migration and invasion ability was analyzed by cell transwell assay. (k) The protein of Annexin V was analyzed by immunofluorescent staining. (l) The protein of cleaved Caspase3 was analyzed by immunoblotting assay. (m) Cell cycle profile was analyzed by cell flow cytometry. (n, o) The protein of E-cadherin and Vimentin were analyzed by RT-PCR (n) and western blot assay (o). Results were presented as mean ± SD, and the error bars represent the SD of three independent experiments. *p < .05; **p < .01 vs control group.
Fig. 2
Fig. 2
miR-495 reverses DDP resistance by downregulating drug resistance genes ABCG2 and ERCC1 in DDP-resistant NSCLC cells. (a) Gel-based RT-PCR densitometric quantitation demonstrating reduced mRNA expression of miR-495 in DDP-resistant NSCLC cells compared with their parent cells. (b) A549/DDP, H1299/DDP or Calu6/DDP cells were transfected with control mimics or miR-495 mimics and then were treated with PBS or DDP 6 μg/ml for 60 h, respectively. The cellular proliferation and cell growth was analyzed by CCK8. (c-h) A549/DDP cells were transfected with control mimics or miR-495 mimics then treated with PBS or DDP 6 μg/ml for 60 h, respectively. (c) The protein of Ki67 was analyzed by immunofluorescent staining. (d) Colony formation density was analyzed by colony formation assay. (e) Cellular migration and invasion ability was analyzed by transwell assay. (f) The protein of cleaved Caspase3 was analyzed by immunoblotting assay. (g) The protein of Annexin V was analyzed by immunofluorescent staining. (h, i) The expression of E-cadherin and Vimentin were analyzed by RT-PCR and western blot in A549/DDP (h) cells and H1299/DDP cells (i). (j, k) A549/DDP (j) and H1299/DDP (k) cells were transfected with miR-495 mimics or miR-495 inhibitors. The mRNA and protein levels of miR-495, ERCC1 and ABCG2 were analyzed were analyzed by RT-PCR and immunoblotting. (l, m) A549/DDP (l) and H1299/DDP (m) cells were transfected with miR-495 mimics. RT-PCR and Western blot result shows that miR-495 dose-dependently and time-dependently decreased the mRNA and protein levels of ERCC1 and ABCG2. Results were presented as mean ± SD, and the error bars represent the SD of three independent experiments. **p < .01 vs control group.
Fig. 3
Fig. 3
Aberrant activation of UBE2C in lung tumors from patients and dysfunction of UBE2C affected cell proliferation, invasion, and EMT. (a, b) RT-PCR and western blot indicated that the mRNA (a) and protein levels (b) of UBE2C were higher in human lung cancer tissues compared with their normal adjacent lung tissues. Statistical analysis of the mRNA and protein level of UBE2C (n = 20). (c) Gel-based RT-PCR and immunoblotting with densitometric quantitation demonstrating elevated mRNA and protein expressions of UBE2C in human lung cancer cells compared with their normal control cell HBEC. (d) Immunohistochemistry with frozen sections indicated that increased the protein level of UBE2C and UBE2C accumulated in nuclear in lung cancer samples while more UBE2C was localized in cytoplasm of those normal adjacent lung tissues. (e) Immunoblotting showing increased UBE2C in nuclear in human lung cancer tissues compared with their normal adjacent lung tissues. (f) Kaplan Meier overall survival (OS) curves of UBE2C (n = 1926, p = 1E-16 by log-rank test for significance) for human lung cancers. (g-o) A549 cells were transfected with siUBE2C or Flag-UBE2C to decrease or increase the protein of UBE2C. (g) The mRNA and protein levels of UBE2C were analyzed by RT-PCR and Western blot assay. (h) The cellular proliferation was analyzed by CCK8 assay. (i, j) Cell cycle profile (i) and the apoptosis (j) were analyzed by cell flow cytometry. (k) The protein of cleaved Caspase3 was analyzed by immunoblotting assay. (l) Cellular migration and invasion ability was analyzed by transwell assay. (m) Cell senescence was analyzed by SA-β-gal staining. (n, o) The expression of E-cadherin and Vimentin were analyzed by RT-PCR (n) and western blot (o). Results were presented as mean ± SD, and the error bars represent the SD of three independent experiments. *p < .05; **p < .01 vs control group.
Fig. 4
Fig. 4
miR-495 reduced cellular proliferation and invasion by regulating UBE2C mRNA stability in DDP-resistant NSCLC cells. (a) Putative miR-495 binding sites in the 3’-UTR sequences of UBE2C. (b) Luciferase activity of A549/DDP cells transfected with plasmids carrying a wild-type or mutant 3’UTR of UBE2C, in response to miR-495 mimics or inhibitor. (c, d) The A549/DDP cells were transfected with miR-495 mimics or miR-495 inhibitor. The mRNA and protein levels of UBE2C were analyzed were analyzed by RT-PCR, immunoblotting (c) and immunofluorescent staining (d). (e, f) RT-PCR and Western blot result shows that miR-495 dose-dependently (e) and time- dependently (f) decreased the mRNA and protein levels of UBE2C. (g-m) A549/DDP cells were transfected with miR-495 mimics or miR-495 inhibitor. UBE2C or siUBE2C were used for upregulating or downregulating the protein level of miR-495 target genes, respectively. (g) The mRNA and protein expression levels of miR-495 and UBE2C were analyzed by RT-PCR and immunoblotting. (h) The cellular proliferation was analyzed by CCK8 assay. (i) The protein of cleaved Caspase3 was analyzed by immunoblotting assay. (j) Colony formation density was analyzed by colony formation assay. (k) Cellular migration and invasion ability was analyzed by transwell assay. (l, m) The mRNA and protein levels of E-cadherin and Vimentin were analyzed by RT-PCR, immunoblotting (l) and immunofluorescent staining (m). Results were presented as mean ± SD, and the error bars represent the SD of three independent experiments. *p < .05; **p < .01 vs control group.
Fig. 5
Fig. 5
UBE2C was expressed at higher levels in DDP-resistant NSCLC cells and positively correlated with DDP resistance. (a, b) RT-PCR (a) and western blot (b) showed that the mRNA and protein levels of UBE2C were higher in cisplatin resistant cells with the increased adapting DDP concentration than their parent cells. (c) Immunofluorescent staining showing increased UBE2C in A549/DDP and H1299/DDP cells than in the parent cells. (d) The activities of UBE2C promoter was examined by luciferase reporter gene assays in A549 and A549/DDP cells. (e) A549/DDP cells were treated with DDP, siUBE2C and cotreatment with of siUBE2C and DDP at 6 μg/ml for 60 h. The protein expression levels of UBE2C was analyzed by immunoblotting. (f) A549 and H1299 cells were treated with DDP or A549/DDP and H1299/DDP cells were treated with DDP, siUBE2C and cotreatment with of siUBE2C and DDP at 6 μg/ml for 60 h. The cellular proliferation was analyzed by CCK8 assay. (g-l) A549/DDP cells were treatment of DDP, siUBE2C or co-treatment of siUBE2C and DDP at 6 μg/ml for 60 h. (g) the protein level of Ki67 was analyzed by immunofluorescent staining. (h) the soft gel colony formation density was analyzed by colony formation assay. (i, j) Cell cycle profile (i) and the apoptosis (j) were analyzed by cell flow cytometry. (k) Cellular morphology was analyzed by phase contrast microscope assay. (l) Cell senescence was analyzed by SA-β-Gal staining assay. (m-o) A549 cells were treated with DDP or A549/DDP cells were treatment of DDP, siUBE2C or co-treatment of siUBE2C and DDP at 6 μg/ml for 60 h. (m) The protein of cleaved Caspase3 was analyzed by immunoblotting assay. (n) Cell migration and invasion growth were analyzed by transwell assay. (o) The mRNA and protein levels of EMT relevant molecular protein E-cadherin and Vimentin were analyzed by RT-PCT and Western blot assay. Results were presented as mean ± SD, and the error bars represent the SD of three independent experiments. *p < .05; **p < .01 vs control group.
Fig. 6
Fig. 6
UBE2C directly binds to the promoter of ABCG2 and ERCC1 to regulate their transcriptional activity, result in DDP resistance. (a) The activities of different fragments of ABCG2 promoter (pGL3–1350, pGL3–750, pGL3–330 or pGL3–270) and ERCC1 (pGL3–1380, pGL3–900, pGL3–190 or pGL3–290) were measured by luciferase reporter gene assays in A549/DDP cells. (b) The activities of pGL3–270 (−450~ − 180) for ABCG2 and pGL3–290 (−110~ + 180) for ERCC1 were measured by luciferase reporter gene assays in A549 cells with treatment of UBE2C. (c) Putative UBE2C binding sites in the 5’UTR sequence of ABCG2 and ERCC1. (d) Luciferase activity of A549/DDP or H1299/DDP cells transfected with plasmids carrying a wild-type or mutant 5’UTR of ABCG2 or ERCC1 in response to overexpress UBE2C or knockdown of UBE2C using the siRNA. (e) Quantitative ChIP analysis demonstrating that knockdown of UBE2C using the siRNA decreases but overexpressing UBE2C increases UBE2C levels within the promoter region of ABCG2 or ERCC1 in A549/DDP or H1299/DDP cells. (f, g) the mRNA and protein levels of ABCG2 and ERCC1 were analyzed by RT-PCR and Western blotting in A549 cells with overexpressing UBE2C (f) or in A549/DDP cells with knockdown of UBE2C using the siRNA (g). (h) The protein levels of ABCG2 and ERCC1 were analyzed by immunofluorescent staining assay in A549 cells with overexpressing UBE2C. (i, j) RT-PCR and Western blot result shows that UBE2C dose-dependently (i) and time-dependently (j) increased the mRNA and protein levels of ABCG2 and ERCC1 in A549 cells. (k) RT-PCR and western blot assay showed the mRNA and protein levels of ERCC1 and ABCG2 were dramatically higher in A549/DDP than its parent cell A549. (l) The luciferase activity of the ERCC1 and ABCG2 promoter was higher in the A549/DDP cells compared with its parent cell A549 by luciferase reporter assay. (m, n) A549 cells were transfected with ABCG2 and ERCC1 or A549/DDP cells were knockdown of ABCG2 and ERCC1 using siRNA, then these cells were treated with DDP at 6 μg/ml for 60 h. The protein levels of ABCG2 and ERCC1 were analyzed by western blot assay (m) and cellular proliferation was analyzed by CCK8 assay (n). (o) RT-PCR and western blot assay showed that co-treatment with siUBE2C and DDP significantly reduced the mRNA and protein levels of drug resistant genes ERCC1 and ABCG2 than individual treatment of siUBE2C or DDP in A549/DDP cells, respectively. (p) luciferase reporter assay showed that the luciferase activity of the ERCC1 and ABCG2 promoter was lower in the A549/DDP cells with co-treatment with siUBE2C and DDP than individual treatment of siUBE2C or DDP, respectively. (q) The relationship between protein expression levels of UBE2C and ERCC1/ABCG2 were analyzed based on western blot assay in A549/DDP cells. Results were presented as mean ± SD, and the error bars represent the SD of three independent experiments. *p < .05; **p < .01; ***p < .001 vs control group.
Fig. 7
Fig. 7
miR-495 reverses DDP resistance by regulating ABCG2 and ERCC1 by directly targeting UBE2C. (a) A549/DDP cells were transfected with miR-495 mimics or inhibitor. UBE2C or si UBE2C were used for upregulating or downregulating the protein level of miR-495 target genes, respectively. The mRNA and protein expression levels of miR-495, UBE2C, ABCG2 and ERCC1 were analyzed by RT-PCR and immunoblotting assay. (b-k) A549/DDP cells were transfected with miR-495 mimics and control or miR-495 mimics and siUBE2C, then treated with PBS or DDP 6 μg/ml for 60 h. (b) The mRNA and protein levels of miR-495, UBE2C, ABCG2 and ERCC1 were analyzed by RT-PCR and Western blot assay. (c, d) The protein level of ERCC1 (c) and ABCG2 (d) were analyzed by immunofluorescent staining. (e) The cellular proliferation was analyzed by CCK8 assay. (f) The protein level of Ki67 was analyzed by immunofluorescent staining. (g) The proteins of UBE2C and cleaved caspas-3 were analyzed by Western blot assay. (h) Colony formation density was analyzed by colony formation assay. (i) Cellular migration was analyzed by cell scratch assay. (j) Cellular migration and invasion ability was analyzed by transwell assay. (k) The mRNA and protein of E-cadherin and Vimentin were analyzed by RT-PCR and western blot. Results were presented as mean ± SD, and the error bars represent the SD of three independent experiments. *p < .05 vs control group.
Fig. 8
Fig. 8
miR-495 inhibits DDP-resistant tumor growth in vivo. (a) The mRNA and protein levels of UBE2C, ABCG2 and ERCC1 were analyzed by RT-PCR and Western blot assay in the A549/DDP cell line with stable overexpression of miR-495 mimics and control mimics. (b) The DDP treatment significantly alleviate body weight loss of the nude mice injected by A549/DDP cells with stable overexpression of miR-495 mimics compare with control mimics. (c) Kaplan-Meier overall survival (OS) curves of mice injection with control and miR-495 treated with DDP. (d-f) Microscopy of tumor nodules of mouse (d) and overall tumor sizes (e) and growth curves (f). (g-m) H&E microscopy of tumor nodules from primary A549/DDP cells with stable overexpression of miR-495 mimics and control mimics in the subcutaneous xenografts of nude mice treated with DDP. Immunohistochemical staining shows that UBE2C, ERCC1, ABCG2, Ki67, Vimentin of miR-495 mimics groups were decreased in xenograft tumor tissues after treatment with DDP. In contrast, E-cadherin was higher in the miR-495 mimics groups than the control mimics mice. Statistical analysis (n=23) of the protein levels of UBE2C (h), ERCC1 (i), ABCG2 (j), Ki67 (k), Vimentin (l) and E-cadherin (m). (n) The diagram of miR495-UBE2C-ABCG2/ERCC1 axis reverses DDP resistance in cisplatin resistant NSCLC cells. Results were presented as mean ± SD, and the error bars represent the SD of three independent experiments. *p < .05; **p < .01 vs control group.
Supplementary Fig. S1
A549 cells were transfected with miR-495-mimics and miR-495-inhibitor. (a) Colony formation density was analyzed by colony formation assay. (b) Cellular migration ability was analyzed by cell scratch assay. (c) The apoptosis was analyzed by cell flow cytometry. Results were presented as mean ± SD, and the error bars represent the SD of three independent experiments. *p < .05; **p < .01 vs control group.
Supplementary Fig. S2
A549/DDP cells were transfected with control mimics or miR-495 mimics and then treated with PBS or DDP 6 μg/ml for 60 h, respectively. (a) Cellular migration ability was analyzed by cell scratch assay. (b) The expression of E-cadherin and Vimentin were analyzed by immunofluorescent staining. (c-e) A549/DDP or H1299/DDP cells were transfected with control mimics, miR-495 mimics or miR-495 inhibitors, respectively. (c) The mRNA of HER2, MRP1, KRAS, BRCA1 and MDR1 was analyzed by RT-PCR assay. (d, e) The proteins of ABCG2 and ERCC1 were analyzed by immunofluorescent staining in A549/DDP cells (d) and H1299/DDP cells (e). Results were presented as mean ± SD, and the error bars represent the SD of three independent experiments. *p < .05; **p < .01 vs control group.
Supplementary Fig. S3
(a, b) A549 cells were transfected with siUBE2C-1 or siUBE2C-2. (a) The mRNA and protein levels of UBE2C were analyzed by RT-PCR and immunoblotting assay. (b) The cellular proliferation was analyzed by CCK8 assay. (c-e) A549 cells were transfected with siUBE2C or Flag-UBE2C to decrease or increase the protein of UBE2C. (c) The cellular proliferation was analyzed by MTT assay. (d) Colony formation density was analyzed by colony formation assay. (e) Cellular migration was analyzed by cell scratch assay. Results were presented as mean ± SD, and the error bars represent the SD of three independent experiments. *p < .05; **p < .01 vs control group.
Supplementary Fig. S4
A549/DDP cells were transfected with miR-495 mimics or miR-495 inhibitor. UBE2C or siUBE2C were used for upregulating or downregulating the protein level of miR-495 target genes, respectively. (a) The protein of Annexin V was analyzed by immunofluorescent staining. (b) Cell senescence was analyzed by SA-β-gal staining. (c) Cellular migration ability was analyzed by cell scratch assay. Results were presented as mean ± SD, and the error bars represent the SD of three independent experiments. *p < .05; **p < .01 vs control group.
Supplementary Fig. S5
(a) Immunoblotting showing increased nuclear UBE2C in A549/DDP cells compared with its parent cell A549. (b-e) A549 and A549/DDP cells were treatment of DDP, siUBE2C or co-treatment of siUBE2C and DDP at 6 μg/ml for 60 h. (b) Cell proliferation was analyzed by MTT assay. Similar result of cell growth was obtained for H1299 and H1299/DDP cells. (c) The protein of Annexin V was analyzed by immunofluorescent staining. (d) Cellular migration ability was analyzed by cell scratch assay. (e) The protein of E-cadherin and Vimentin were analyzed by immunofluorescent staining. Results were presented as mean ± SD, and the error bars represent the SD of three independent experiments. **p < .01 vs control group.
Supplementary Fig. S6
(a) A549/DDP cells were transfected with control and UBE2C, respectively. The mRNA of UBE2C, ABCG2, ERCC1, HER2, MRP1, KRAS, BRCA1 and MDR1 was analyzed by RT-PCR assay. (b, c) A549/DDP or H1299/DDP cells were transfected with siABCG2–1 or siABCG2–2. (b) The mRNA and protein levels of ABCG2 were analyzed by RT-PCR and immunoblotting assay in A549/DDP cells. (c) The cellular proliferation was analyzed by CCK8 assay in A549/DDP or H1299/DDP cells. (d, e) A549/DDP or H1299/DDP cells were transfected with siERCC1-1 or siERCC1-2. (d) The mRNA and protein levels of ERCC1 were analyzed by RT-PCR and immunoblotting assay in A549/DDP cells. (e) The cellular proliferation was analyzed by CCK8 assay in A549/DDP or H1299/DDP cells. Results were presented as mean ± SD, and the error bars represent the SD of three independent experiments. *p < .05; **p < .01 vs control group.
Supplementary Fig. S7
A549/DDP cells were co-transfected with miR-495 mimics and control or co-transfected with miR-495 mimics and siUBE2C, then treated with PBS or DDP 6 μg/ml for 60 h. The protein of E-cadherin and Vimentin were analyzed by immunofluorescent staining. Results were presented as mean ± SD, and the error bars represent the SD of three independent experiments. **p < .01 vs control group.

Similar articles

Cited by

References

    1. Barton M.K. Human immunodeficiency virus status has no effect on survival in patients with non-small cell lung cancer. CA Cancer J Clin. 2013;63(3):145–146. - PubMed
    1. Barton M.K. Adjuvant chemotherapy benefits older and younger non-small cell lung cancer patients alike. CA Cancer J Clin. 2012;62(5):279–280. - PubMed
    1. Ramalingam S.S., Owonikoko T.K., Khuri F.R. Lung cancer: new biological insights and recent therapeutic advances. CA Cancer J Clin. 2011;61(2):91–112. - PubMed
    1. Lin S., Gregory R.I. MicroRNA biogenesis pathways in cancer. Nat Rev Cancer. 2015;15(6):321–333. - PMC - PubMed
    1. McCarthy N. MicroRNA: lacking in maturity. Nat Rev Cancer. 2013;13(6):377. - PubMed

Publication types

MeSH terms