. 2018 Sep 6;23(3):355-369.e9.
doi: 10.1016/j.stem.2018.07.018. Epub 2018 Aug 23.

SIRT1 Activation Disrupts Maintenance of Myelodysplastic Syndrome Stem and Progenitor Cells by Restoring TET2 Function

Affiliations

SIRT1 Activation Disrupts Maintenance of Myelodysplastic Syndrome Stem and Progenitor Cells by Restoring TET2 Function

Jie Sun et al. Cell Stem Cell. .

Abstract

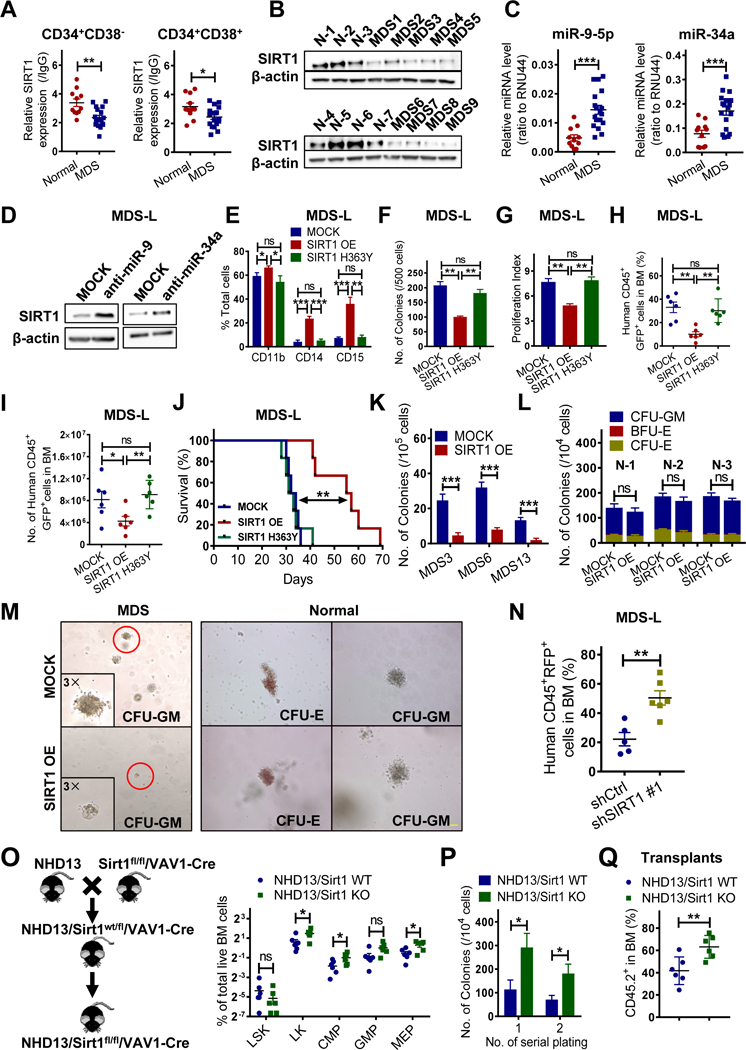
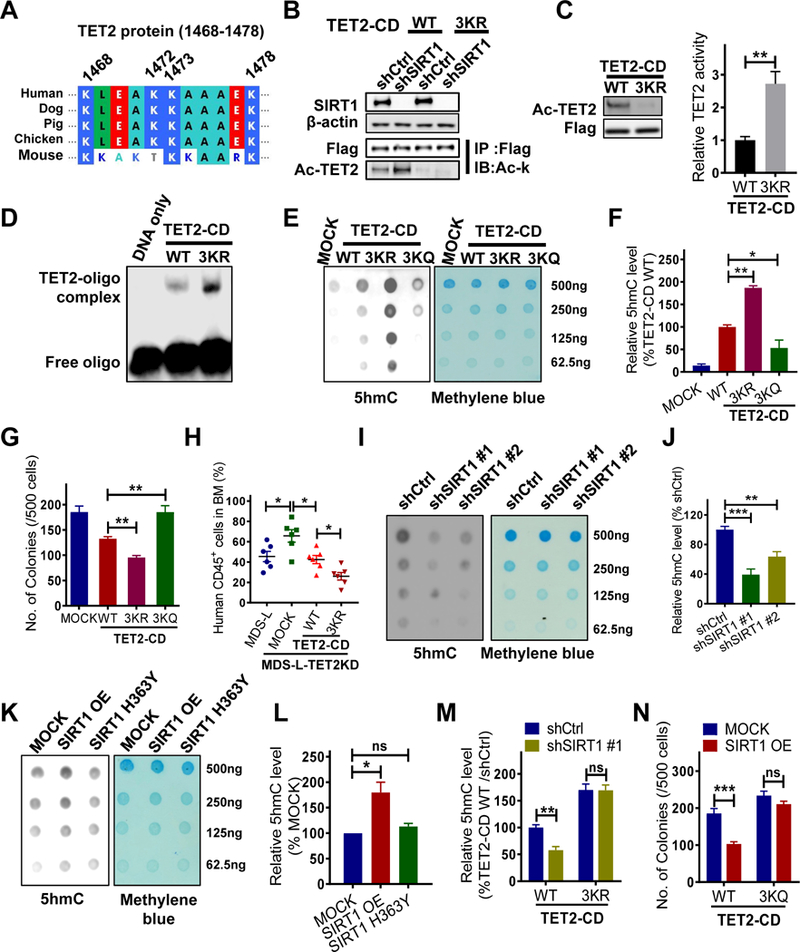
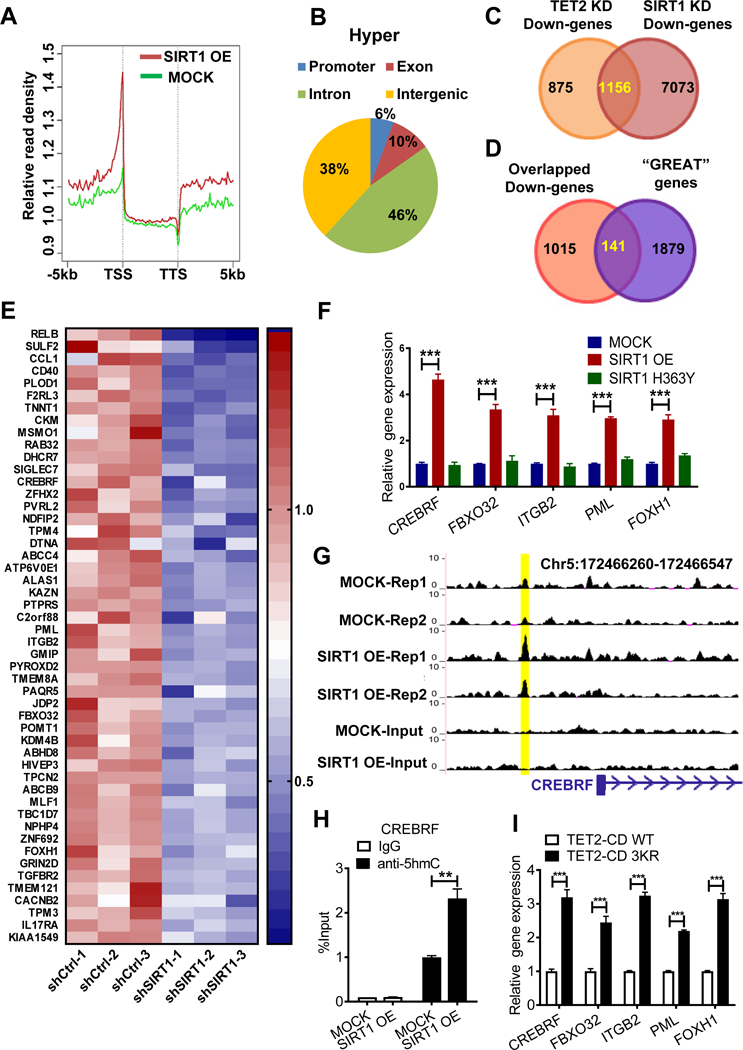
Myelodysplastic syndrome (MDS), a largely incurable hematological malignancy, is derived from aberrant clonal hematopoietic stem/progenitor cells (HSPCs) that persist after conventional therapies. Defining the mechanisms underlying MDS HSPC maintenance is critical for developing MDS therapy. The deacetylase SIRT1 regulates stem cell proliferation, survival, and self-renewal by deacetylating downstream proteins. Here we show that SIRT1 protein levels were downregulated in MDS HSPCs. Genetic or pharmacological activation of SIRT1 inhibited MDS HSPC functions, whereas SIRT1 deficiency enhanced MDS HSPC self-renewal. Mechanistically, the inhibitory effects of SIRT1 were dependent on TET2, a safeguard against HSPC transformation. SIRT1 deacetylated TET2 at conserved lysine residues in its catalytic domain, enhancing TET2 activity. Our genome-wide analysis identified cancer-related genes regulated by the SIRT1/TET2 axis. SIRT1 activation also inhibited functions of MDS HSPCs from patients with TET2 heterozygous mutations. Altogether, our results indicate that restoring TET2 function through SIRT1 activation represents a promising means to target MDS HSPCs.

Keywords: HSPCs; SIRT1; SRT1720; TET2; acetylation; myelodysplastic syndrome.


Conflict of interest statement

Declaration of Interests

The authors declare that no conflicts of interest exist.

Figures

Figure 1
Figure 1. SIRTI-deficient MDS HSPCs exhibit enhanced cell growth and self-renewal.
(A) SIRT1 protein expression in indicated normal (n=11) and MDS (n=18) progenitors, as analyzed by intracellular labeling. Median fluorescence intensity is expressed relative to IgG control (see Table S1 for patient information). (B) Western blot showing SIRT1 expression in MDS CD34+ (n=9) relative to normal (N) CD34+ (n=7) cells. (C) miR-9–5p and miR-34a expression in normal (n=11) and MDS (n=18) CD34+ cells. RNU44 served to normalize expression. (D) Western blotting for SIRT1 in MDS-L cells transduced with vector expressing anti-miR-9–5p, anti-miR- 34a or control (MOCK). Results are representative of 3 independent experiments. (E-G) MDS-L cells transduced with vector expressing SIRT1 WT (SIRT1 OE), SIRT1 mutant (SIRT1 H363Y) or MOCK were sorted and assessed for indicated myeloid markers at day 7 (E), for CFC (F), and Dye670-based proliferation assay at day 3 (G). (H-J) Transduced MDS-L cells were transplanted into NSGS mice. Shown is the percentage (H) and number (I) of human CD45+ GFP+ cells engrafted in BM of NSGS mice 4 weeks post-BMT among indicated groups. Survival of mice engrafted with indicated MDS-L cells (n=6 per group) (J). (K-M) CFC assay of primary MDS (n=3) (K) or normal (n=3) (L) CD34+ cells transduced with SIRT1 OE vector or MOCK. Triplicate determinations were made for each experimental point. Representative colonies are shown in (M). Scale bar, 100 μm. (N) Percentage of transduced human CD45+ RFP+ MDS-L cells in BM of NSGS recipients at 4 weeks post-BMT. (O) Shown is a breeding scheme for generating the NHD13/Sirt1 KO animals (left). Percentage of indicated HSPC populations in primary NHD13+Sirt1 KO (n=6) or NHD13+Sirt1 WT (n=6) animals at 17 weeks of age (right). (P) Serial replating of NHD13+ Sirt1 KO or NHD13+Sirt1 WT cells. (Q) Percentage of CD45.2+ donor chimerism in BM of secondary recipients (n=6 per group) receiving cells from NHD13+Sirt1 KO or NHD13+Sirt1 WT mice 16 weeks post-BMT. Significance: *p < 0.05, **p < 0.01, ***p<0.001, compared with controls. Results shown in (E-G, P) represent means ± SEM of three independent experiments. “n” represents the number of samples or animals used. (See also Figure S1 and Table S1.)
Figure 2
Figure 2. SIRT1 deacetylates TET2 in MDS cells.
(A) Viability of SRT1720 (2.5 µM) treated MDS-L cells transfected with indicated siRNAs. Results were normalized to untreated MDS-L cells transfected with the corresponding siRNA. (B) CFC of SIRT1 OE or MOCK transduced MDS-L cells with/without endogenous TET2 KD. (C) Flag-tagged TET2 or HA-tagged SIRT1 was overexpressed in MDS-L cells, and lysates IP’d for Flag (upper) or HA (bottom), followed by western blotting to assess SIRT1/TET2 interaction. Results are representative of 3 independent experiments. (D) Representative images of Duolink in situ PLA in primary MDS CD34+CD38- cells. Top row, red fluorescent spots indicate SIRT1/TET2 protein interactions (left), DAPI- stained nuclei appear in blue (middle), and the merged image is at right; scale bar, 5 μm. Bottom row, IgG controls. (E) Flag-tagged TET2 fragments (upper) and HA-tagged SIRT1 were co-expressed in 293T cells. Indicated TET2 protein fragments were pulled down with anti-Flag antibody followed by western blotting for HA and Flag. (F-H) Endogenous TET2 protein from MDS-L cells was IP’d followed by western blotting for acetylated lysine (Ac-K) and TET2. Shown are TET2 acetylation levels in MDS-L cells transduced with SIRT1 OE or MOCK (F), MDS-L treated with SRT1720 or vehicle (DMSO) (G), and MDS-L treated with EX527, MS275, or vehicle (DMSO) (H). H3K27ac) served as a positive control for MS275 treatment. (I) Endogenous TET2 was IP’d in primary MDS or normal MNCs, and acetylation levels were evaluated using anti-Ac-K antibody. Significance: *p < 0.05, **p < 0.01, ***p<0.001, compared with controls. Results shown in (B) represent mean ± SEM of three independent experiments. (See also Figure S2 and Tables S2.)
Figure 3
Figure 3. SIRT1 activation suppresses MDS cell growth in a TET2 deacetylation- dependent manner.
(A) Protein sequence alignment of TET2 proteins in the region encompassing human K1472, K1473 and K1478. (B) MDS-L-TET2KD cells were transduced with either WT TET2-CD or TET2-CD-3KR and then transduced with shSIRT1 or shCtrl. Flag- tagged TET2-CD proteins were IP’d followed by western blotting for Ac-K and Flag. Input is shown at the bottom. (C-D) 293T cells expressing CBP were transfected with 3KR or WT TET2- CD constructs, and then Flag-tagged TET2-CD proteins were IP’d for an in vitro TET2 activity assay (C, right) or EMSA (D). TET2-CD protein levels and acetylation levels were determined by western blotting (C, left). (E-F) 5hmC levels in MDS-L-TET2KD cells expressing indicated TET2-CD constructs were determined by dot blot (E) or ELISA (F). Methylene blue staining serves as a loading control (E right panel). (G) CFC assay of MDS-L-TET2KD cells transduced with indicated TET2-CD constructs. (H) Percentage of human CD45+ GFP+ cells in BM of NSGS mice at 4 weeks post-BMT. Mice were transplanted with MDS-L-TET2KD or MDS-L-TET2KD transduced with indicated TET2-CD constructs. (I-J) 5hmC levels in MDS-L cells transduced with shSIRT1 #1, shSIRT1 #2 or shCtrl were determined by dot blot (I) or ELISA (J). (K-L) 5hmC levels in MOCK, SIRT1 OE, or SIRT1 H363Y MDS-L cells, as determined by dot blot (K) or ELISA (L). (M) MDS-L-TET2KD cells expressing WT or 3KR TET2-CD were further transduced with shSIRT1 #1 or shCtrl. 5hmC levels were determined by ELISA. (N) Indicated MDS-L- TET2KD cells were transduced with MOCK or WT SIRT1 (SIRT1 OE) followed by a CFC assay. Significance: *p < 0.05, **p < 0.01, ***p<0.001, compared with controls. Results shown represent mean ± SEM. Triplicate determinations were made for each experimental point. Results are representative of 3 independent experiments. (See also Figure S3, Table S3.)
Figure 4
Figure 4. Identification of SIRT1/TET2 axis target genes in MDS cells.
(A) A summary of relative hMeDIP-seq read densities of all genes in SIRT1 OE or MOCK MDS-L cells, displayed as peak density (normalized to Input) within gene bodies and 5kb upstream or downstream of genes. TSS: transcription start site; TTS: transcription termination site. Results are average of two independent replicates. (B) Shown are genomic locations of 1455 hyper-hydroxymethylated (Hyper) peaks (FC>3, p<0.05). (C) Venn diagram of overlapping genes commonly downregulated following SIRT1 KD or TET2 KD in MDS-L cells, based on microarray analysis. See Table S5 for a list of genes. (D) Venn diagram showing overlap of genes associated with hyper-hydroxymethylated peaks (“GREAT” genes) from GREAT analysis and common downregulated genes. See Table S5 for a list of 141 genes. (E) Heatmap shows expression of the top 50 overlapping genes from (D). (F) Target gene expression in SIRT1 OE, SIRT1 H363Y and MOCK transduced MDS-L cells. Gene expression levels were normalized to MOCK. (G) Representative UCSC tracks showing a specific hyper-hydroxymethylated peak associated with CREBRF locus. Tracks show hMeDIP-seq enrichment data from biological replicates of MOCK and SIRT1 OE MDS-L cells. (H) hMeDIP-qPCR analysis of specific 5hmC enrichment in indicated region shown in (G) using SIRT1 OE vs MOCK MDS-L cells. Bars represent mean enrichment over input. (I) Five indicated genes were validated in 3KR versus WT TET2-CD- overexpressing MDS-L-TET2KD cells. Significance: *p < 0.05, **p < 0.01, ***p<0.001, compared with controls. Results shown represent mean ± SEM. Triplicate determinations were made for each experimental point. Results are representative of 3 independent experiments. (See also Figure S4, Tables S4 and S5.)
Figure 5
Figure 5. SRT1720 inhibits MDS HSPCs colony formation and their engraftment in NSGS mice.
(A-D) MDS (n=3, A-C) (another 8 samples were shown in Fig.S5) or normal (n=5, D) CD34+ cells were cultured with indicated doses of SRT1720 or DMSO for 72 hours and then plated in methylcellulose progenitor culture medium for a CFC assay. Results in (A-C) are determined in triplicate. (E) Endogenous TET2 was IP’d in primary MDS MNCs upon SRT1720 or vehicle (DMSO), and Ac-K levels were evaluated by western blotting. (F) 5hmC levels in SRT1720-treated MDS CD34+CD38- cells (n=4) were determined by intracellular labeling using a 5hmC-specific antibody. The result of each sample was shown in Fig.S5K. (G) Expression of SIRT1/TET2 axis target genes in MDS CD34+ cells treated with SRT1720 compared with vehicle (DMSO) (n=3). Gene expression levels were normalized to vehicle group. (H) MDS-L- TET2KD cells expressing TET2-CD WT or the 3KQ construct were further treated with SRT1720 or vehicle (DMSO), followed by a CFC assay. (I) MDS CD34+ cells treated ex-vivo with SRT1720 were injected into sub-lethally irradiated NSGS mice. Human engraftment was analyzed 12 weeks post-BMT (J) Representative CD45 and CD33 expression in MDS specimen #19. (K) Percentage of human CD45+ cells in BM of NSGS mice injected with SRT1720- or vehicle-treated MDS cells. (L-M) Percentage of human CD34+CD38- cells in BM of NSGS mice injected with indicated MDS cells. Representative FACS profile is shown in (L). (N) Percentage of indicated subsets within engrafted human cells in BM of NSGS mice injected with SRT1720- or vehicle-treated MDS cells. (O) MDS-L cells were injected into sub-lethally irradiated NSGS mice. Following confirmation of engraftment at 2 weeks, mice underwent oral gavage injection of SRT1720 or vehicle for 2 more weeks (n=6 each group). Human engraftment was analyzed. (P-R) Percentage of human CD45+ cells in BM (P) and PB (Q), number of human CD45+ cells in BM (R) of NSGS mice after treatment. (S) Survival of MDS-L cells xenografted NSGS mice after administration with SRT1720 or vehicle. Significance: *p < 0.05, **p < 0.01, ***p<0.001, compared with controls. Results shown in (D and G) represent mean ± SEM of separated independent experiments. “n” represents the number of samples or animals used. (See also Figure S5, Tables S1 and S6)
Figure 6
Figure 6. SRT1720 treatment reverses dysplastic phenotypes in a murine MDS model.
(A) BM cells were harvested from pooled 3 primary NHD13 mice that developed MDS. BM MNCs plus WT supporting BM cells were transplanted into sub-lethal irradiated congenic recipients expressing CD45.1. 120 days later, recipients showed abnormal CBCs were treated for 12 weeks with SRT1720 or vehicle (n=6 per group). BM and PB were analyzed. (B-D) CBC (B) and BM dysplasia percentage (C) in NHD13 primary transplants were analyzed after 12 weeks of SRT1720 or vehicle treatment. Representative picture of dysplastic BM cells stained with Wright Giemsa are shown in (D). Green arrow, dysplastic cell; red arrow, blast cell. Scale bar, 10 μm. (E-F) Percentage of CD45.2+ cells in PB (E) and BM (F) of primary transplants after 12 weeks of indicated treatment. (G) CD45.2 chimerism in LSKs and other progenitor populations in BM of primary recipients after 12 weeks of indicated treatment. (H-I) Representative FACS profiles for cell cycle analysis of LK and LSK cells in BM of NHD13 transgenic animals after 4 weeks of indicated treatment (n=6 per group). Cumulative results are shown in (I). (J-L) Percentage of indicated HSPCs (J, K) and mature (L) populations in BM of NHD13 transgenic animals after 4 weeks of indicated treatment. Representative FACS profiles for LK and LSK cells are shown in (J). (M-N) Percentage of CD45.2+ cells in PB (M) and BM (N) of secondary recipients (n=6 per group) transplanted with CD45.2+ BMNCs from SRT1720- or vehicle-treated mice. (O) Shown is a breeding scheme for generating the NHD13/Tet2 KO animals (left). Lin- BM cells from NHD13+Tet2+/−, NHD13+Tet2+/+ and NHD13+Tet2−/− mice were cultured with SRT1720 or vehicle (DMSO) for 72 hours and then plated for a CFC assay (right). Significance: *p < 0.05, **p < 0.01, ***p<0.001, compared with controls. Results shown in (O right) represent mean ± SEM of 3 independent experiments. “n” represents the number of animals used. (See also Figure S6)
Figure 7
Figure 7. Differential SIRT1 function in MDS versus FLT3-ITD+ AML
MDS HSPCs express lower SIRT1 levels than normal counterparts due to a miR-9- and miR-34a-mediated translational block. Decreased SIRT1 deacetylase activity promotes TET2 hyperacetylation without altering total TET2 protein levels. TET2 acetylation decreases TET2 DNA binding capacity, reducing DNA demethylation and TET2 target gene expression, outcomes that allow self-renewal and maintenance of MDS HSPCs. Conversely, low levels of endogenous SIRT1 or experimental SIRT1 KD modestly increase p53 acetylation without changing p53 activity. In FLT3-ITD+ AML HSPCs, SIRT1 protein expression is selectively enhanced through FLT3- ITD/MYC/USP22-mediated increases in SIRT1 protein stability. Such SIRT1 overexpression is required to inhibit p53 activity by deacetylation, allowing self-renewal and maintenance of AML cells under FLT3-ITD-induced oncogenic stress. However, FLT3-ITD expression directly represses TET2 activity transcriptionally and by promoting TET2 protein nuclear export. Such negative regulation outweighs any potential SIRT1 deacetylase-mediated TET2 activation effect, resulting in enhanced maintenance of FLT3-ITD+ AML HSPCs (see also Figure S7).

Comment in

Similar articles

Cited by

References

    1. Agathocleous M, Meacham CE, Burgess RJ, Piskounova E, Zhao Z, Crane GM, Cowin BL, Bruner E, Murphy MM, Chen W, et al. (2017). Ascorbate regulates haematopoietic stem cell function and leukaemogenesis. Nature. - PMC - PubMed
    1. Arioka Y, Watanabe A, Saito K, and Yamada Y (2012). Activation-induced cytidine deaminase alters the subcellular localization of Tet family proteins. PloS one 7, e45031. - PMC - PubMed
    1. Aslanyan MG, Kroeze LI, Langemeijer SM, Koorenhof-Scheele TN, Massop M, van Hoogen P, Stevens-Linders E, van de Locht LT, Tonnissen E, van der Heijden A, et al. (2014). Clinical and biological impact of TET2 mutations and expression in younger adult AML patients treated within the EOrTc/GIMEMA AML-12 clinical trial. Annals of hematology 93, 1401–1412. - PubMed
    1. Baksi A, Kraydashenko O, Zalevkaya A, Stets R, Elliott P, Haddad J, Hoffmann E, Vlasuk GP, and Jacobson EW (2014). A phase II, randomized, placebo-controlled, doubleblind, multi-dose study of SRT2104, a SIRT1 activator, in subjects with type 2 diabetes. British journal of clinical pharmacology 78, 69–77. - PMC - PubMed
    1. Brooks CL, and Gu W (2009). How does SIRT1 affect metabolism, senescence and cancer? Nature reviews Cancer 9, 123–128. - PMC - PubMed

Publication types