. 2018 Sep 10;46(5):651-667.e10.
doi: 10.1016/j.devcel.2018.07.025. Epub 2018 Aug 23.

A Comprehensive Roadmap of Murine Spermatogenesis Defined by Single-Cell RNA-Seq

Affiliations

A Comprehensive Roadmap of Murine Spermatogenesis Defined by Single-Cell RNA-Seq

Christopher Daniel Green et al. Dev Cell. .

Abstract

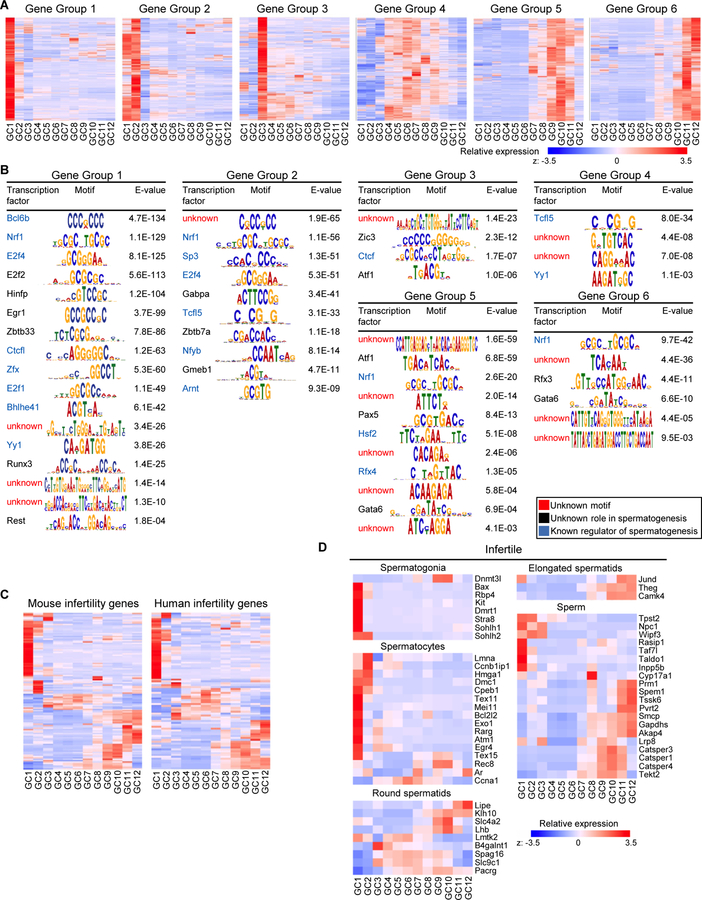
Spermatogenesis requires intricate interactions between the germline and somatic cells. Within a given cross section of a seminiferous tubule, multiple germ and somatic cell types co-occur. This cellular heterogeneity has made it difficult to profile distinct cell types at different stages of development. To address this challenge, we collected single-cell RNA sequencing data from ∼35,000 cells from the adult mouse testis and identified all known germ and somatic cells, as well as two unexpected somatic cell types. Our analysis revealed a continuous developmental trajectory of germ cells from spermatogonia to spermatids and identified candidate transcriptional regulators at several transition points during differentiation. Focused analyses delineated four subtypes of spermatogonia and nine subtypes of Sertoli cells; the latter linked to histologically defined developmental stages over the seminiferous epithelial cycle. Overall, this high-resolution cellular atlas represents a community resource and foundation of knowledge to study germ cell development and in vivo gametogenesis.

Keywords: germ cell developmental trajectory; germ cell differentiation; heterogeneity; single-cell RNA-seq; spermatogenesis; spermatogonial stem cell; testis niche.


Conflict of interest statement

Declaration of interests

The authors have no competing interests.

Figures

Figure 1.
Figure 1.. Overview of major cell types and cellular attributes inferred from single-cell RNA-seq analyses of the mouse testis.
(A) Schematic overview of data collection and iterative clustering approach. (B) Cellular heterogeneity at the highest levels. Left: principal component analysis of all ~35K cells post-QC reveals 5 major clusters, corresponding to four germ cell and one somatic cell cluster. Right: focused re-clustering of the 5,081 somatic cells identifies seven cell types: macrophages, endothelial, myoid, Leydig, Sertoli, innate lymphoid type II cells, and a previously unexpected mesenchymal cell type (“unknown”). (C) Marker genes and their top 5 gene ontologies, highlighting salient biological functions of the major cell types. Note – in the heatmap each marker gene is standardized over the 11 cluster centroids and ordered by cell type. (D) Distribution profiles of per-cell attributes compared across the 11 cell types. From left to right: %Mito, percent of mitochondria transcripts in the overall transcriptome; %ChrX and %ChrY, percent of X and Y chromosome transcripts, respectively; nGene, total number of detected genes in a given cell; nUMI, total number of Unique Molecular Identifiers (UMI) in a given cell, a.k.a the “cell size factor”; Gini Index, a measure of gene expression inequality in each cell using either all ~35K genes expressed in at least one cell (left) or only the detected genes (with non-zero counts) for that cell (right).
Figure 2.
Figure 2.. Adult germ cell development exhibits both discrete states and continuous developmental transitions.
(A) Principal component plot of 20,646 germ cells with >1,000 detected genes, colored by assignment to 12 clusters determined by unbiased clustering. (B) Pairwise rank correlation matrix among the 12 cluster centroids, showing that Clusters GC1–3 are relatively isolated whereas the other 9 GC clusters form a gradual series of transitions. (C) Biological annotation of the 12 germ cell clusters using genes of known, stage-specific expression. The seven markers in the top row suggest that cells in GC1 correspond to spermatogonia (SPG) – comprised of undifferentiated and differentiating spermatogonia (see Figure 4 for zoomed in clustering of spermatogonia). GC2–3 likely contain rare cells transitioning into meiosis. According to the 12 markers shown in the lower left panel, GC4–8 correspond to spermatocyte (SCytes). Whereas genes in the right panel suggest that cells in GC9–12 correspond to round spermatids (Stids, Clusters GC9–11) and elongated spermatids (ES, Cluster GC12). Major biological transitions are highlighted in green.
Figure 3.
Figure 3.. Gene expression dynamics along the germ cell differentiation trajectory.
(A) Unsupervised K-means clustering (k=6) of 8,583 highly variable genes across the 12 germ cell cluster centroids yields six groups of genes with distinct expression patterns. From left to right are six heatmaps of scaled expression levels across the 12 centroids, showing wave-like progression of gene expression from Group 1 genes, which are highly expressed in spermatogonia (germ cell cluster GC1), to Group 6 genes, highly expressed in elongated spermatids (germ cell cluster GC12). (B) Transcription factor motifs significantly enriched (E-value < 0.01) within +/−1kb of the transcriptional start site of the six groups of genes. (C) Gene expression heatmaps of 187 mouse male-infertility genes (left) and 234 human infertility genes (right) over the 12 germ cell clusters, highlighting a significant proportion of mammalian infertility genes have peak expression in spermatogonia. (D) Gene expression heatmaps of mouse infertility genes grouped by the five known stages of germ cell arrest, showing that genes causing arrest in a particular stage tend to be expressed at high levels in the same or an earlier stage.
Figure 4.
Figure 4.. Heterogeneity among spermatogonia cells supports 4 recognized subtypes: SPG1-SPG4.
(A) Focused re-clustering of 2,484 spermatogonia cells with >1,000 UMIs reveals 4 biological subtypes, as shown in the t-SNE plot. (B) Heatmap of differentially expressed marker genes, obtained by comparing each subtype against the other three (p < 0.01; fold change > 1.5). (C) Per-cell expression level of known or novel markers of the four spermatogonia states visualized in t-SNE space. (D) Summary schematic depicting the position of spermatogonia subtypes across stages of the mouse seminiferous epithelial cycle. Illustration is modified from (Ahmed EA and de Rooij DG, 2009; Meistrich ML1 and Hess RA, 2013).
Figure 5.
Figure 5.. Identification of known and new somatic cell types in the testis.
(A) Focused re-clustering of 5,081 somatic cells revealed seven distinct cell types as shown in t-SNE space. Note that the relative cell number proportions illustrated in TSNE plots is not representative of in vivo proportions, since many of the somatic populations required genetic or molecular enrichment experiments prior to Drop-seq analysis. (B) Cell-type specific expression of selected maker genes shown in t-SNE space. (C) Identification of resident ILCII population in the testis using flow cytometry. TH2 are designated as CD3+/CD4+/CD8 and ILCII cells are CD3/CD8/CD4. (D) Further validation of the ILCII population can be achieved using known cell surface or intracellular markers (IL7R, GATA3, IL-13, and IL-4). (E) Localization of the Tcf21+ mesenchymal cell population in the testis by genetic labeling using Tcf21-creERT2; tdTomato mice. White arrowheads mark Tcf21+ cells surrounding seminiferous tubules. (F) Validation of Tcf21 and Col1a1 mRNA expression in Sca1+ cells by real time qRT-PCR. The Sca1+ cells are depleted of Leydig cells markers (Hsd3b1 and Cyp17a1), and myoid cell markers (Myh11 and Acta2). Data represent average ± SD.
Figure 6.
Figure 6.. Functional subtypes of Sertoli cells map to spatially defined seminiferous tubule stages.
(A) Schematic illustrating Sertoli cell heterogeneity across the 12 stages of the mouse seminiferous epithelial cycle. (B) Unbiased clustering of Sertoli cells reveals four major functional types (SER-1–4), which can be further divided into nine subtypes (named with a letter suffix, e.g., SER-2A/B for the two subtypes obtained from SER-2). (C) Comparison of the nine transcriptome-based Sertoli subtypes with four stage-specific Sertoli cell enriched marker gene lists identified by microarrays from tubule segments (Hasegawa and Saga, 2012; Wright et al., 2003). Specifically, we calculated the relative fraction of Stages I-III, IV-VI, VII-VIII, or IX-XII genes across the 9 Sertoli cell subtypes. This fraction is calculated for every cell, then averaged in each of the nine molecular clusters, forming the 9-by-4 matrix. (D) Heatmap of expression levels for the five probes designed for smHCR across 9 Sertoli subtype centroids. The values displayed are natural log-transformed cluster centroid average expression values for each gene. The marker probes chosen for smHCR enrich in multiple Sertoli cell subtypes and aim to examine whether the Sertoli cell subtypes derived from a major cluster do or do not colocalize in situ. (E) smHCR reveals stage-specific expression of five Sertoli cell marker genes. For each row of imaging panels, left panel shows seminiferous tubule staging determined by the pattern of acrosome staining with Lectin PNA; second to left panel shows the combined RNA transcripts by smHCR; right five panels show the isolated signal from each probe. Arrowheads indicate Sertoli cell nuclei. Dashed lines represent tubule borders.
Figure 7.
Figure 7.. Overview of the comprehensive cellular atlas of mouse spermatogenesis and testis niche.
Summary schematic of the major findings from the analysis of >35K single-cell RNA-seq profiles. On the Left, our study demonstrates for the first time the full developmental trajectory of germ cell development from spermatogonia to elongated spermatids. The transition from spermatogonia to spermatocytes involves discrete developmental transitions, whereas, the progression from spermatocytes to elongating spermatids is continuous with no stable intermediate states. Focused re-clustering of spermatogonia further define transitions between undifferentiated and differentiated stem cells. On the Right, we identify all major somatic cell types within the testis, as well as two previously uncharacterized populations (innate lymphoid type 2 cells and an unknown mesenchymal cell type). Focused re-clustering of Sertoli cells uncovers significant heterogeneity which can be linked biologically to cycling stages of the seminiferous epithelium. Taken together, these findings represent a powerful new resource to the community for studying the cellular and molecular heterogeneity of the testis and spermatogenesis program in unprecedented resolution.

References

    1. Acharya A, Baek ST, Banfi S, Eskiocak B, and Tallquist MD (2011). Efficient inducible Cre-mediated recombination in Tcf21 cell lineages in the heart and kidney. Genesis 49, 870–877. - PMC - PubMed
    1. Aloisio GM, Nakada Y, Saatcioglu HD, Pena CG, Baker MD, Tarnawa ED, Mukherjee J, Manjunath H, Bugde A, Sengupta AL, et al. (2014). PAX7 expression defines germline stem cells in the adult testis. The Journal of clinical investigation 124, 3929–3944. - PMC - PubMed
    1. Anderson EL, Baltus AE, Roepers-Gajadien HL, Hassold TJ, de Rooij DG, van Pelt AM, and Page DC (2008). Stra8 and its inducer, retinoic acid, regulate meiotic initiation in both spermatogenesis and oogenesis in mice. Proceedings of the National Academy of Sciences of the United States of America 105, 14976–14980. - PMC - PubMed
    1. Bailey TL, Boden M, Buske FA, Frith M, Grant CE, Clementi L, Ren J, Li WW, and Noble WS (2009). MEME SUITE: tools for motif discovery and searching. Nucleic acids research 37, W202–208. - PMC - PubMed
    1. Ball RL, Fujiwara Y, Sun F, Hu J, Hibbs MA, Handel MA, and Carter GW (2016). Regulatory complexity revealed by integrated cytological and RNA-seq analyses of meiotic substages in mouse spermatocytes. BMC genomics 17, 628. - PMC - PubMed

Publication types