. 2018 Nov 6;28(5):793-800.e2.
doi: 10.1016/j.cmet.2018.07.020. Epub 2018 Aug 23.

Isotope Tracing of Human Clear Cell Renal Cell Carcinomas Demonstrates Suppressed Glucose Oxidation In Vivo

Affiliations

Isotope Tracing of Human Clear Cell Renal Cell Carcinomas Demonstrates Suppressed Glucose Oxidation In Vivo

Kevin D Courtney et al. Cell Metab. .

Abstract

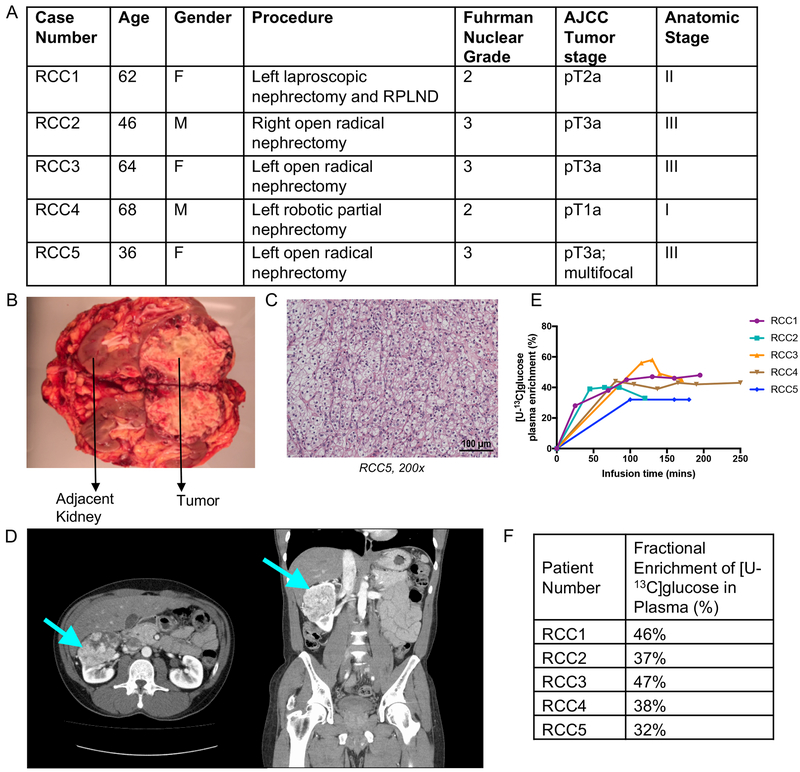
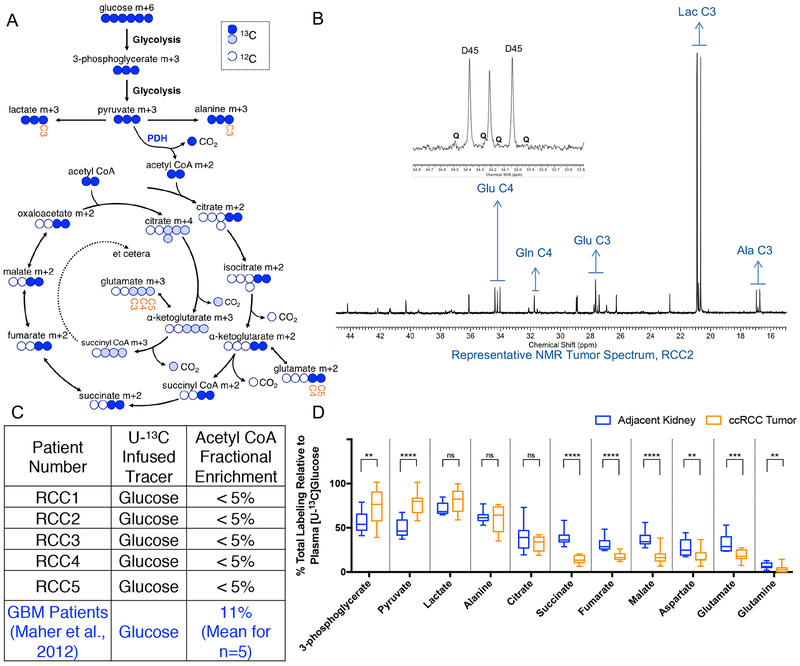
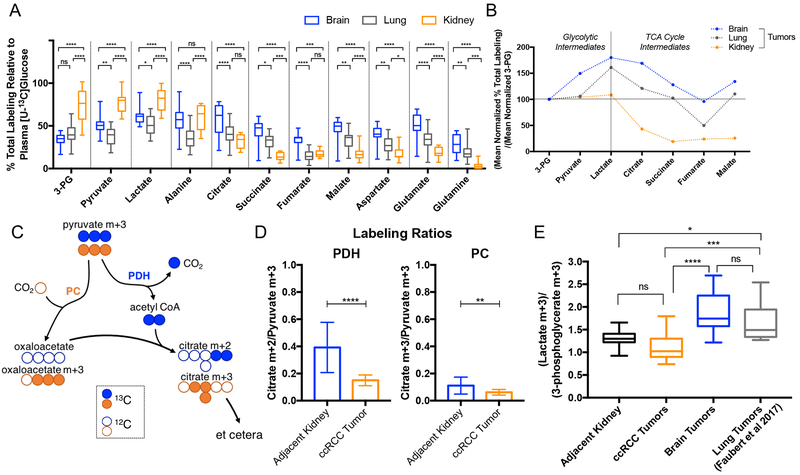
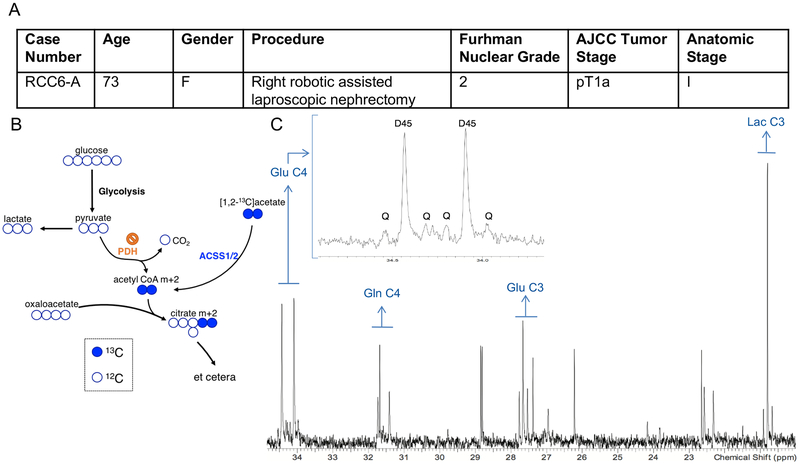
Clear cell renal cell carcinoma (ccRCC) is the most common form of human kidney cancer. Histological and molecular analyses suggest that ccRCCs have significantly altered metabolism. Recent human studies of lung cancer and intracranial malignancies demonstrated an unexpected preservation of carbohydrate oxidation in the tricarboxylic acid (TCA) cycle. To test the capacity of ccRCC to oxidize substrates in the TCA cycle, we infused 13C-labeled fuels in ccRCC patients and compared labeling patterns in tumors and adjacent kidney. After infusion with [U-13C]glucose, ccRCCs displayed enhanced glycolytic intermediate labeling, suppressed pyruvate dehydrogenase flow, and reduced TCA cycle labeling, consistent with the Warburg effect. Comparing 13C labeling among ccRCC, brain, and lung tumors revealed striking differences. Primary ccRCC tumors demonstrated the highest enrichment in glycolytic intermediates and lowest enrichment in TCA cycle intermediates. Among human tumors analyzed by intraoperative 13C infusions, ccRCC is the first to demonstrate a convincing shift toward glycolytic metabolism.

Keywords: cancer metabolism; clear cell renal cell carcinoma; human cancer; kidney cancer; mass spectrometry; nuclear magnetic resonance spectroscopy (NMR); stable isotope tracing.


Conflict of interest statement

Declaration of Interests: The authors have no competing interests to declare for this manuscript.

Figures

Figure 1:
Figure 1:. Clinical features of infused patients.
(A) Demographic and clinical characteristics of the profiled human clear cell renal cell carcinoma patients. (B) Image of resected kidney from patient RCC3. (C) Pathology section of patient RCC5 exhibiting the ccRCC hallmark of “clear cell” cytoplasm. (D) CT scan of patient RCC2 showing renal mass in left kidney, indicated by arrow. (E) Glucose infusion curves for each patient. (F) Fractional enrichment of glucose in patient blood plasma at the time of tumor resection.
Figure 2:
Figure 2:. In vivo labeling from ccRCC tumors and adjacent kidney infused with [U-13C]glucose.
(A) Schematic for metabolism of [U-13C]glucose. “Labeled” 13C carbons are colored circles and “unlabeled” 12C carbons are white circles. Labeling in the first turn of the TCA cycle are blue circles. Labeling in the second turn of the TCA cycle are light blue circles. The positional carbons notated on the NMR spectrum are labeled in the metabolites glutamate and lactate. (B) Representative 1H-decoupled 13C NMR tumor spectrum from patient RCC2. The inset is a magnification of the peaks from glutamate (Glu) at carbon 4 (C4). The number after the indicated metabolite refers to the carbon position in the metabolite. D45 refers to the doublet formed from glutamate labeled at both C4 and C5. Q refers to the quartet formed from glutamate labeled at C3, C4, and C5. Glu = Glutamate, Gln = Glutamine, Glu = Glutamate, Lac = Lactate, Ala = Alanine. (C) Fractional enrichment of labeled acetyl CoA from each patient calculated from glutamate labeling on NMR. The Acetyl CoA fractional enrichment from glioblastoma (GBM) patients published by Maher et al 2012., is shown for comparison. (D) Total labeling of indicated metabolite as analyzed by mass spectrometry and normalized to 13C Glucose enrichment in patient plasma. A full isotopologue distribution is provided in Supplemental Table 1. P values: ns = P > 0.05; * =P ≤ 0.05; ** = P ≤ 0.01; *** = P ≤ 0.001; **** = P ≤ 0.0001. Unpaired t tests were used in panel D, and the data is shown as mean ± standard deviation
Figure 3:
Figure 3:. Glucose labeling profiles of tumors from the brain, kidney, and lung.
(A) Total labeling of each metabolite normalized to 13C-Glucose enrichment in plasma. (B) Total labeling mean of metabolites indicated in panel A divided by the 3-PG total labeling mean. 3-PG means are 33.94% for brain, 40.56% for lung, 73.96% for kidney tumors. (C) Schematic illustrating labeling in citrate from [U-13C]glucose via pyruvate dehydrogenase (PDH) and pyruvate carboxylase (PC) in the first turn of the TCA cycle. (D) PDH and PC activity. Citrate m+2/pyruvate m+3 ratio can be a surrogate for PDH while the citrate m+3/pyruvate m+3 ratio can be a surrogate for PC. (E) Lactate/3-phosphoglycerate (Lactate/3-PG) ratios for adjacent kidney, ccRCC tumors, brain tumors and lung tumors. Lung tumors shown to utilize lactate had lactate/3-PG ratios above 1.5 (Faubert et al., 2017). P values: ns = P > 0.05; * =P ≤ 0.05; ** = P ≤ 0.01; *** = P ≤ 0.001; **** = P ≤ 0.0001. Statistical tests of two way ANOVA with Tukey posthoc test was used in 3A, unpaired t tests were used in 3D, and ordinary one way ANOVA was used in 3E. The data is shown as mean ± standard deviation
Figure 4:
Figure 4:. In vivo labeling of a ccRCC tumor from [1,2-13C]acetate.
(A) Demographic and clinical characteristics of a ccRCC patient infused with [1,2-13C]acetate. (B) Schematic showing how acetate infusion bypasses PDH. (C) 1H-decoupled 13C NMR spectrum from the acetate infused tumor. The inset is a magnification of the peaks from glutamate (Glu) at carbon 4 (C4). D45 refers to the doublet formed from glutamate labeled at both C4 and C5. Q refers to the quartet formed from glutamate labeled at C3, C4, and C5. The quartet forms after a turn of the TCA cycle. The number after the indicated metabolite refers to the carbon position in the metabolite. Glu C4 = Glutamate C4, Gln C4 = Glutamine C4, Glu C3 = Glutamate C3, Lac C3 = Lactate C3

Comment in

References

    1. Benita Y, Kikuchi H, Smith AD, Zhang MQ, Chung DC, and Xavier RJ (2009). An integrative genomics approach identifies Hypoxia Inducible Factor-1 (HIF-1)-target genes that form the core response to hypoxia. Nucleic Acids Res 37, 4587–4602. - PMC - PubMed
    1. Cancer Genome Atlas Research, N. (2013). Comprehensive molecular characterization of clear cell renal cell carcinoma. Nature 499, 43–49. - PMC - PubMed
    1. Comerford SA, Huang Z, Du X, Wang Y, Cai L, Witkiewicz AK, Walters H, Tantawy MN, Fu A, Manning HC, et al. (2014). Acetate dependence of tumors. Cell 159, 1591–1602. - PMC - PubMed
    1. Comte B, Vincent G, Bouchard B, and Rosiers CD (1997). Probing the Origin of Acetyl-CoA and Oxaloacetate Entering the Citric Acid Cycle from the13C Labeling of Citrate Released by Perfused Rat Hearts. Journal of Biological Chemistry 272, 26117–26124. - PubMed
    1. Fan TW, Lane AN, Higashi RM, Farag MA, Gao H, Bousamra M, and Miller DM (2009). Altered regulation of metabolic pathways in human lung cancer discerned by (13)C stable isotope-resolved metabolomics (SIRM). Mol Cancer 8, 41. - PMC - PubMed

Publication types