. 2018 Sep 11;11(3):711-726.
doi: 10.1016/j.stemcr.2018.07.015. Epub 2018 Aug 23.

Chemical Screening Identifies Enhancers of Mutant Oligodendrocyte Survival and Unmasks a Distinct Pathological Phase in Pelizaeus-Merzbacher Disease

Affiliations

Chemical Screening Identifies Enhancers of Mutant Oligodendrocyte Survival and Unmasks a Distinct Pathological Phase in Pelizaeus-Merzbacher Disease

Matthew S Elitt et al. Stem Cell Reports. .

Abstract

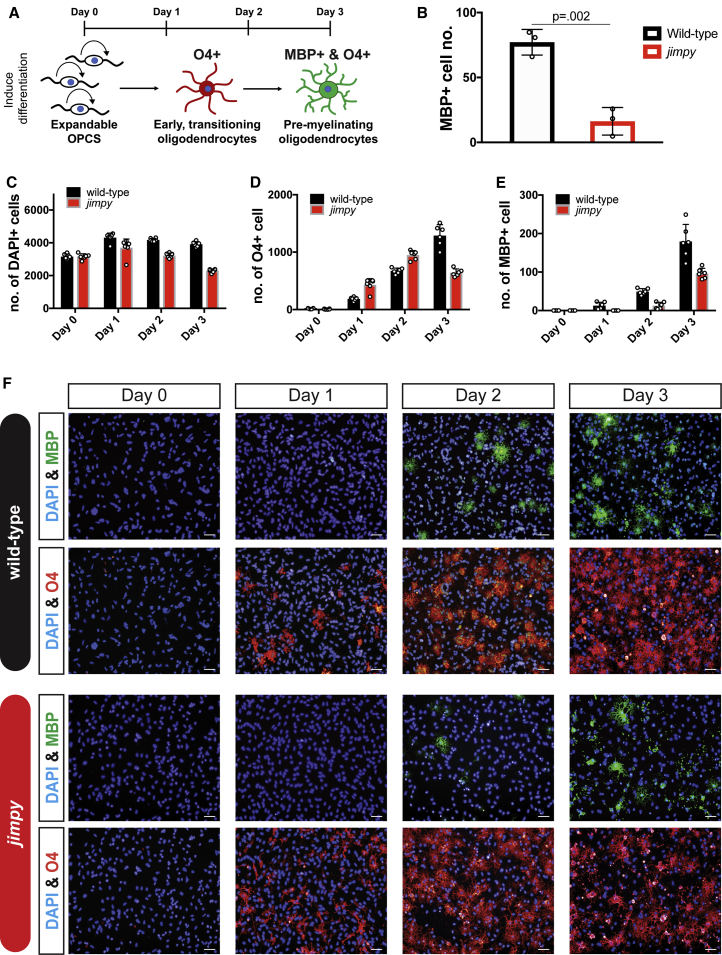
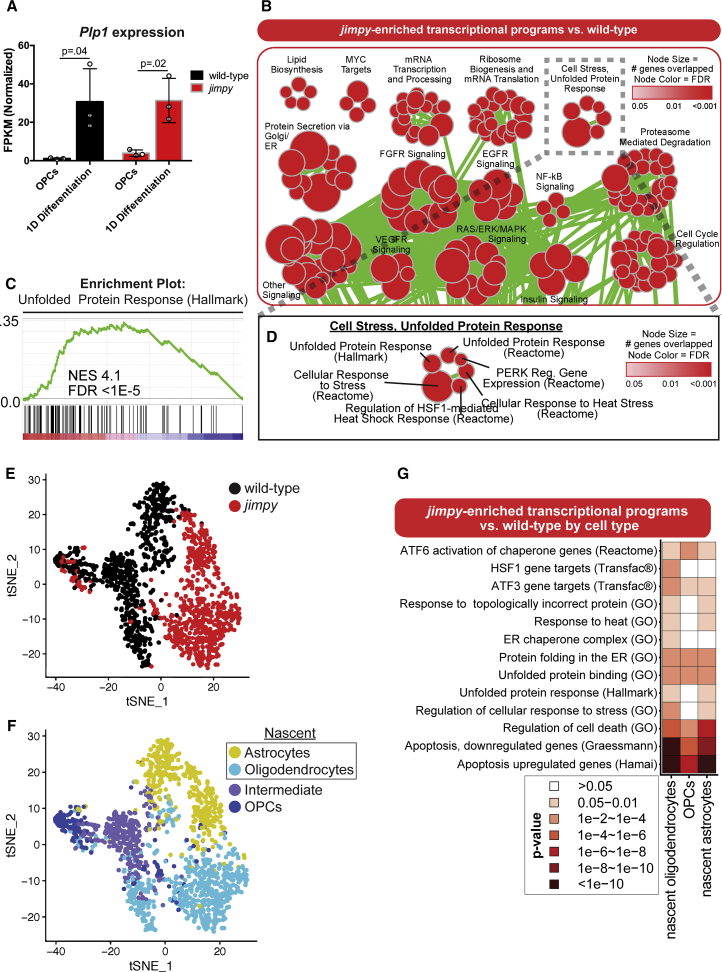
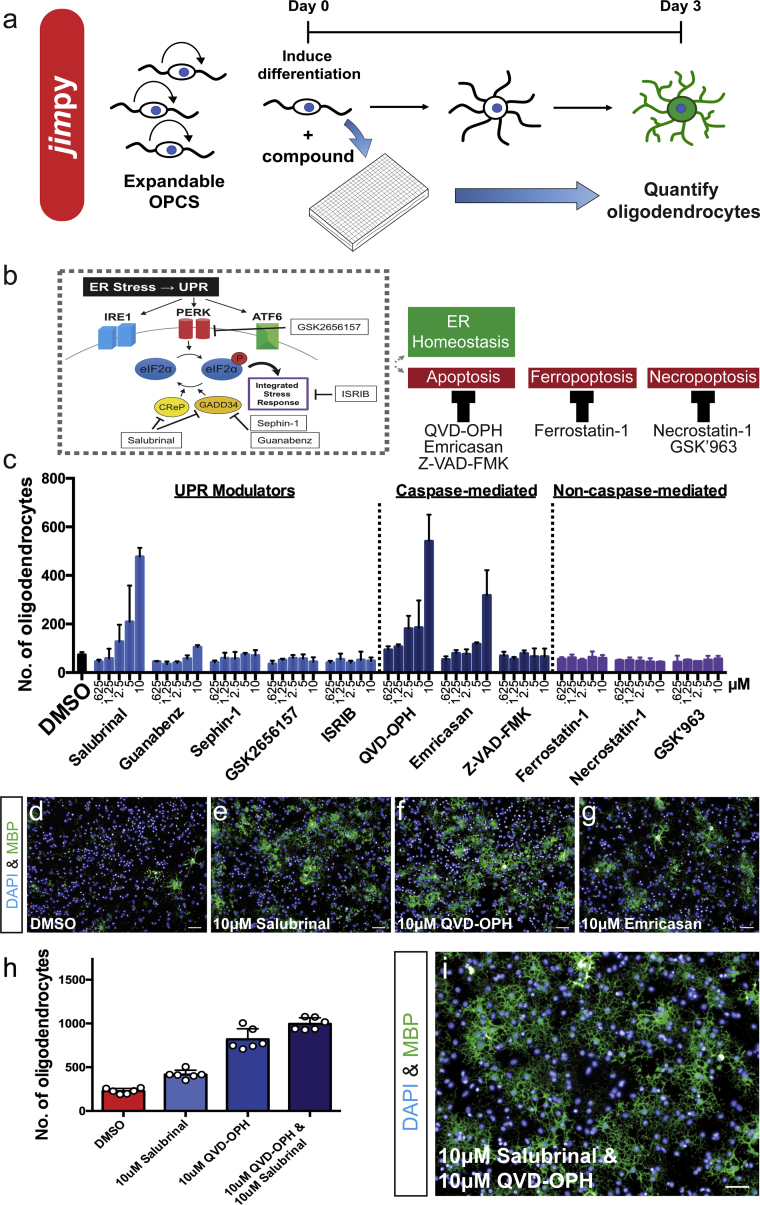
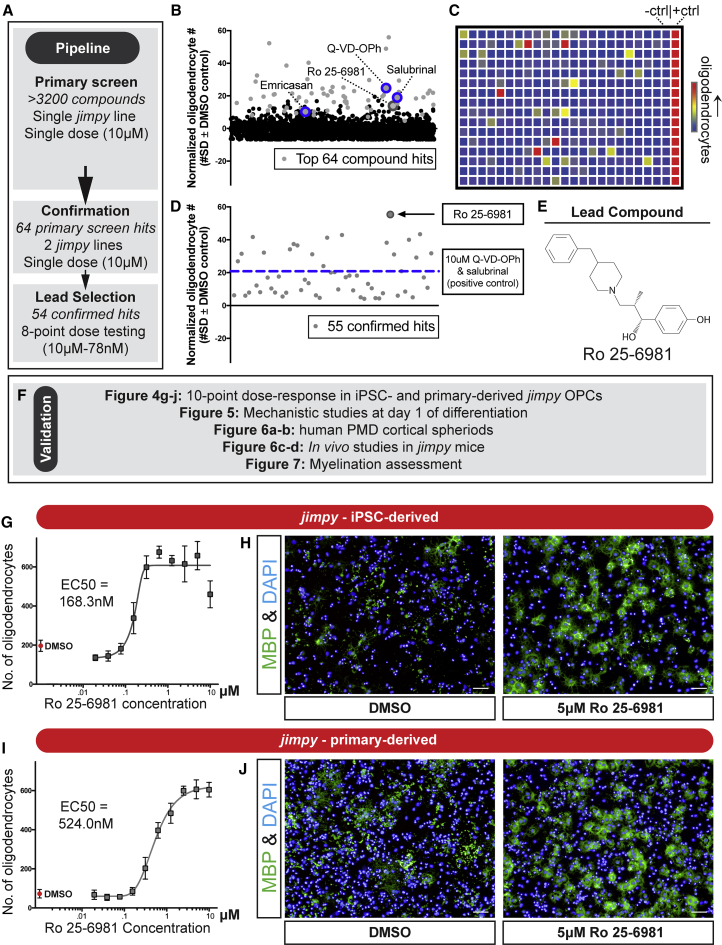
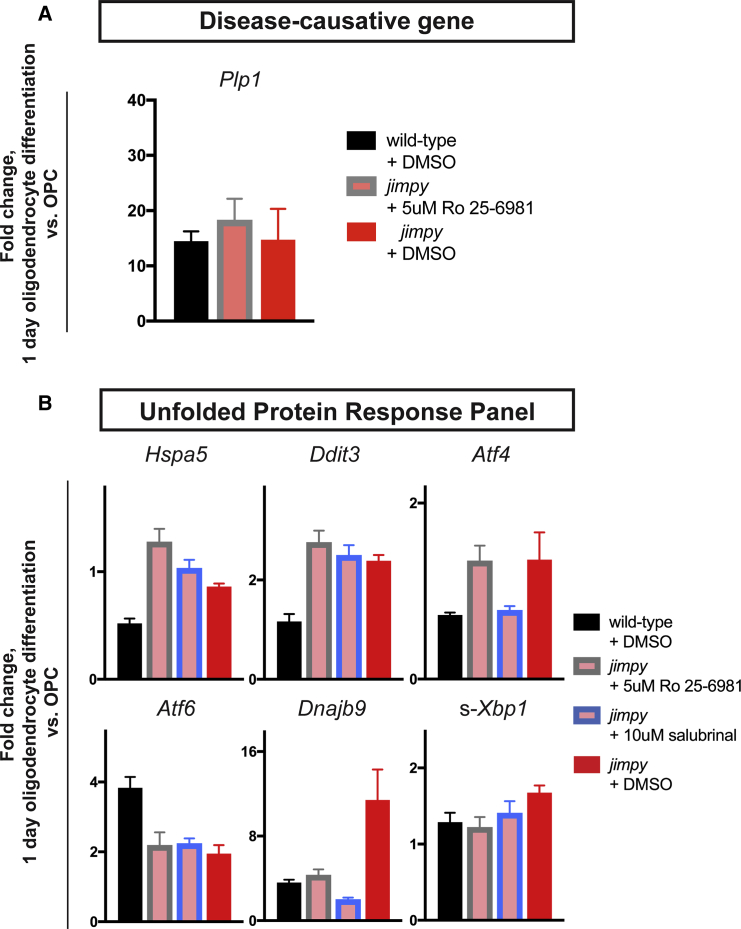
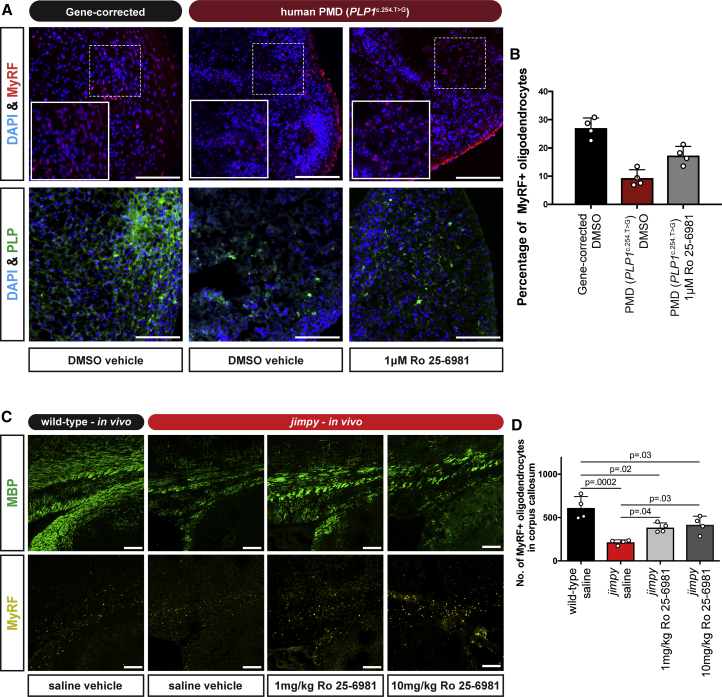
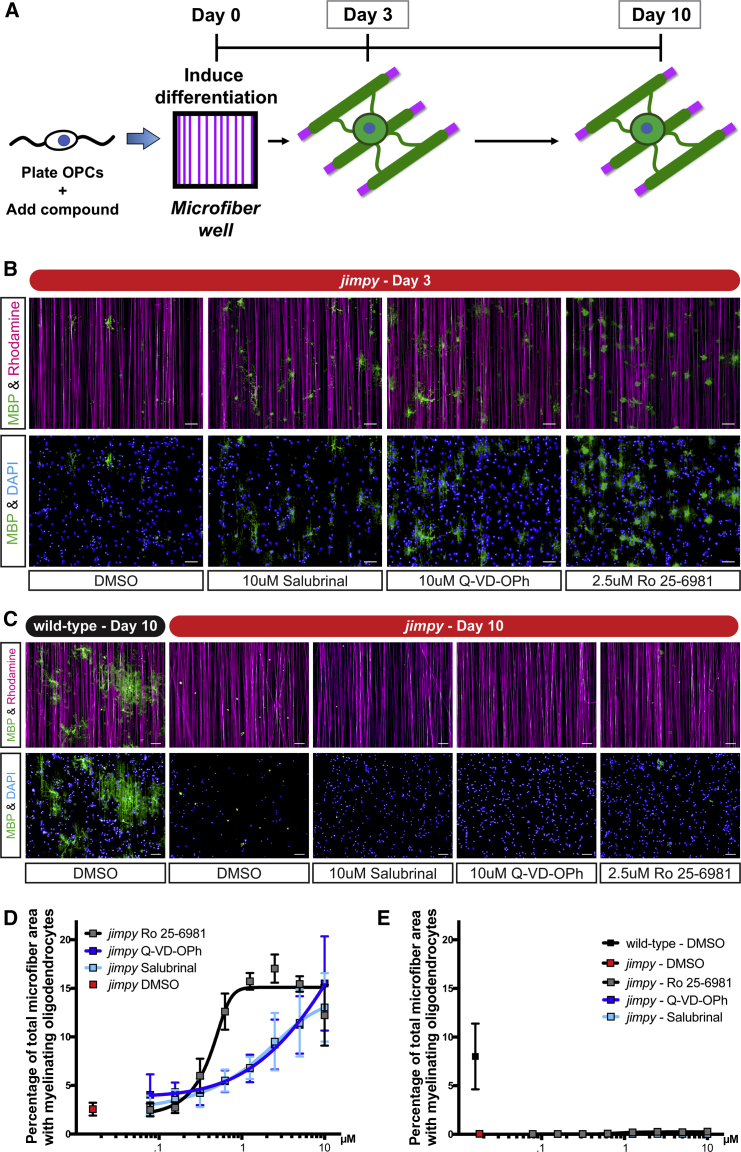
Pelizaeus-Merzbacher disease (PMD) is a fatal X-linked disorder caused by loss of myelinating oligodendrocytes and consequent hypomyelination. The underlying cellular and molecular dysfunctions are not fully defined, but therapeutic enhancement of oligodendrocyte survival could restore functional myelination in patients. Here we generated pure, scalable quantities of induced pluripotent stem cell-derived oligodendrocyte progenitor cells (OPCs) from a severe mouse model of PMD, Plp1jimpy. Temporal phenotypic and transcriptomic studies defined an early pathological window characterized by endoplasmic reticulum (ER) stress and cell death as OPCs exit their progenitor state. High-throughput phenotypic screening identified a compound, Ro 25-6981, which modulates the ER stress response and rescues mutant oligodendrocyte survival in jimpy, in vitro and in vivo, and in human PMD oligocortical spheroids. Surprisingly, increasing oligodendrocyte survival did not restore subsequent myelination, revealing a second pathological phase. Collectively, our work shows that PMD oligodendrocyte loss can be rescued pharmacologically and defines a need for multifactorial intervention to restore myelination.

Keywords: PLP1; Pelizaeus-Merzbacher disease; endoplasmic reticulum stress; high-throughput screening; iPSC disease modeling; myelin; oligodendrocyte progenitor cells; oligodendrocytes; proteolipid protein 1; rare disease.


Figures

Figure 1
Figure 1
Temporal Dissection of Cellular Phenotypes Reveals Cell Death Just as Jimpy OPCs Commit to an Oligodendrocyte Fate (A) Schematic summary of the experimental assay. (B) Quantification of wild-type and jimpy MBP+ oligodendrocytes after oligodendrocyte differentiation. n = 3 distinct cell lines per genotype, with each replicate value (comprising a mean of n = 4 replicate wells per cell line) represented by a white circle. p values calculated using a two-way, unpaired t test between genotypes. (C–E) Wild-type and jimpy oligodendrocyte differentiation time-course data showing quantification of total (C) DAPI+ cells, (D) O4+ cells, and (E) MBP+ oligodendrocytes. n = 6 replicate wells per genotype, with each replicate value represented by a white circle. (F) Representative immunocytochemistry images from time course showing MBP+ oligodendrocytes (green), O4+ cells (red), and total cells (DAPI, blue). Scale bars, 50 μm. Error bars represent mean ± SD. See also Figures S1 and S2, and Video S1.
Figure 2
Figure 2
RNA-Seq and scRNA-Seq Reveal Transcriptome Signatures of ER Stress and Cell Death in Early, Differentiating Jimpy Oligodendrocytes (A) Plp1 mRNA expression in wild-type and jimpy OPCs and in cultures during oligodendrocyte (at day 1). Error bars represent mean ± SD. n = 3 sequenced cell lines per genotype, with each replicate represented by a white circle. p values calculated using a two-way, unpaired t test for each genotype. (B) Gene ontology enrichment map for RNA-seq data showing enriched pathways in jimpy after 1 day of oligodendrocyte differentiation. Node size indicates the number genes represented in the pathway. Color intensity indicates false discovery rate (FDR). Node overlap indicates shared pathway genes. n = 3 cell lines, per genotype. (C) Jimpy enrichment plots for the hallmark unfolded protein response pathway genes relative to wild-type. The upper plot (green line) details the running sum statistic of the ranked list of genes with the normalized enrichment score (NES) and FDR. The lower plot displays a gene's position in the ranked list of genes for the pathway. (D) Enlargement of the “cell stress, unfolded protein response” node group. (E and F) tSNE plots showing (E) genotype and (F) cell-type distributions. n = 1 cell line per genotype. (G) Heatmap showing pathway enrichment in jimpy cell types relative to their wild-type counterparts. Scale corresponds to p value. See also Figure S3, Tables S1, S2, and S3.
Figure 3
Figure 3
High-Throughput Chemical Screening Identifies Cellular and Molecular Modulators of Jimpy Pathology (A) Chemical screening schematic. (B) Chemical-targeting of ER stress-related sequelae by UPR modulation or inhibition of caspase-mediated apoptosis. (C) Quantification of MBP+ oligodendrocytes per compound dose (five doses, 10 μM to 625 nM) after 3-day oligodendrocyte differentiation of iPSC-derived jimpy OPCs. n = 3 replicate wells per dose, per compound. (D–G) Representative immunocytochemistry images after oligodendrocyte differentiation of jimpy OPCs treated with (D) DMSO vehicle, (E) 10 μM salubrinal, (F) 10 μM Q-VD-OPh, and (G) 10 μM emricasan, showing MBP+ oligodendrocytes (green) and total DAPI+ cells (blue). (H) Quantification of MBP+ jimpy oligodendrocytes for DMSO vehicle (red), 10 μM salubrinal (light blue), 10 μM Q-VD-OPh (blue), and 10 μM salubrinal and 10 μM Q-VD-OPh (dark blue). n = 6 replicate wells per treatment, with each replicate value represented by a white circle. (I) Representative immunocytochemistry images after oligodendrocyte differentiation of jimpy OPCs treated with 10 μM salubrinal and 10 μM Q-VD-OPh, showing MBP+ oligodendrocytes (green) and total DAPI+ cells (blue). Error bars represent mean ± SD. Scale bars, 50 μm. See also Figure S4.
Figure 4
Figure 4
High-Throughput Chemical Screening Identifies Cellular and Molecular Modulators of Jimpy Pathology (A) Overview of screening pipeline with filtering steps for lead compound selection. (B) Plot of primary screen results showing top hit (gray circles) and non-hit (black circles) compounds listed by alphabetical order with their corresponding SD divergence from DMSO vehicle on the MBP+ jimpy oligodendrocyte metric after 3-day oligodendrocyte differentiation. n = 1 well per tested compound. (C) Heatmap of a representative primary screen plate depicting high (red) or low (blue) quantified MBP+ jimpy oligodendrocytes for each compound, as well as negative and positive controls. (D) Plot of confirmed hits (gray circles) listed in alphabetical order showing their maximal SD divergence from DMSO vehicle for MBP+ jimpy oligodendrocytes in an 8-point (10 μM to 78 nM) dose response. n = 1 well per compound dose. n = 16 replicate wells for the positive and negative control samples. (E) Chemical structure of lead compound Ro 25–6981. (F) Overview of validation pipeline for lead compound Ro 25–6981. (G and I) Quantification of MBP+ jimpy oligodendrocytes after differentiation of (G) iPSC-derived and (I) cerebral cortical-derived OPCs, treated with Ro 25–6981 (10-point dose response) or DMSO vehicle. Individual points represent mean ± SD. n = 3 replicate wells for each dose, n = 16 replicate wells for the DMSO vehicle control. (H and J) Representative immunocytochemistry images after oligodendrocyte differentiation of (H) iPSC-derived or (J) cerebral cortical-derived OPCs treated with DMSO vehicle or 5 μM Ro 25–6981 showing MBP+ oligodendrocytes (green) and total DAPI+ cells (blue). Scale bars, 50 μm. See also Figure S5, Tables S4, and S5.
Figure 5
Figure 5
Ro 25–6981 Mechanistic Studies Reveal UPR Modulation in Jimpy (A) qRT-PCR of Plp1 for wild-type and jimpy at day 1 of oligodendrocyte differentiation with indicated treatment. Vehicle-treated controls same as Figure S6D. For Atf6 n = 3 technical replicates per sample. n = 4 technical replicates per sample. (B) qRT-PCR of UPR-related panel for wild-type and jimpy at day 1 of oligodendrocyte differentiation with indicated treatment. Vehicle-treated controls same as Figure S6D. For Atf6 n = 3 technical replicates per sample. For all other probes n = 4 technical replicates per sample. Error bars represent mean ± SD. See also Figure S6 and Table S6.
Figure 6
Figure 6
Ro 25–6981 Enhances Mutant Oligodendrocyte Survival in Human Patient PMD Spheroids and in Jimpy Mice (A) Representative immunocytochemistry images of human PMD patient (PLP1c.254.T>G) and wild-type iPSC-derived oligocortical spheroids showing MyRF+ (red) and PLP+ (green) oligodendrocytes, as well as total DAPI+ cells (blue) after treatment. (B) Percentage of MyRF+ oligodendrocytes relative to total DAPI+ cells in human PMD patient (PLP1c.254.T>G) and wild-type iPSC-derived oligocortical spheroids after treatment. n = 4 independent spheroids per treatment. (C) Representative immunocytochemistry images of the medial corpus callosum of wild-type and jimpy mice after treatment showing MBP+ oligodendrocytes (green) and MyRF+ oligodendrocytes (yellow). (D) Quantification of MyRF+ oligodendrocytes within the medial corpus callosum of wild-type and jimpy mice after treatment. n = 4 injected animals per treatment. Scale bars, 100 μm. Error bars represent mean ± SD, with each replicate value indicated by a white circle. p values calculated using a one-way ANOVA with Holm-Sidak correction for multiple comparisons.
Figure 7
Figure 7
Increased Jimpy Oligodendrocyte Survival during Differentiation Unmasks a Second Pathological Phase during Myelination (A) Schematic of the in vitro myelination assay using 4-μm diameter synthetic microfiber fibers detailing the examination of myelinating oligodendrocytes at day 3 and 10. (B and C) Representative immunocytochemistry images of MBP+ myelinating oligodendrocytes (green), rhodamine+ microfibers (purple), and total DAPI+ cells (blue) at (B) day 3 and (C) day 10. Compound-treated cultures shown at their maximum effective concentration. (D and E) Quantification of percent total microfiber area overlap with MBP+ myelinating oligodendrocytes at (D) day 3 and (E) day 10 with indicated treatment and genotype. Scale bars, 50 μm. n = 3 replicate wells per compound treatment. n = 16 replicate wells per vehicle control. Error bars represent mean ± SD. See also Figure S7.

Similar articles

Cited by

References

    1. Baron W., Hoekstra D. On the biogenesis of myelin membranes: sorting, trafficking and cell polarity. FEBS Lett. 2010;584:1760–1770. - PubMed
    1. Baumann N., Pham-Dinh D. Biology of oligodendrocyte and myelin in the mammalian central nervous system. Physiol. Rev. 2001;81:871–927. - PubMed
    1. Bechler M.E., Byrne L., Ffrench-Constant C. CNS myelin sheath lengths are an intrinsic property of oligodendrocytes. Curr. Biol. 2015;25:2411–2416. - PMC - PubMed
    1. Bonkowsky J.L., Nelson C., Kingston J.L., Filloux F.M., Mundorff M.B., Srivastava R. The burden of inherited leukodystrophies in children. Neurology. 2010;75:718–725. - PMC - PubMed
    1. Boyce M., Bryant K.F., Jousse C., Long K., Harding H.P., Scheuner D., Kaufman R.J., Ma D., Coen D.M., Ron D. A selective inhibitor of eIF2alpha dephosphorylation protects cells from ER stress. Science. 2005;307:935–939. - PubMed

Publication types

MeSH terms