

Risk factors and utility of maximum carotid intima-media thickness as a surrogate marker for coronary artery stenosis
- PMID: 30147324
- PMCID: PMC6095113
- DOI: 10.2147/TCRM.S168926
Risk factors and utility of maximum carotid intima-media thickness as a surrogate marker for coronary artery stenosis
Abstract
Background: This study investigated the factors associated with coronary artery stenosis in outpatients. Furthermore, the usefulness of maximum carotid intima-media thickness (maximum-IMT) as a surrogate marker of coronary artery stenosis was evaluated.
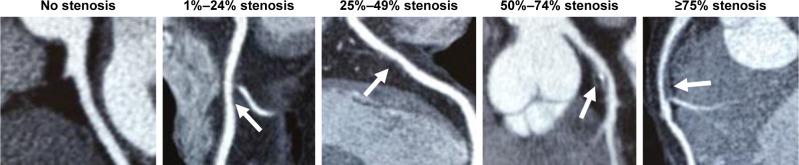
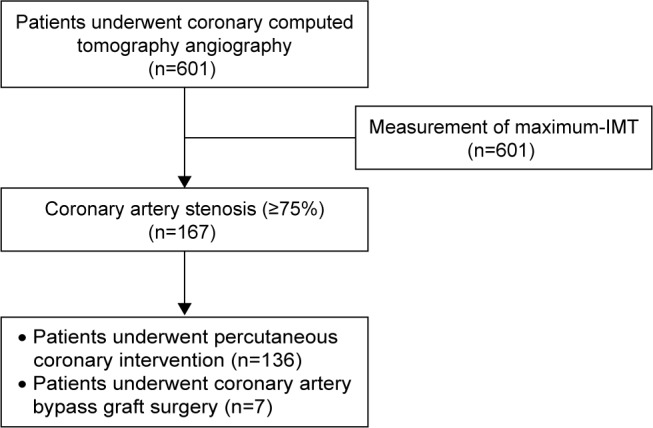
Methods: We conducted a single-center retrospective study. A total of 601 outpatients (338 males; 263 females; mean age, 69.8±10.0 years) who underwent coronary computed tomography angiography between April 2006 and March 2012 were analyzed. The associations between coronary artery stenosis (≥75%) as determined by coronary computed tomography angiography and clinical and laboratory parameters were evaluated by multivariate logistic regression. Validation of maximum-IMT as measured by ultrasonography as a surrogate marker of coronary artery stenosis was analyzed by receiver operating characteristic (ROC) curve analysis.
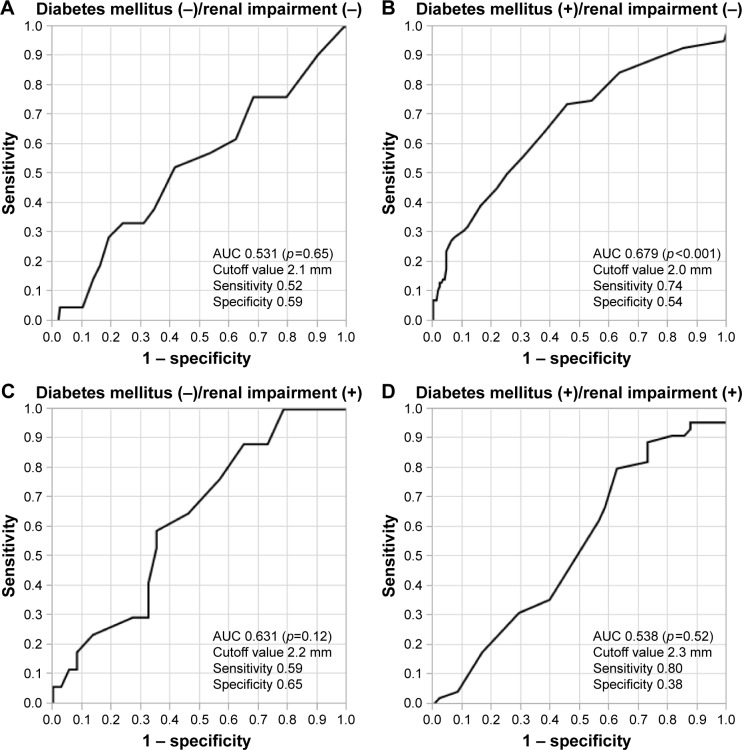
Results: The estimated glomerular filtration rate (eGFR: mL/min/1.73 m2) (odds ratio [OR] 0.985, p<0.01), diabetes mellitus (OR 1.98, p<0.05), and maximum-IMT (mm) (OR 1.76, p<0.01) were significantly associated with coronary artery stenosis (≥75%). In analysis of each group categorized by identified factors, such as renal impairment (eGFR <60 mL/min/1.73 m2) and diabetes mellitus, the ROC curve of maximum-IMT was significant in the group of patients with diabetes mellitus without renal impairment (p<0.01) (cutoff value of maximum-IMT, 2.0 mm; sensitivity, 0.74; and specificity, 0.54) but not in other groups.
Conclusion: Renal impairment, diabetes mellitus, and increased maximum-IMT may be significant risk factors of coronary artery stenosis. Maximum-IMT as measured by ultrasonography may be a useful surrogate marker for coronary artery stenosis in patients with diabetes mellitus without renal impairment but not in other patients.
Keywords: coronary artery stenosis; diabetes mellitus; maximum intima–media thickness; renal impairment.
Conflict of interest statement
Disclosure The authors report no conflicts of interest in this work.
Figures


Similar articles
-
Maximum carotid intima-media thickness improves the prediction ability of coronary artery stenosis in type 2 diabetic patients without history of coronary artery disease.Atherosclerosis. 2012 Apr;221(2):438-44. doi: 10.1016/j.atherosclerosis.2012.01.022. Epub 2012 Jan 21. Atherosclerosis. 2012. PMID: 22321873
-
Association of coronary artery stenosis with carotid atherosclerosis in asymptomatic type 2 diabetic patients.J Atheroscler Thromb. 2011;18(4):337-44. doi: 10.5551/jat.6049. Epub 2011 Jan 6. J Atheroscler Thromb. 2011. PMID: 21224524
-
Usefulness of albuminuria as predictor for coronary artery stenosis, regardless of estimated glomerular filtration rate, in patients with type 2 diabetes mellitus.Am J Cardiol. 2012 Nov 15;110(10):1434-9. doi: 10.1016/j.amjcard.2012.07.006. Epub 2012 Aug 2. Am J Cardiol. 2012. PMID: 22858190
-
Coronary artery calcium outperforms carotid artery intima-media thickness as a noninvasive index of prevalent coronary artery stenosis.Arterioscler Thromb Vasc Biol. 2005 Aug;25(8):1723-8. doi: 10.1161/01.ATV.0000173418.42264.19. Epub 2005 Jun 9. Arterioscler Thromb Vasc Biol. 2005. PMID: 15947237
-
[Intima media thickness of the carotid arteries: early pointer to arteriosclerosis and therapeutic endpoint].Ultraschall Med. 2003 Jun;24(3):162-74. doi: 10.1055/s-2003-40058. Ultraschall Med. 2003. PMID: 12817310 Review. German.
Cited by
-
Clinical utility of carotid ultrasonography: Application for the management of patients with diabetes.J Diabetes Investig. 2019 Jul;10(4):883-898. doi: 10.1111/jdi.13042. Epub 2019 Apr 15. J Diabetes Investig. 2019. PMID: 30884192 Free PMC article. Review.
References
-
- Hulten EA, Carbonaro S, Petrillo SP, Mitchell JD, Villines TC. Prognostic value of cardiac computed tomography angiography: a systematic review and meta-analysis. J Am Coll Cardiol. 2011;57(10):1237–1247. - PubMed
-
- Jiangping S, Zhe Z, Wei W, et al. Assessment of coronary artery stenosis by coronary angiography: a head-to-head comparison with pathological coronary artery anatomy. Circ Cardiovasc Interv. 2013;6(3):262–268. - PubMed
LinkOut - more resources
Full Text Sources
Other Literature Sources
Research Materials
Miscellaneous
