. 2018 Jul 25:2018:5906819.
doi: 10.1155/2018/5906819. eCollection 2018.

Transcriptional Profiling Suggests Extensive Metabolic Rewiring of Human and Mouse Macrophages during Early Interferon Alpha Responses

Affiliations

Transcriptional Profiling Suggests Extensive Metabolic Rewiring of Human and Mouse Macrophages during Early Interferon Alpha Responses

Duale Ahmed et al. Mediators Inflamm. .

Abstract

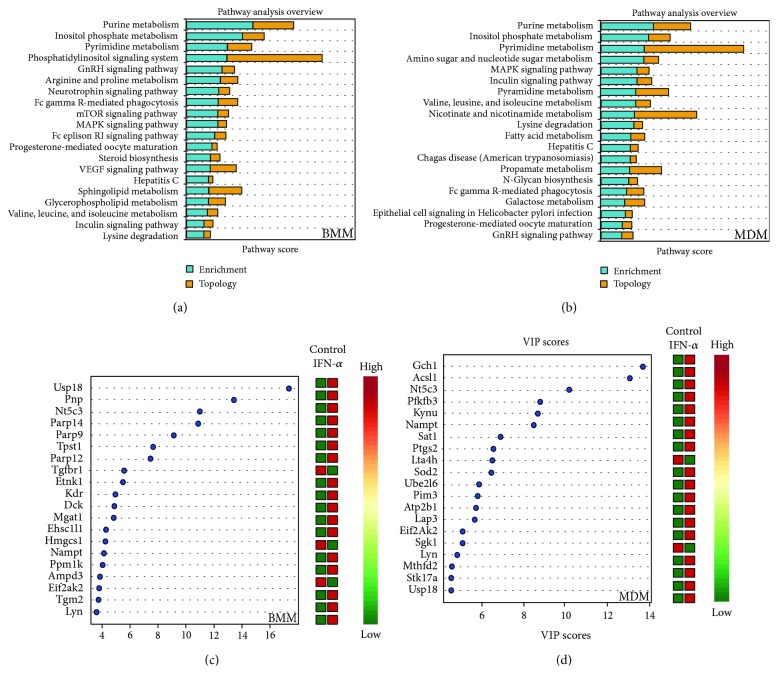
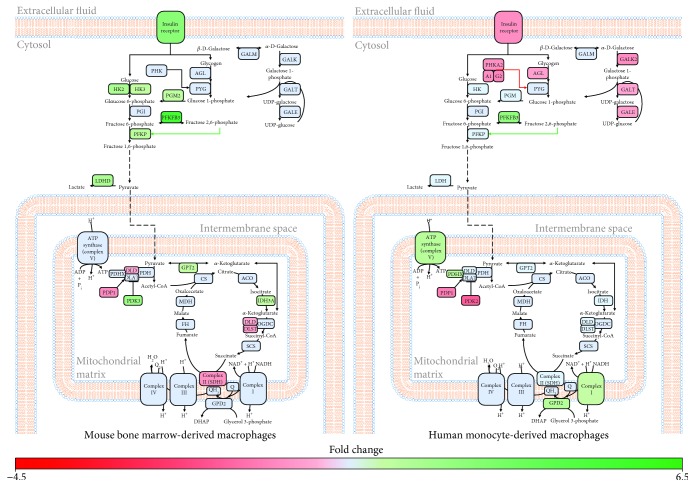
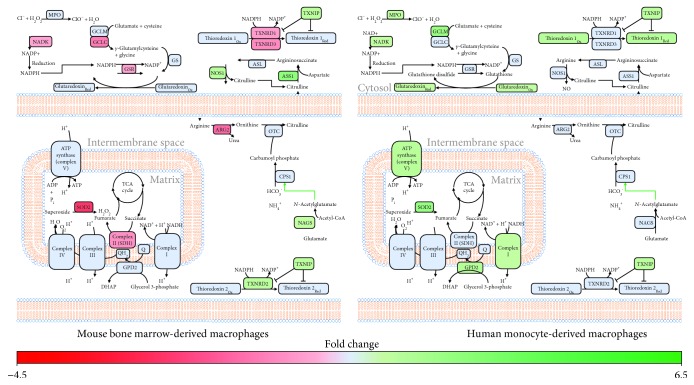
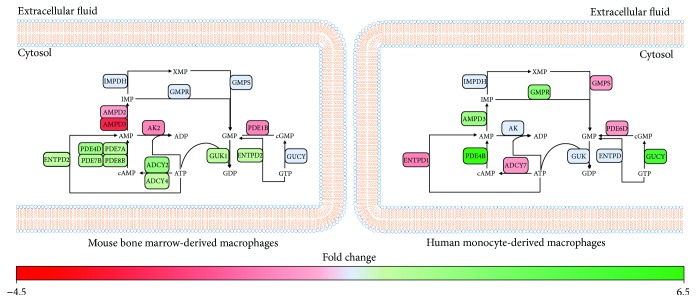
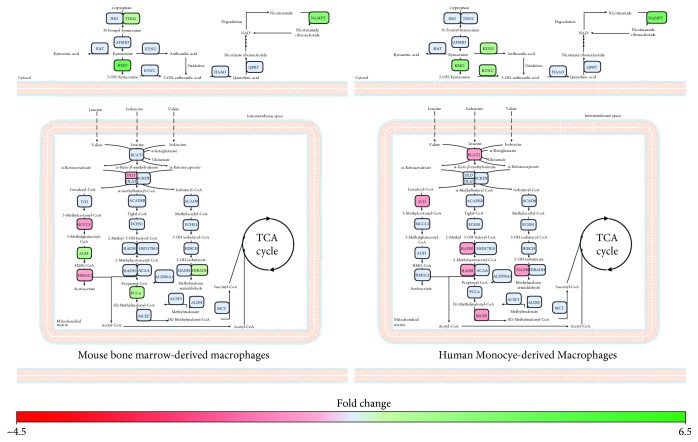
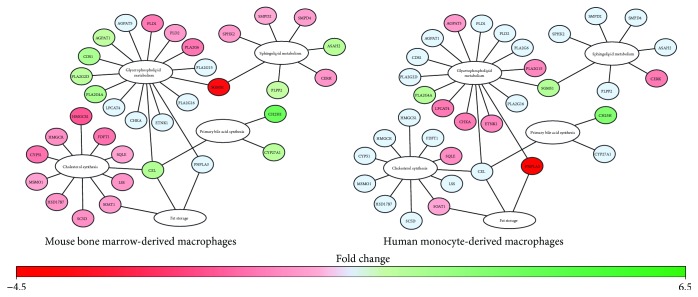
Emerging evidence suggests that cellular metabolism plays a critical role in regulating immune activation. Alterations in energy and lipid and amino acid metabolism have been shown to contribute to type I interferon (IFN) responses in macrophages, but the relationship between metabolic reprogramming and the establishment of early antiviral function remains poorly defined. Here, we used transcriptional profiling datasets to develop global metabolic signatures associated with early IFN-α responses in two primary macrophage model systems: mouse bone marrow-derived macrophages (BMM) and human monocyte-derived macrophages (MDM). Short-term stimulation with IFN-α (<4 hours) was associated with significant metabolic rewiring, with >500 metabolic genes altered in mouse and human macrophage models. Pathway and network analysis identified alterations in genes associated with cellular bioenergetics, cellular oxidant status, cAMP/AMP and cGMP/GMP ratios, branched chain amino acid catabolism, cell membrane composition, fatty acid synthesis, and β-oxidation as key features of early IFN-α responses. These changes may have important implications for initial establishment of antiviral function in these cells.


Figures

Figure 1
Figure 1
Short term IFN-α stimulation is associated with altered expression of metabolic genes in human monocyte-derived macrophages (MDM) and mouse bone marrow-derived macrophages (BMM). (a) Workflow used to identify differentially expressed metabolic genes in IFN-α-stimulated mouse BMM (2.5 hours) and human MDM (4 hours). Metabolic genes were identified in MetScape using the Kyoto Encyclopedia of Genes and Genomes (KEGG) and the Edinburgh Human Metabolic Network (EHMN) databases. (b) Venn diagram showing the number of metabolic genes common to the BMM (yellow) and MDM (blue) datasets (FC > 1.2, p < 0.05, FDR < 0.10). (c) Principal component analysis (PCA) of metabolic gene sets from BMM (left) and MDM (right) following IFN-α stimulation (n = 517 and 354 metabolic genes in the BMM and MDM datasets, resp.).
Figure 2
Figure 2
Metabolic genes are top classifiers of IFN-α stimulation in BMM and MDM. (a) Pathway enrichment and topology analysis of mouse BMM and human MDM following IFN-α stimulation (p < 0.05). Analyses were performed using all metabolic genes. The blue bars represent enrichment analysis. The yellow bars represent topology scores. (b) Top metabolic classifiers of IFN-α stimulation were identified using variable importance in projection (VIP) scores based on PLS-DA models (p < 0.05). Analyses were performed using all metabolic genes (p < 0.05). Red and green in the heat map represent upregulation and downregulation of gene expression, respectively.
Figure 3
Figure 3
Genes associated with bioenergetic processes are differentially expressed in mouse BMM and human MDM following IFN-α stimulation. Significantly altered (−1.2 ≤ FC ≥ 1.2, p value ≤ 0.05, FDR ≤ 0.1) metabolic genes involved in energy production were mapped to their respective pathways using MetScape and DAVID. Green and red represent genes that have been significantly upregulated or downregulated, respectively. Blue represents genes that were not altered following IFN-α stimulation.
Figure 4
Figure 4
IFN-α stimulation of MDM is associated with increased expression of genes associated with ROS production and antioxidant responses. Differentially expressed metabolic genes (−1.2 ≤ FC ≥ 1.2, p value ≤ 0.05, FDR ≤ 0.1) were mapped to pathways associated with cellular redox status using MetScape and DAVID. Green and red represent genes that have been significantly upregulated or downregulated, respectively. Blue represents genes that were not altered following IFN-α stimulation.
Figure 5
Figure 5
Type I IFN responses are associated with altered cAMP and cGMP production in BMM and MDM. Metabolic genes identified as significantly altered (−1.2 ≤ FC ≥ 1.2, p value ≤ 0.05, FDR ≤ 0.1) were mapped to pathways associated with AMP and GMP production using MetScape and DAVID. Green and red represent genes that have been significantly upregulated or downregulated, respectively. Blue represents genes that were not altered following IFN-α stimulation.
Figure 6
Figure 6
Tryptophan and branched-chain amino acid catabolism is altered in BMM and MDM following short-term IFN-α treatment. Metabolic genes altered in IFN-α-stimulated cells compared to controls (−1.2 ≤ FC ≥ 1.2, p value ≤ 0.05, FDR ≤ 0.1) were mapped to amino acid metabolism pathways using MetScape and DAVID. Green and red represent genes that have been significantly upregulated or downregulated, respectively. Blue represents genes that were not altered following IFN-α stimulation.
Figure 7
Figure 7
Expression of genes associated with lipid metabolism were differentially modulated in IFN-α-stimulated BMM compared MDM. Differentially expressed metabolic genes (−1.2 ≤ FC ≥ 1.2, p value ≤ 0.05, FDR ≤ 0.1) involved in cholesterol metabolism and phospholipid and sphingolipid synthesis were mapped using MetScape and DAVID. Green and red represent genes that have been significantly upregulated or downregulated, respectively. Blue represents genes that were not altered following IFN-α stimulation.

References

    1. Isaacs A., Lindenmann J. Virus interference. I. The interferon. Proceedings of the Royal Society of London - Series B: Biological Sciences. 1957;147(927):258–267. doi: 10.1098/rspb.1957.0048. - DOI - PubMed
    1. Isaacs A., Lindenmann J., Valentine R. C. Virus interference. II. Some properties of interferon. Proceedings of the Royal Society of London - Series B: Biological Sciences. 1957;147(927):268–273. doi: 10.1098/rspb.1957.0049. - DOI - PubMed
    1. Pestka S., Krause C. D., Walter M. R. Interferons, interferon-like cytokines, and their receptors. Immunological Reviews. 2004;202(1):8–32. doi: 10.1111/j.0105-2896.2004.00204.x. - DOI - PubMed
    1. Trinchieri G. Type I interferon: friend or foe? The Journal of Experimental Medicine. 2010;207(10):2053–2063. doi: 10.1084/jem.20101664. - DOI - PMC - PubMed
    1. Samuel C. E. Antiviral actions of interferons. Clinical Microbiology Reviews. 2001;14(4):778–809. doi: 10.1128/CMR.14.4.778-809.2001. - DOI - PMC - PubMed

LinkOut - more resources