. 2018 Aug 10:12:65.
doi: 10.3389/fnana.2018.00065. eCollection 2018.

Acetylcholine Neurotransmitter Receptor Densities in the Striatum of Hemiparkinsonian Rats Following Botulinum Neurotoxin-A Injection

Affiliations

Acetylcholine Neurotransmitter Receptor Densities in the Striatum of Hemiparkinsonian Rats Following Botulinum Neurotoxin-A Injection

Teresa Mann et al. Front Neuroanat. .

Abstract

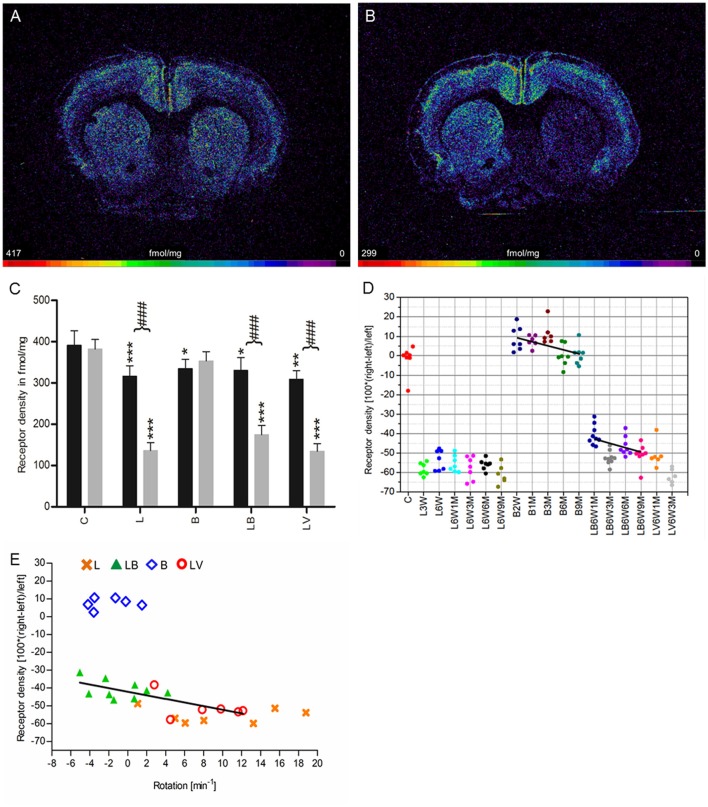
Cholinergic neurotransmission has a pivotal function in the caudate-putamen, and is highly associated with the pathophysiology of Parkinson's disease. Here, we investigated long-term changes in the densities of the muscarinic receptor subtypes M1, M2, M3 (mAchRs) and the nicotinic receptor subtype α4β2 (nAchRs) in the striatum of the 6-OHDA-induced hemiparkinsonian (hemi-PD) rat model using quantitative in vitro receptor autoradiography. Hemi-PD rats exhibited an ipsilateral decrease in striatal mAchR densities between 6 and 16%. Moreover, a massive and constant decrease in striatal nAchR density by 57% was found. A second goal of the study was to disclose receptor-related mechanisms for the positive motor effect of intrastriatally injected Botulinum neurotoxin-A (BoNT-A) in hemi-PD rats in the apomorphine rotation test. Therefore, the effect of intrastriatally injected BoNT-A in control and hemi-PD rats on mAchR and nAchR densities was analyzed and compared to control animals or vehicle-injected hemi-PD rats. BoNT-A administration slightly reduced interhemispheric differences of mAchR and nAchR densities in hemi-PD rats. Importantly, the BoNT-A effect on striatal nAchRs significantly correlated with behavioral testing after apomorphine application. This study gives novel insights of 6-OHDA-induced effects on striatal mAchR and nAchR densities, and partly explains the therapeutic effect of BoNT-A in hemi-PD rats on a cellular level.

Keywords: Botulinum neurotoxin-A; Parkinson's disease; acetylcholine; basal ganglia; hemiparkinsonian rat model; receptors.


Figures

Figure 1
Figure 1
(A,B) Contrast-enhanced color-coded images showing the regional distribution of M1 receptor density labeled with [3H]pirenzepine in a control rat (A,B) after 6-OHDA lesion (group L6W1M) in a control rat (A) and after 6-OHDA lesion (group L6W1M) (B). (C) Mean receptor density (fmol/mg protein; averaged over all post-lesion survival times) in the left/contralateral (black column) and right/ipsilateral hemispheres (gray column) of the 5 groups: C, control; L, 6-OHDA lesion; B, BoNT-A only; LB, L + BoNT-A; LV. L + vehicle. All data is expressed as means ± SD. (D) Scatter plots and regression analyses of the right-left differences of M1 receptor density for all 18 groups and time points (five groups with different survival times); see Table 1 for explanation of abbreviations. Significant regressions are labeled by a continuous line.
Figure 2
Figure 2
(A,B) Contrast-enhanced color-coded images showing the regional distribution of M2 receptor density labeled with the agonist [3H]oxotremorine-M in a control rat (A,B) after 6-OHDA lesion (group L6W1M) in a control rat (A) and after 6-OHDA lesion (group L6W1M) (B). (C) Mean receptor density (fmol/mg protein; averaged over all post-lesion survival times) in the left/contralateral (black column) and right/ipsilateral hemispheres (gray column) of the 5 groups (see Figure 1). All data is expressed as means ± SD. (D) Scatter plots and regression analyses of the right-left differences of M2 receptor density for all 18 groups and time points (five groups with different survival times); see Table 1 for explanation of abbreviations. Significant regressions are labeled by a continuous line.
Figure 3
Figure 3
(A,B) Contrast-enhanced color-coded images showing the regional distribution of M2 and M4 receptor densities receptor density labeled with the antagonist [3H]AF-DX 384 in a control rat (A,B) after 6-OHDA lesion (group L6W6M) in a control rat (A) and after 6-OHDA lesion (group L6W6M) (B). (C) Mean receptor density (fmol/mg protein; averaged over all post-lesion survival times) in the left/contralateral (black column) and right/ipsilateral hemispheres (gray column) of the five groups (see Figure 1). All data is expressed as means ± SD. Asterisks mark significant differences to the respective side of controls (*p < 0.05, ***p < 0.001). Rhombs signs highlight interhemispheric significance within each group (###p < 0.001). (D) Scatter plots and regression analyses of the right-left differences of M2 receptor density for all 18 groups and time points (five groups with different survival times); see Table 1 for explanation of abbreviations. Significant regressions are labeled by a continuous line.
Figure 4
Figure 4
(A,B) Contrast-enhanced color-coded images showing the regional distribution of M3 receptor density labeled with [3H]4-DAMP in a control rat (A,B) after 6-OHDA lesion (group L6W1M) in a control rat (A) and after 6-OHDA lesion (group L6W1M) (B). (C) Mean receptor density (fmol/mg protein; averaged over all post-lesion survival times) in the left/contralateral (black column) and right/ipsilateral hemispheres (gray column) of the five groups (see Figure 1). All data is expressed as means ± SD. Asterisks mark significant differences to the respective side of controls (***p < 0.001). (D) Scatter plots and regression analyses of the right-left differences of M2 receptor density for all 18 groups and time points (five groups with different survival times); see Table 1 for explanation of abbreviations. Significant regressions are labeled by a continuous line.
Figure 5
Figure 5
(A,B) Contrast-enhanced color-coded images showing the regional distribution of nicotinic α4β2 receptor density labeled with [3H]epibatidine in a control rat (A,B) after 6-OHDA lesion (group L6W3M) in a control rat (A) and after 6-OHDA lesion (group L6W3M) (B). (C) Mean receptor density (fmol/mg protein; averaged over all post-lesion survival times) in the left/contralateral (black column) and right/ipsilateral hemispheres (gray column) of the five groups (see Figure 1). All data is expressed as means ± SD. Asterisks mark significant differences to the respective side of controls (*p < 0.05, **p < 0.01, ***p < 0.001). Rhombs signs highlight interhemispheric significance within each group (###p < 0.001). (D) Scatter plots and regression analyses of the right-left differences of M2 receptor density for all 18 groups and time points (five groups with different survival times); see Table 1 for explanation of abbreviations. Significant regressions are labeled by a continuous line. (E) Relationship between interhemispheric differences in the α4β2 receptor densities of groups (LB and LV) and rotational behavior (anti-clockwise: +, clockwise: –).

Similar articles

Cited by

References

    1. Alcantara A. A., Mrzljak L., Jakab R. L., Levey A. I., Hersch S. M., Goldman-Rakic P. S. (2001). Muscarinic m1 and m2 receptor proteins in local circuit and projection neurons of the primate striatum: anatomical evidence for cholinergic modulation of glutamatergic prefronto-striatal pathways. J. Comp. Neurol. 434, 445–460. 10.1002/cne.1186 - DOI - PubMed
    1. Antipova V. A., Holzmann C., Schmitt O., Wree A., Hawlitschka A. (2017). Botulinum neurotoxin a injected ipsilaterally or contralaterally into the striatum in the Rat 6-OHDA model of unilateral parkinson's disease differently affects behavior. Front. Behav. Neurosci. 11:119. 10.3389/fnbeh.2017.00119 - DOI - PMC - PubMed
    1. Antipova V., Hawlitschka A., Mix E., Schmitt O., Dräger D., Benecke R., et al. . (2013). Behavioral and structural effects of unilateral intrastriatal injections of botulinum neurotoxin a in the rat model of Parkinson's disease. J. Neurosci. Res. 91, 838–847. 10.1002/jnr.23210 - DOI - PubMed
    1. Aosaki T., Miura M., Suzuki T., Nishimura K., Masuda M. (2010). Acetylcholine-dopamine balance hypothesis in the striatum: an update. Geriatr. Gerontol. Int. 10(Suppl. 1), 148–157. 10.1111/j.1447-0594.2010.00588.x - DOI - PubMed
    1. Araki T., Tanji H., Fujihara K., Kato H., Imai Y., Mizugaki M., et al. . (2000). Sequential changes of cholinergic and dopaminergic receptors in brains after 6-hydroxydopamine lesions of the medial forebrain bundle in rats. J. Neural Transm. 107, 873–884. 10.1007/s007020070039 - DOI - PubMed

LinkOut - more resources