. 2017;10(4):1703-1732.
doi: 10.5194/gmd-10-1703-2017.

Description and evaluation of the Community Multiscale Air Quality (CMAQ) modeling system version 5.1

Affiliations

Description and evaluation of the Community Multiscale Air Quality (CMAQ) modeling system version 5.1

K Wyat Appel et al. Geosci Model Dev. 2017.

Abstract

The Community Multiscale Air Quality (CMAQ) model is a comprehensive multipollutant air quality modeling system developed and maintained by the US Environmental Protection Agency's (EPA) Office of Research and Development (ORD). Recently, version 5.1 of the CMAQ model (v5.1) was released to the public, incorporating a large number of science updates and extended capabilities over the previous release version of the model (v5.0.2). These updates include the following: improvements in the meteorological calculations in both CMAQ and the Weather Research and Forecast (WRF) model used to provide meteorological fields to CMAQ, updates to the gas and aerosol chemistry, revisions to the calculations of clouds and photolysis, and improvements to the dry and wet deposition in the model. Sensitivity simulations isolating several of the major updates to the modeling system show that changes to the meteorological calculations result in enhanced afternoon and early evening mixing in the model, periods when the model historically underestimates mixing. This enhanced mixing results in higher ozone (O3) mixing ratios on average due to reduced NO titration, and lower fine particulate matter (PM2.5) concentrations due to greater dilution of primary pollutants (e.g., elemental and organic carbon). Updates to the clouds and photolysis calculations greatly improve consistency between the WRF and CMAQ models and result in generally higher O3 mixing ratios, primarily due to reduced cloudiness and attenuation of photolysis in the model. Updates to the aerosol chemistry result in higher secondary organic aerosol (SOA) concentrations in the summer, thereby reducing summertime PM2.5 bias (PM2.5 is typically underestimated by CMAQ in the summer), while updates to the gas chemistry result in slightly higher O3 and PM2.5 on average in January and July. Overall, the seasonal variation in simulated PM2.5 generally improves in CMAQv5.1 (when considering all model updates), as simulated PM2.5 concentrations decrease in the winter (when PM2.5 is generally overestimated by CMAQ) and increase in the summer (when PM2.5 is generally underestimated by CMAQ). Ozone mixing ratios are higher on average with v5.1 vs. v5.0.2, resulting in higher O3 mean bias, as O3 tends to be overestimated by CMAQ throughout most of the year (especially at locations where the observed O3 is low); however, O3 correlation is largely improved with v5.1. Sensitivity simulations for several hypothetical emission reduction scenarios show that v5.1 tends to be slightly more responsive to reductions in NO x (NO + NO2), VOC and SO x (SO2 + SO4) emissions than v5.0.2, representing an improvement as previous studies have shown CMAQ to underestimate the observed reduction in O3 due to large, widespread reductions in observed emissions.


Conflict of interest statement

Competing interests. The authors declare that they have no conflict of interest.

Figures

Figure 1.
Figure 1.
Monthly average difference in O3 (ppbv) for (a) January and (b) July and PM2.5 (μgm-3) for (c) January and (d) July between CMAQv5.0.2 using WRFv3.4 (CMAQv5.0.2_Base) and CMAQv5.0.2 using WRFv3.7 (CMAQv5.0.2_WRFv3.7) (CMAQv5.0.2_WRFv3.7-CMAQv5.0.2_Base). Note that the scales between each plot may vary.
Figure 2.
Figure 2.
Monthly average sum total of AALK1, AALK2, APAH1, APAH2 and APAH3 for (a) January and (b) July (upper right) and the monthly average difference is the sum total of AISO1, AISO2, AISO3 and AOLGB for (c) January and (d) July between the aerosol treatments in CMAQ v5.0.2 and v5.1 (v5.1-v5.0.2). All plots are in units of micrograms per cubic meter (μgm−3). Note that the scales between each plot may vary.
Figure 3.
Figure 3.
Difference in the monthly average O3 for (a) January and (b) July and PM2.5 for (c) January and (d) July between CMAQv5.1_base and v5.1_RetroPhot (v5.1_Base - v5.1_RetroPhot). O3 plots are in units of parts per billion by volume (ppbv) and PM2.5 plots are in units of micrograms per cubic meter (μg m−3). Note that the scales between each plot may vary.
Figure 4.
Figure 4.
The average cloud albedo during daytime hours in July 2011 with available satellite data (n =301 h total) derived from (a) the GOES satellite product, (b) WRF3.7, (c) CMAQv5.1 with photolysis and cloud model treatment from v5.0.2 and WRF3.7 inputs (CMAQv5,1 _RetroPhot), and (d) CMAQv5.1 using WRF3.7 inputs (CMAQv5.1_Base_NEIv2).
Figure 5.
Figure 5.
Difference in the monthly average O3 for (a) January and (b) July and PM2.5 (with organic matter mass removed) for (c) January and (d) July between CMAQv5.1_Base_NEIv2 and v5.1_TUCL (CMAQv5.1_Base_NEIv2-CMAQv5.1_TUCL). O3 plots are in units of parts per billion by volume (ppbv) and PM2.5 plots are in units of micrograms per cubic meter (μg m−3). Note that the scales for each plot can vary.
Figure 6.
Figure 6.
Difference in the seasonal average PM2.5 for (a) winter (DJF), (b) spring (MAM), (c) summer (JJA) and (d) fall (SON) between CMAQv5.0.2_Base and CMAQv5.1_Base_NEIv1 (CMAQv5.1_Base_NEIv1-CMAQv5.0.2_Base). All plots are in units of micrograms per cubic meter (μg m−3).
Figure 7.
Figure 7.
Seasonal average PM2.5 mean bias (μg m at IMPROVE (circles), CSN (triangles), AQS Hourly (squares) and AQS Daily (diamonds) sites for (a) winter (DJF), (b) spring (MAM), (c) summer (JJA) and (d) fail (SON) for the CMAQv5.1_Base simulation.
Figure 8.
Figure 8.
Difference in the absolute value of seasonal average PM2.5 mean bias for (a) winter (DJF), (b) spring (MAM), (c) summer (JJA) and (d) fall (SON) between CMAQ v5.0.2_Base and v5.1_Base_NEIvl (CMAQv5.1_Base_NEIvl-CMAQv5.0.2_Base). All plots are in units of micrograms per cubic meter (μg m−3). Cool colors indicate a reduction in PM2.5 mean bias in v5.1, while warm colors indicate an increase in PM2.5 mean bias v5.1.
Figure 9.
Figure 9.
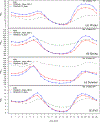
Diurnal time series of seasonal PM2.5 (μg m-3) for AQS observations (gray), CMAQv5.0.2_Base simulation (blue) and CMAQv5.1_Base_NEIv1 simulation (red) for (a) winter, (b) spring, (c) summer and (d) fall.
Figure 10.
Figure 10.
Regional and seasonal stacked bar plots of PM2.5 composition at the CSN sites (left), CMAQv5.0.2_Base simulation (middle) and CMAQv5.1_Base_NEIv1 simulation (right). In order from top to bottom are (a) winter, (b) spring, (c) summer and (d) fall seasons and left to right the northeast, Great Lakes, Atlantic, south and west regions. The individual PM2.5 components (in order from bottom to top) are SO42 (yellow), NO3(red), NH4+(orange), EC (black), OC (light gray), soil (brown), NaCl (green), NCOM (pink), other (white), blank adjustment (dark gray) and H2O / FRM adjustment (blue).
Figure 11.
Figure 11.
Difference in the monthly average hourly O3 (ppbv) for winter (DJF; top) left), spring (MAM; top right), summer (JJA; bottom left) and fall (SON; bottom right) between CMAQ v5.0.2_Base and v5.1_Base_NEIv1 (CMAQv5.1_Base_NEIv1-CMAQv5.0.2_Base). Note that the scales between each plot may vary.
Figure 12.
Figure 12.
Seasonal average hourly O3 (ppbv) mean bias at AQS sites for (a) winter (DJF), (b) spring (MAM), (c) summer (JJA) and (d) fall (SON) for the CMAQv5.1_Base_NEIv1 simulation.
Figure 13.
Figure 13.
Difference in the absolute value of monthly. average O3 (ppbv) mean bias for (a) winter (DJF), (b) spring (MAM), (c) summer (JJA) and (d) fall (SON) between CMAQ v5.0.2_Base and v5.1_Base_NEIv1 (CMAQv5.1_Base_NEIv1-CMAQv5.0.2_Base). Cool colors indicate a reduction in O3 mean bias in v5.1, while warm colors indicate an increase in O3 mean bias v5.1.
Figure 14.
Figure 14.
Diurnal time series of seasonal O3 (ppbv) for AQS observations (gray), CMAQv5.0.2_Base simulation (blue) and CMAQv5.1_Base_NEIv1 simulation (red) for (a) winter, (b) spring, (c) summer and (d) fall
Figure 15.
Figure 15.
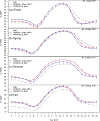
Diurnal time series of seasonal NOx (ppbv) for AQS observations (gray), CMAQv5.0.2_Base simulation (blue) and CMAQv5.1_Base_NEIv1 simulation (red) for (a) winter, (b) spring, (c) summer and (d) fall.
Figure 16.
Figure 16.
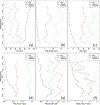
Observed (black) and CMAQ-simulated vertical profiles of (a) O3, (b) NO2, (c) NOy, (d) alkyl nitrates (ANs), (e) peroxy nitrates (PNs) and (f) HNO3 for the Edgewood site in Baltimore, MD, on 5 July 2011. CMAQv502_Base simulation profiles are shown in green and CMAQv51_Base_NEIv1 simulation profiles are shown in red. Altitude (km) is given on the y axis, while mixing ratio (ppbv) is given on the x axis.
Figure 17.
Figure 17.
Difference in MDA8 O3 daily ratios (cut scenario / base) for CMAQv5.0.2 and v5.1 (v5.0.2-v5.1) for a 50 % cut in anthropogenic NOx (a-b) and VOC (c-d) for January (a, c) and July (b, d) binned by the modeled MDA8 O3 mixing ratio (ppbv). Values greater than 1 indicate v5.1 is more responsive than v5.0.2 to the emissions cut, while values less than 1 indicate v5.0.2 is more responsive. Given above the x axis is the number of model grid cells in each bin.
Figure 18.
Figure 18.
Box plots of monthly average ratio values (cut / base) of PMIJ (total PM2.5), ASO4IJ, ANO3IJ, ANH4IJ, AECIJ, ANCOMIJ, AUNSPECIJ, AOMIJ, APOAIJ, AORGAJ, AORGBJ and AORGCJ for v5.0.2 (blue) and v5.1 (red) for a 50% cut in anthropogenic NOx (a, d), VOC (b, e) and SOx (c, f) for January (a-c) and July (d-f).

Similar articles

Cited by

References

    1. Altimir N, Kolari P, Tuovinen J-P, Vesala T, Back J, Suni T, Kulmala M, and Hari P: Foliage surface ozone deposition: a role for surface moisture?, Biogeosciences, 3, 209–228, doi:10.5194/bg-3-209-2006, 2006. - DOI
    1. Anderson DC, Loughner CP, Diskin G, Weinheimer A, Canty TP, Salwitch RJ, Worden HM, Fried A, Mikoviny T, Wisthaler A, and Dickerson RR: Measured and modeled CO and NOy in DISCOVER-AQ: An evaluation of emissions and chemistry over the eastern US, Atmos. Environ, 96, 78–87, doi:10.1016/j.atmosenv.2014.07.004, 2014. - DOI
    1. Appel KW, Bhave PV, Gilliland AB, Sarwar G, and Roselle SJ: Evaluation of the Community Multiscale Air Quality (CMAQ) model version 4.5: Sensitivities impacting model performance; Part II - particulate matter, Atmos. Environ, 42, 6057–6066, doi:10.1016/j.atmosenv.2008.03.036, 2008. - DOI
    1. Appel KW, Chemel C, Roselle SJ, Francis XV, Sokhi RS, Rao ST, and Galmarini S: Examination of the Community Multiscale Air Quality (CMAQ) model performance over the North American and European Domains, Atmos. Environ, 53, 142–155, doi:10.1016/j.atmosenv.2011.11.016, 2012. - DOI
    1. Appel KW, Gilliland AB, Sarwar G, and Gilliam RC: Evaluation of the Community Multiscale Air Quality (CMAQ) model version 4.5: Sensitivities impacting model performance; Part I - ozone, Atmos. Environ, 41, 9603–9615, doi:10.1016/j.atmosenv.2007.08.044, 2007. - DOI

LinkOut - more resources