. 2018 Aug 27;13(8):e0202079.
doi: 10.1371/journal.pone.0202079. eCollection 2018.

Modelling mesenchymal stromal cell growth in a packed bed bioreactor with a gas permeable wall

Affiliations

Modelling mesenchymal stromal cell growth in a packed bed bioreactor with a gas permeable wall

Michael J Osiecki et al. PLoS One. .

Abstract

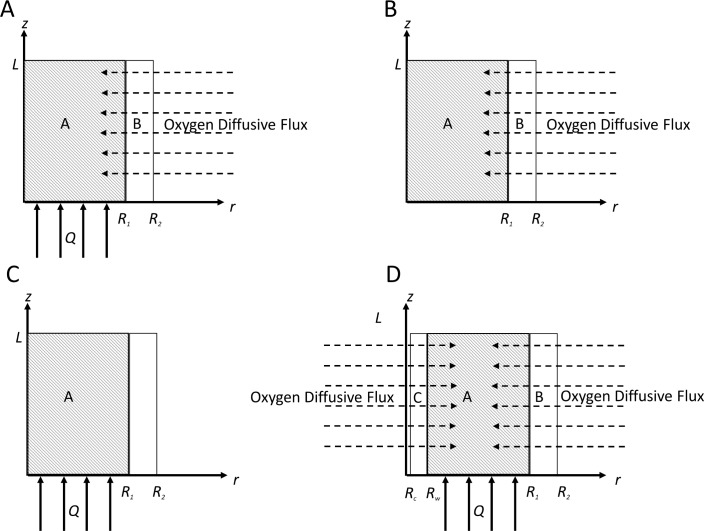
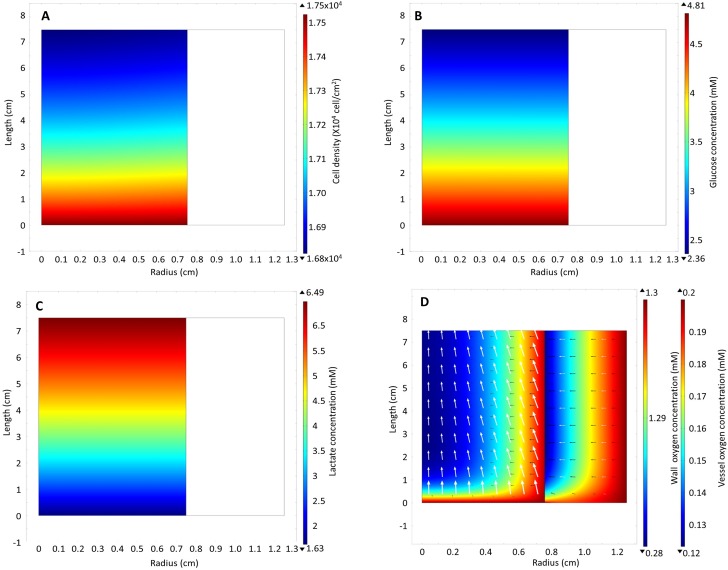
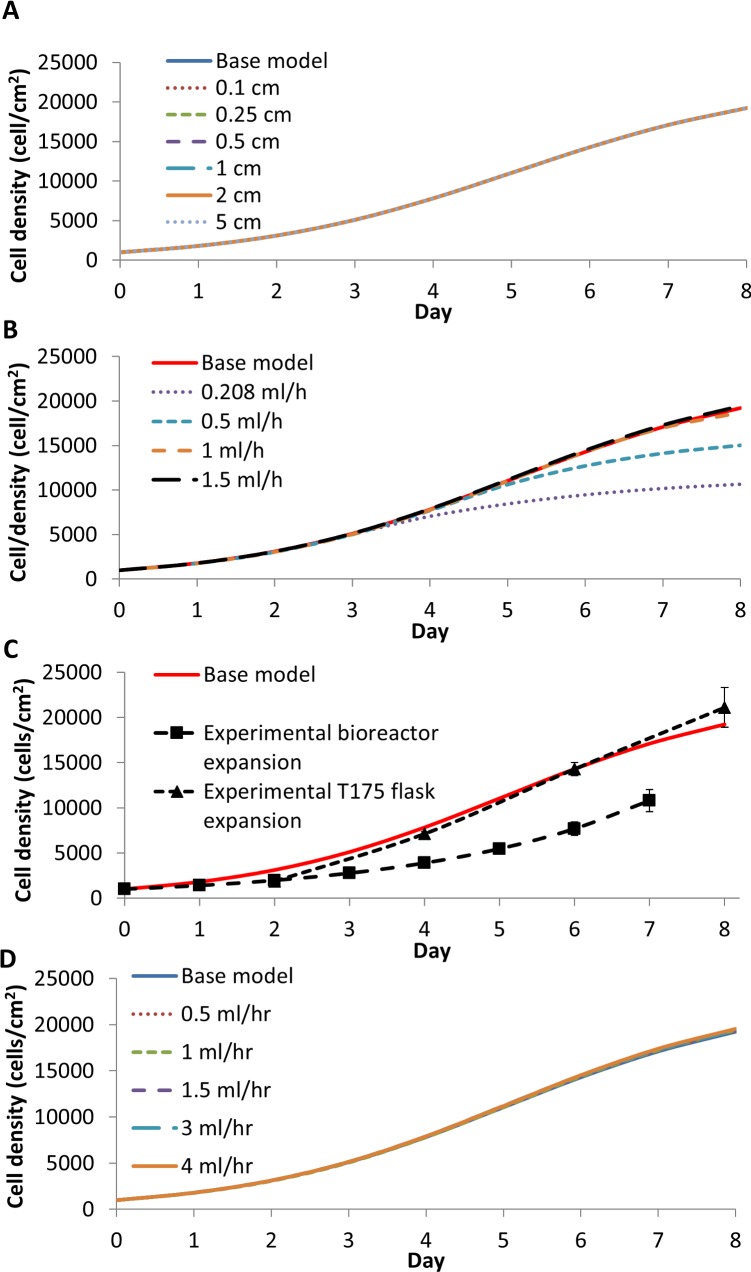
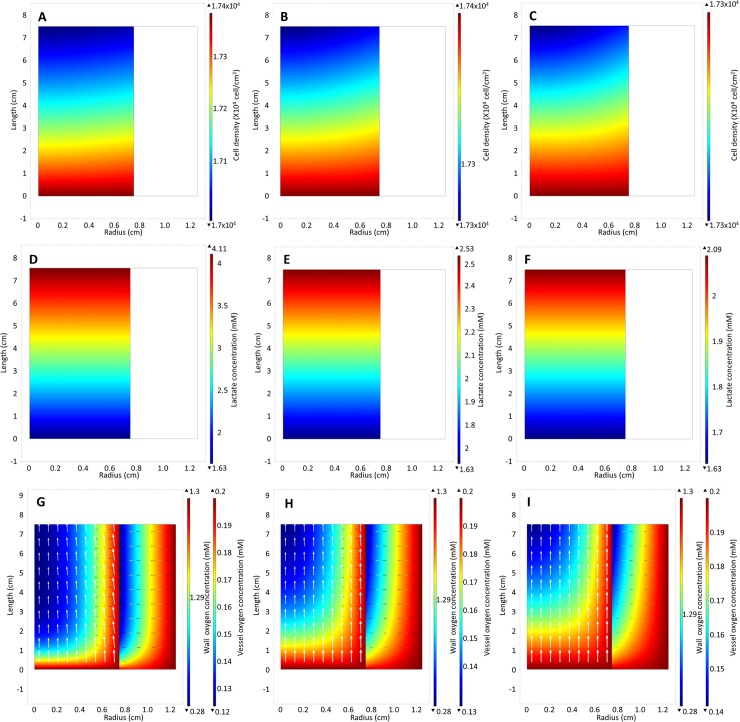
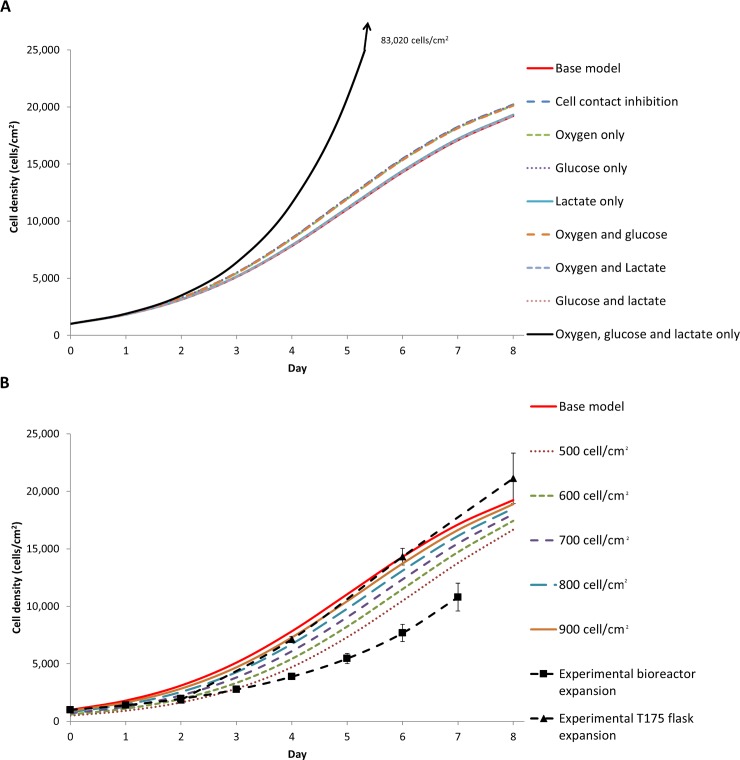
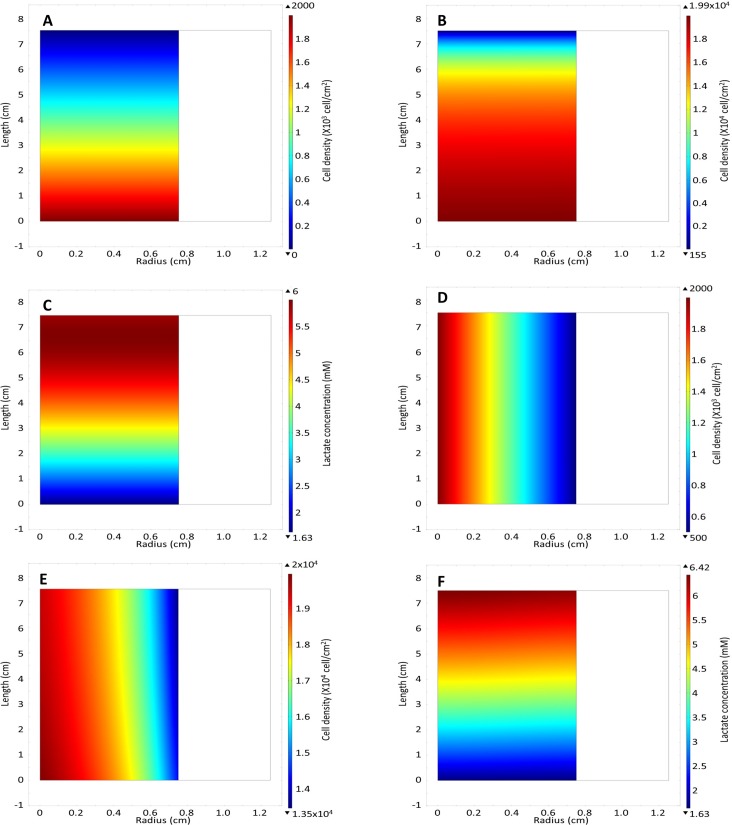
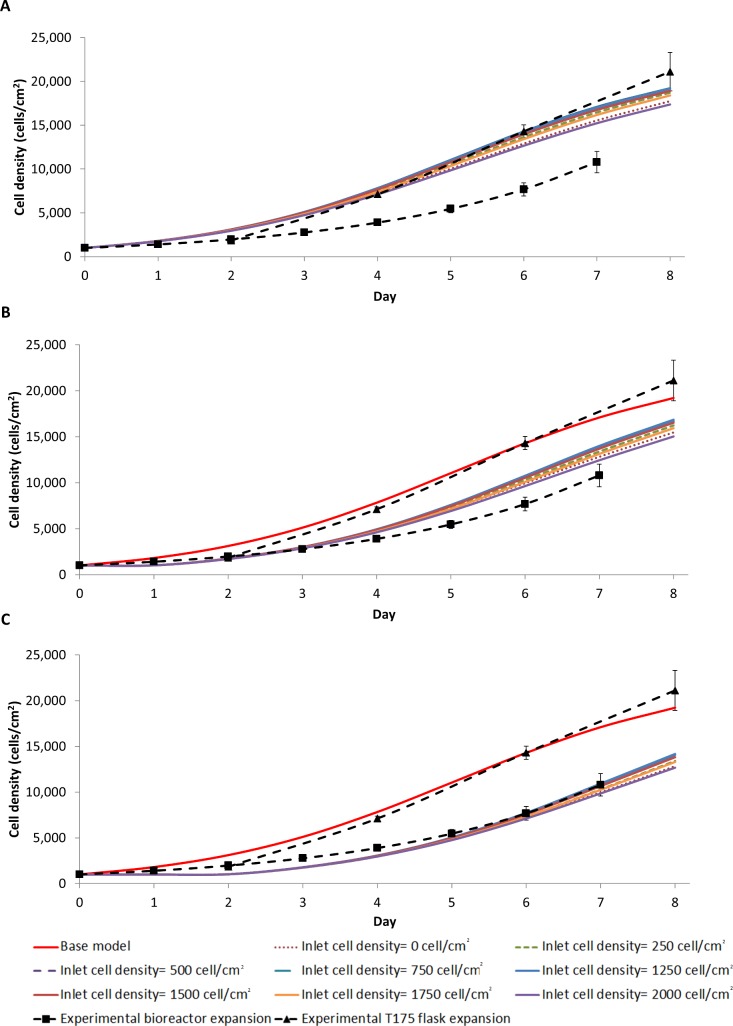
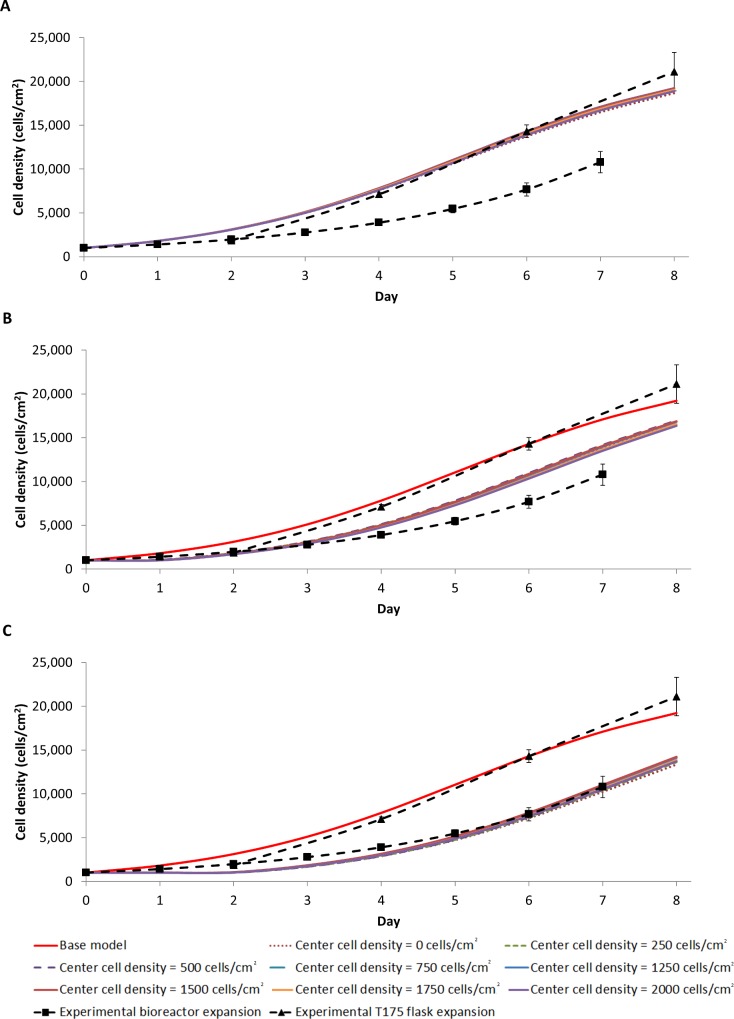
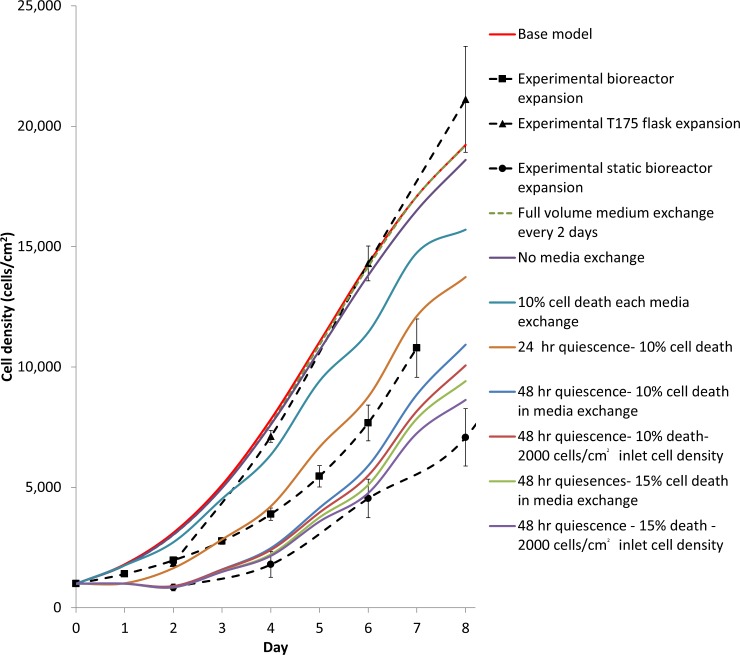
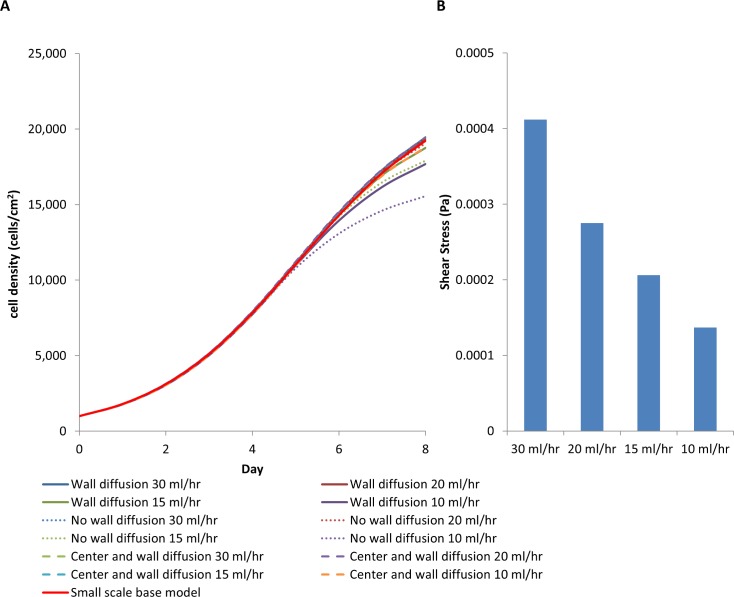
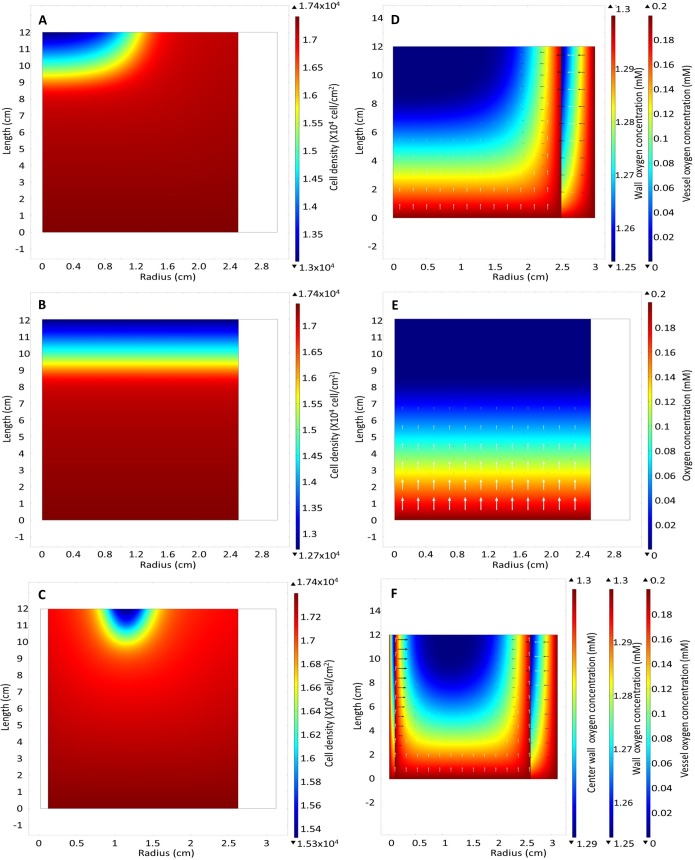
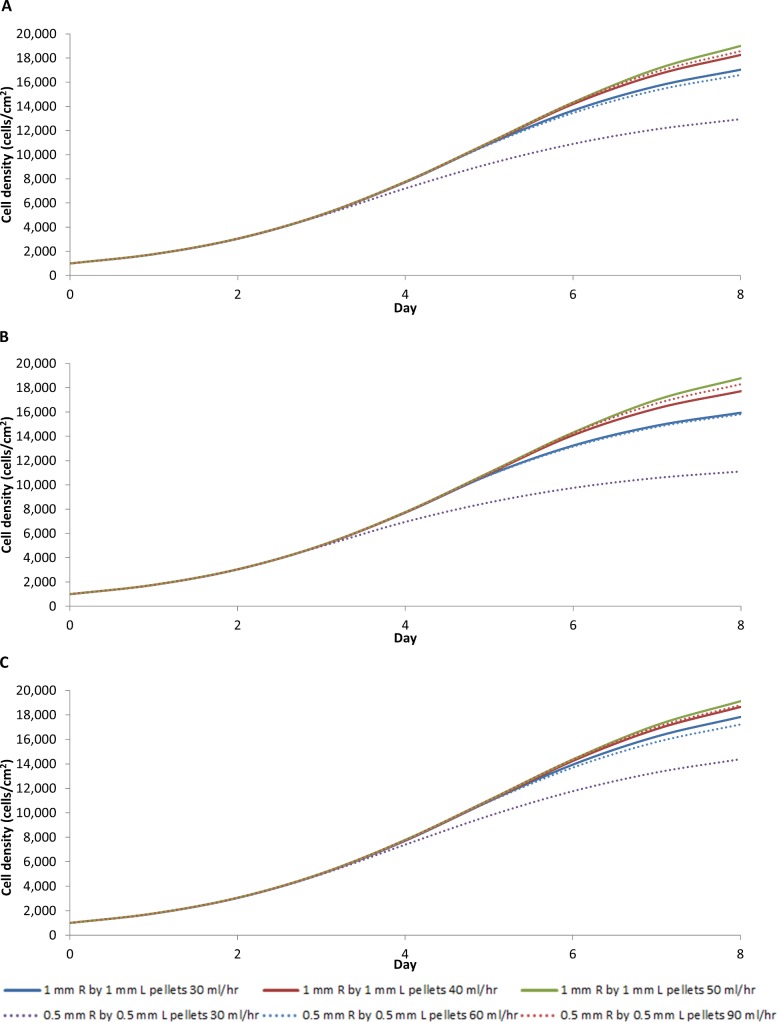
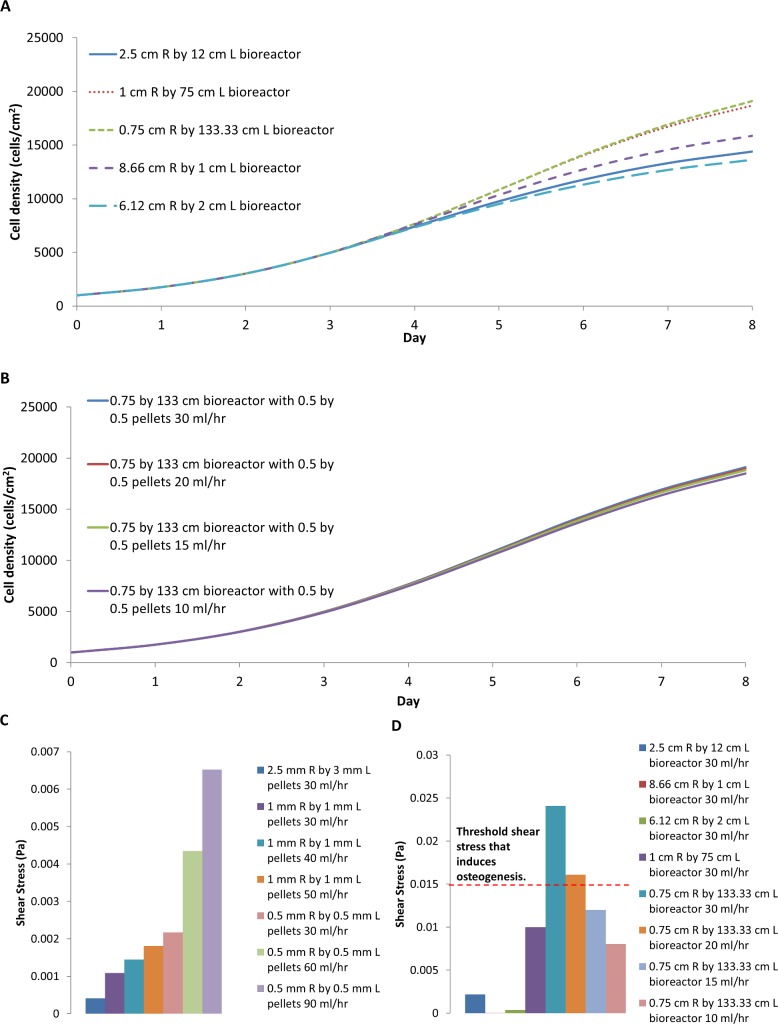
A mathematical model was developed for mesenchymal stromal cell (MSC) growth in a packed bed bioreactor that improves oxygen availability by allowing oxygen diffusion through a gas-permeable wall. The governing equations for oxygen, glucose and lactate, the inhibitory waste product, were developed assuming Michaelis-Menten kinetics, together with an equation for the medium flow based on Darcy's Law. The conservation law for the cells includes the effects of inhibition as the cells reach confluence, nutrient and waste product concentrations, and the assumption that the cells can migrate on the scaffold. The equations were solved using the finite element package, COMSOL. Previous experimental results collected using a packed bed bioreactor with gas permeable walls to expand MSCs produced a lower cell yield than was obtained using a traditional cell culture flask. This mathematical model suggests that the main contributors to the observed low cell yield were a non-uniform initial cell seeding profile and a potential lag phase as cells recovered from the initial seeding procedure. Lactate build-up was predicted to have only a small effect at lower flow rates. Thus, the most important parameters to optimise cell expansion in the proliferation of MSCs in a bioreactor with gas permeable wall are the initial cell seeding protocol and the handling of the cells during the seeding process. The mathematical model was then used to identify and characterise potential enhancements to the bioreactor design, including incorporating a central gas permeable capillary to further enhance oxygen availability to the cells. Finally, to evaluate the issues and limitations that might be encountered scale-up of the bioreactor, the mathematical model was used to investigate modifications to the bioreactor design geometry and packing density.


Conflict of interest statement

The authors have declared that no competing interests exist.

Figures

Fig 1
Fig 1
(A) Axis of symmetry diagram of perfusion bioreactor with a gas permeable wall. Oxygen is allowed to diffuse radially into the bioreactor. R2 is the radius of the PDMS cylinder, R1 is the radius of the scaffold volume of the bioreactor, and L is the length. In the equation development, the radial coordinate was denoted by r and the longitudinal coordinate by z (measured from the inlet). (B) The experiments were also performed in a batch configuration where the medium was replaced every two days, however oxygen could still diffuse through the wall. (C) Traditional packed/fixed bed bioreactor where all the nutrients and oxygen are provided by medium perfusion alone. (D) Further enhancement of the design by incorporating a central capillary with outer wall radius Rw and lumen Rc in the centre of the reactor provides an additional oxygen source.
Fig 2
Fig 2
Model results: heat map of (A) cell density, (B) glucose, (C) lactate and (D) oxygen concentration in the wall and in the vessel on day 7. The white arrows on the oxygen concentration heat map represent the direction of total flux of oxygen while the black arrows represent the direction of the diffusive flux.
Fig 3
Fig 3
(A) The predicted average cell density change as a result of increasing the wall thickness from 0.1 to 5 cm. (B) A bioreactor model average cell density without wall diffusion requires a higher medium flow rate compared to our bioreactor with wall diffusion (Base model). (C) The average cell densities achieved experimentally from T175 flask and bioreactor expanded cells were compared to base model output. Note that only final cell numbers were measured for the bioreactor expanded cells; the curve represents exponential approximations of the previous days based on the overall growth rate from the experiment. (D) Predicted average cell density at different flow rates in a gas permeable wall packed bed bioreactor. The modelling predicts that the cell yield is almost independent of the flow rate.
Fig 4
Fig 4
Heat maps of (A-C) cell density distribution (D-F) lactate concentration (G-I) and oxygen concentration at inlet flow rates0.5, 1.5, 3 cm3/hr respectively.
Fig 5
Fig 5
(A) The average cell density with different cell growth rate equations defined in Table 2. (B) The average cell density with the initial homogeneous cell distribution adjusted from 500 cell/cm2 to 1000 cell/cm2 (base model).
Fig 6
Fig 6
(A) Cell density heat map of linear cell distribution in the z direction at day 0 and with an inlet concentration of 2000 cell/cm2. (B) Cell distribution at day 7 with Nin = 2000 cell/cm2 with a linear cell distribution in the z direction. (C) Lactate concentration at day 7 with a Nin = 2000 cell/cm2 with a linear cell distribution in the z direction. (D) The initial cell density of linear cell distribution in the r direction with a centre concentration of 2000 cell/cm2. (E) Cell density of linear cell distribution in the r direction at day 7 with Nin = 2000 cell/cm2. (F) Lactate concentration for linear cell distribution in the r direction with Nin = 2000 cell/cm2 at day 7.
Fig 7
Fig 7
Heterogeneous cell distributions are modelled as a linear function in the z direction, setting the cell concentration at the inlet (z = 0 cm) between 0 to 2000 cell/cm2with (A) 0 hr, (B) 24 hr and (C) 48 hr cell quiescence. Note that the total initial cell number is the same in all conditions (158,800 cells).
Fig 8
Fig 8
Heterogeneous cell distribution modelled as a linear function in the r direction by setting the centre cell density (r = 0) between 0 to 2000 cell/cm2 with 0 hr (A), 24 hr (B) and 48 hr (C) cell quiescence. Note that the total initial cell number is the same in all conditions (158,800 cells).
Fig 9
Fig 9. Experimental and model average cell densities of a batch bioreactor with a full volume exchange every two days, exploring the effect of no medium exchange, cell death with every medium exchange, quiescence due to cell shock and heterogeneous cell distribution.
Fig 10
Fig 10
(A) Average cell density comparing scaled-up bioreactor R1 = 2.5 cm, R2 = 3 cm and L = 12 cm with bioreactor design that includes wall diffusion, no wall diffusion, wall diffusion with additional central capillary providing oxygen. (B) Shear stress at different flow rates.
Fig 11
Fig 11
Cell density heat map of bioreactor with (A) oxygen provided by diffusion through the wall, (B) no wall diffusion and (C) oxygen provided by both diffusion through the wall and central capillary at day 7 at a flow rate 15 ml/hr. Oxygen concentration with (D) oxygen provided by diffusion through the wall, (E) no wall diffusion and (F) oxygen provided by both diffusion through the wall and central capillary at day 7.
Fig 12
Fig 12
Average cell density in the larger R1 = 2.5 and L = 12 cm bioreactor with different pellet and flow rate for a bioreactor design that includes wall diffusion (A), no wall diffusion (B), wall diffusion with additional central capillary providing oxygen (C).
Fig 13
Fig 13
(A) Average cell density of the bioreactor design that provides oxygen by diffusion through the wall and central capillary using 0.5 mm pellets with different bioreactor geometries with the same reactor volume and surface area as a R1 = 2.5 and L = 12 cm bioreactor with a flow rate of 30 ml/hr. (B) Average cell density of the bioreactor providing oxygen through the wall and central capillary at different flow rate rates. (C) Shear stresses of different pellet size and different flow rates. (D) Shear stresses of different bioreactor geometries and flow rate.

Similar articles

Cited by

References

    1. Weber C, Freimark D, Portner R, Pino-Grace P, Pohl S, Wallrapp C, et al. Expansion of human mesenchymal stem cells in a fixed-bed bioreactor system based on non-porous glass carrier—part A: inoculation, cultivation, and cell harvest procedures. The International journal of artificial organs. 2010;33(8):512–25. Epub 2010/09/28. . - PubMed
    1. Timmins NE, Kiel M, Gunther M, Heazlewood C, Doran MR, Brooke G, et al. Closed system isolation and scalable expansion of human placental mesenchymal stem cells. Biotechnology and bioengineering. 2012;109(7):1817–26. Epub 2012/01/18. 10.1002/bit.24425 . - DOI - PubMed
    1. Mizukami A, Orellana MD, Caruso SR, de Lima Prata K, Covas DT, Swiech K. Efficient expansion of mesenchymal stromal cells in a disposable fixed bed culture system. Biotechnol Prog. 2013;29(2):568–72. Epub 2013/02/20. 10.1002/btpr.1707 . - DOI - PubMed
    1. De Napoli IE, Scaglione S, Giannoni P, Quarto R, Catapano G. Mesenchymal stem cell culture in convection-enhanced hollow fibre membrane bioreactors for bone tissue engineering. Journal of Membrane Science. 2011;379(1–2):341–52. 10.1016/j.memsci.2011.06.001. - DOI
    1. Li M, Tilles AW, Milwid JM, Hammad M, Lee J, Yarmush ML, et al. Phenotypic and functional characterization of human bone marrow stromal cells in hollow-fibre bioreactors. Journal of tissue engineering and regenerative medicine. 2012;6(5):369–77. Epub 2011/06/29. 10.1002/term.439 ; PubMed Central PMCID: PMCPMC3183117. - DOI - PMC - PubMed

LinkOut - more resources