

Application of Venn's diagram in the diagnosis of pleural tuberculosis using IFN-γ, IP-10 and adenosine deaminase
- PMID: 30148839
- PMCID: PMC6110466
- DOI: 10.1371/journal.pone.0202481
Application of Venn's diagram in the diagnosis of pleural tuberculosis using IFN-γ, IP-10 and adenosine deaminase
Abstract
Background: Pleural tuberculosis (PlTB) is the most common extrapulmonary manifestation of this infectious disease which still presents high mortality rates worldwide. Conventional diagnostic tests for PlTB register multiple limitations, including the lack of sensitivity of microbiological methods on pleural specimens and the need of invasive procedures such as pleural biopsy performance. In this scenario, the search for biological markers on pleural fluid (PF) has been the target of several studies as a strategy to overcome the limitations of PlTB diagnosis. This study aims to evaluate the use either isolated or in combination with adenosine deaminase (ADA), interferon-gamma (IFN-γ), interferon-gamma inducible protein of 10-kD (IP-10) levels on PF in order to guide an accurate anti-TB treatment in microbiologically non-confirmed cases.
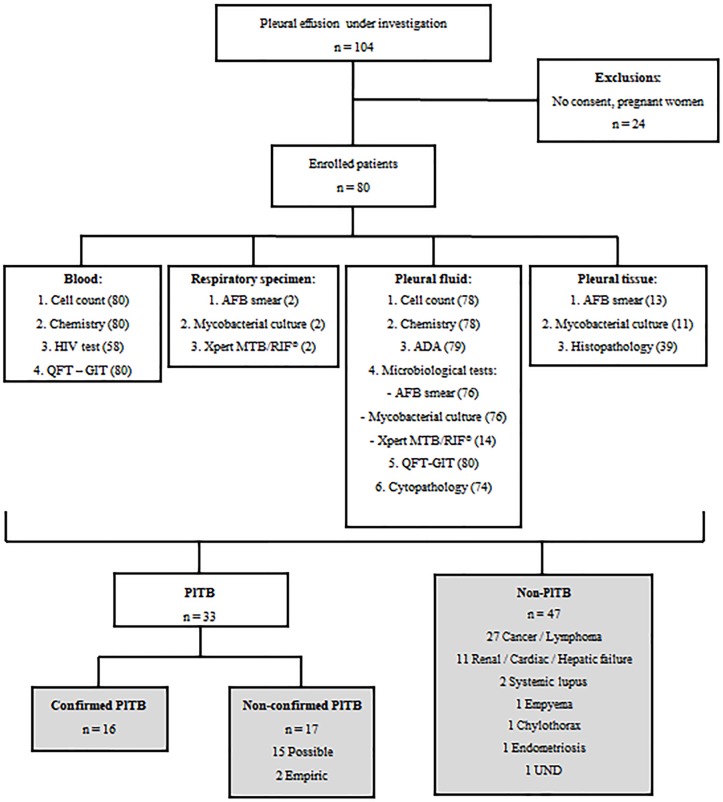
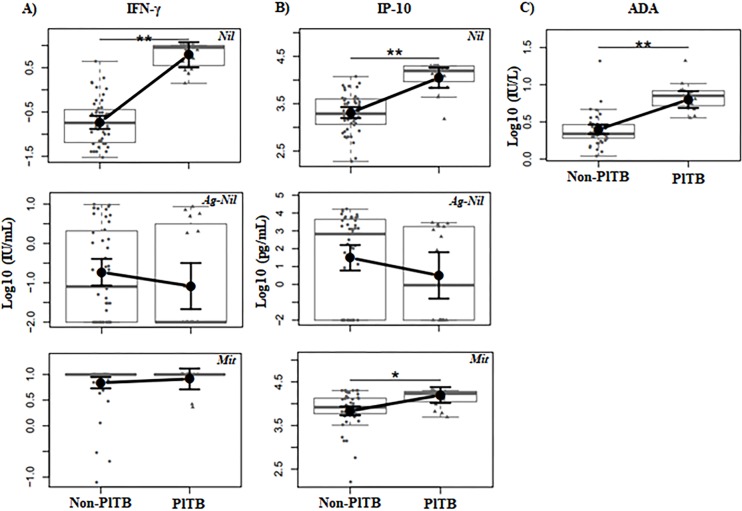
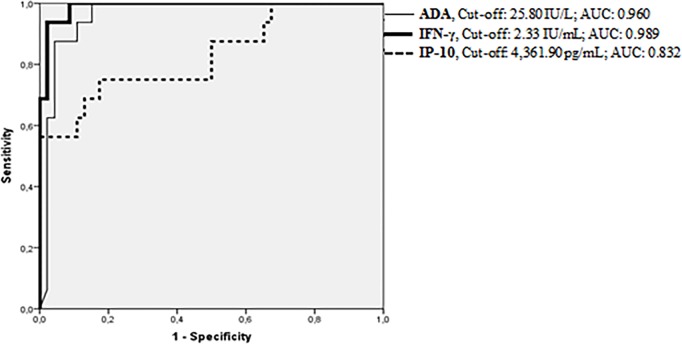
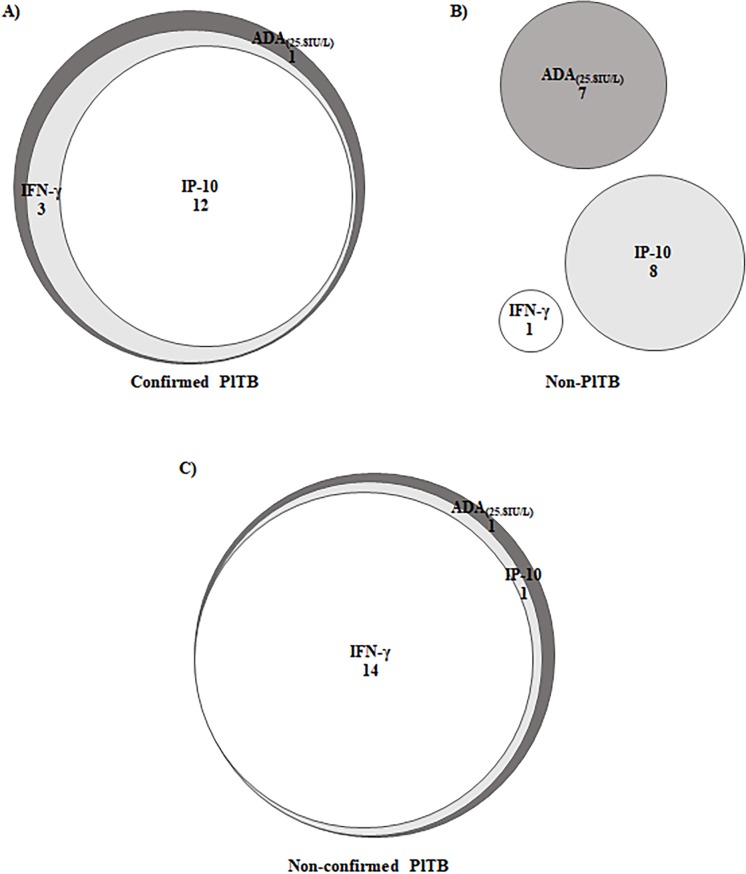
Methods and findings: Eighty patients presenting pleural effusion under investigation were enrolled in a cross-sectional study conducted at Pedro Ernesto University Hospital, Rio de Janeiro, RJ, Brazil. Peripheral blood (PB) and PF samples collected from all patients were applied to the commercial IFN-γ release assay, QuantiFERON-TB Gold In-Tube, and samples were analyzed for IFN-γ and IP-10 by immunoassays. ADA activity was determined on PF by the colorimetric method. Based on microbiological and histological criteria, patients were categorized as follow: confirmed PlTB (n = 16), non-confirmed PlTB (n = 17) and non-PlTB (n = 47). The Mycobacterium tuberculosis antigen-specific production of IFN-γ and IP-10 on PB or PF did not show significant differences. However, the basal levels of these biomarkers, as well as the ADA activity on PF, were significantly increased in confirmed PlTB in comparison to non-PlTB group. Receiver operating characteristics curves were performed and the best cut-off points of these three biomarkers were estimated. Their either isolated or combined performances (sensitivity [Se], specificity [Sp], positive predictive value [PPV], negative predictive value [NPV] and accuracy [Acc]) were determined and applied to Venn's diagrams among the groups. Based on the confirmed PlTB cases, IFN-γ showed the best performance of them at a cut-off point of 2.33 IU/mL (Se = 93.8% and Sp = 97.9%) followed by ADA at a cut-off of 25.80 IU/L (Se = 100% and Sp = 84.8%) and IP-10 (Cut-point = 4,361.90 pg/mL, Se = 75% and Sp = 82.6%). IFN-γ plus ADA (cut-point: 25.80 IU/L) represent the most accurate biomarker combination (98.4%), showing Se = 93.7%, Sp = 100%, PPV = 100% and NPV = 97.9%. When this analysis was applied in non-confirmed PlTB, 15/17 (88.2%) presented at least two positive biomarkers in combination.
Conclusion: IFN-γ, IP-10, and ADA in PlTB effusions are significantly higher than in non-PlTB cases. IFN-γ is an excellent rule-in and rule-out test compared to IP-10 and ADA. The combination of IFN-γ and ADA, in a reviewed cut-off point, showed to be particularly useful to clinicians as their positive results combined prompts immediate treatment for TB while both negative results suggest further investigation.
Conflict of interest statement
The authors have declared that no competing interests exist.
Figures
Similar articles
-
Predominance of Th1 Immune Response in Pleural Effusion of Patients with Tuberculosis among Other Exudative Etiologies.J Clin Microbiol. 2019 Dec 23;58(1):e00927-19. doi: 10.1128/JCM.00927-19. Print 2019 Dec 23. J Clin Microbiol. 2019. PMID: 31619524 Free PMC article.
-
Combined detections of interleukin 27, interferon-γ, and adenosine deaminase in pleural effusion for diagnosis of tuberculous pleurisy.Chin Med J (Engl). 2013;126(17):3215-21. Chin Med J (Engl). 2013. PMID: 24033939
-
Clinical diagnostic utility of IP-10 and LAM antigen levels for the diagnosis of tuberculous pleural effusions in a high burden setting.PLoS One. 2009;4(3):e4689. doi: 10.1371/journal.pone.0004689. Epub 2009 Mar 11. PLoS One. 2009. PMID: 19277111 Free PMC article. Clinical Trial.
-
Use of pleural fluid levels of adenosine deaminase and interferon gamma in the diagnosis of tuberculous pleuritis.Curr Opin Pulm Med. 2010 Jul;16(4):367-75. doi: 10.1097/MCP.0b013e32833a7154. Curr Opin Pulm Med. 2010. PMID: 20473171 Review.
-
Adenosine deaminase and interferon gamma measurements for the diagnosis of tuberculous pleurisy: a meta-analysis.Int J Tuberc Lung Dis. 2003 Aug;7(8):777-86. Int J Tuberc Lung Dis. 2003. PMID: 12921155
Cited by
-
T-cell receptor and B-cell receptor repertoires profiling in pleural tuberculosis.Front Immunol. 2024 Nov 27;15:1473486. doi: 10.3389/fimmu.2024.1473486. eCollection 2024. Front Immunol. 2024. PMID: 39664375 Free PMC article.
-
Diagnostic Performance of Unstimulated IFN-γ (IRISA-TB) for Pleural Tuberculosis: A Prospective Study in South Africa and India.Open Forum Infect Dis. 2024 Sep 24;11(10):ofae533. doi: 10.1093/ofid/ofae533. eCollection 2024 Oct. Open Forum Infect Dis. 2024. PMID: 39431148 Free PMC article.
-
Comparative accuracy of pleural fluid unstimulated interferon-gamma and adenosine deaminase for diagnosing pleural tuberculosis: A systematic review and meta-analysis.PLoS One. 2021 Jun 24;16(6):e0253525. doi: 10.1371/journal.pone.0253525. eCollection 2021. PLoS One. 2021. PMID: 34166463 Free PMC article.
-
The tuberculous pleural effusion.Breathe (Sheff). 2023 Dec;19(4):230143. doi: 10.1183/20734735.0143-2023. Epub 2023 Dec 19. Breathe (Sheff). 2023. PMID: 38125799 Free PMC article. Review.
-
Application of Adenosine Deaminase and γ-Interferon Release Assay in Pleural Fluid for the Diagnosis of Tuberculous Pleural Effusion in Patients Over 40 Years Old.Infect Drug Resist. 2023 Feb 17;16:1009-1018. doi: 10.2147/IDR.S400838. eCollection 2023. Infect Drug Resist. 2023. PMID: 36824067 Free PMC article.
References
-
- World Health Organization. Global Tuberculosis Report 2016. Available in: http://www.who.int.tb. Accessed on June 15, 2017
-
- Lee LN, Chou CH, Wang JY, Hsu HL, Tsai TH, Jan IS, et al. Enzyme-linked immunospot assay for interferon-gamma in the diagnosis of tuberculosis pleurisy. Clin Microbiol Infect 2009; 15: 173–9 - PubMed
Publication types
MeSH terms
Substances
LinkOut - more resources
Full Text Sources
Other Literature Sources
Research Materials
