. 2018 Aug 27;16(8):e2004624.
doi: 10.1371/journal.pbio.2004624. eCollection 2018 Aug.

A high-throughput screen of real-time ATP levels in individual cells reveals mechanisms of energy failure

Affiliations

A high-throughput screen of real-time ATP levels in individual cells reveals mechanisms of energy failure

Bryce A Mendelsohn et al. PLoS Biol. .

Abstract

Insufficient or dysregulated energy metabolism may underlie diverse inherited and degenerative diseases, cancer, and even aging itself. ATP is the central energy carrier in cells, but critical pathways for regulating ATP levels are not systematically understood. We combined a pooled clustered regularly interspaced short palindromic repeats interference (CRISPRi) library enriched for mitochondrial genes, a fluorescent biosensor, and fluorescence-activated cell sorting (FACS) in a high-throughput genetic screen to assay ATP concentrations in live human cells. We identified genes not known to be involved in energy metabolism. Most mitochondrial ribosomal proteins are essential in maintaining ATP levels under respiratory conditions, and impaired respiration predicts poor growth. We also identified genes for which coenzyme Q10 (CoQ10) supplementation rescued ATP deficits caused by knockdown. These included CoQ10 biosynthetic genes associated with human disease and a subset of genes not linked to CoQ10 biosynthesis, indicating that increasing CoQ10 can preserve ATP in specific genetic contexts. This screening paradigm reveals mechanisms of metabolic control and genetic defects responsive to energy-based therapies.


Conflict of interest statement

The authors have declared that no competing interests exist.

Figures

Fig 1
Fig 1. A FRET-based ATP sensor compatible with flow cytometry.
(A) FRET/donor distributions of K562 cells stably expressing CFP-Venus ATP FRET sensor (AT1.03YEMK, blue) with CFP (donor) and Venus (acceptor) [7] or the modified Clover-mApple ATP sensor (red) with Clover (donor) and mApple (acceptor). CFP-Venus Dead (green) and Clover-mApple Dead (orange) are the corresponding ATP-binding–deficient mutant sensors. Tracings show the distribution of 2,500–4,500 cells. The experiment was repeated twice with similar results. Clover-mApple ATP produces a narrower distribution of FRET/donor values than CFP-Venus ATP, and the dead sensors had similar distributions. (B) FRET signal of COS cell lysates expressing the Clover-mApple ATP or Dead sensor, incubated with increasing ATP. The Clover-mApple ATP sensor was responsive to ATP concentrations up to approximately 6 mM, much higher than the CFP-Venus ATP sensor (S1H Fig). Data show mean ± SD (bars obscured by points); n = 3 wells/group. (C) Cell lysates of COS cells expressing the Clover-mApple-ATP sensor were incubated in buffer SH, with increasing pH and/or ATP. Data show mean ± SD; n = 4 wells/group. Increasing pH did not affect the ATP FRET signal at 1 mM. At 5 mM ATP, there was a small but significant association of increasing pH and FRET (p < 0.0001 by one-way ANOVA). Further information about this figure can be found in S1 Data. CFP, cyan fluorescent protein; COS, CV-1 (simian) in origin, and carrying the SV40 genetic material; FRET, fluorescence resonance energy transfer; mVenus, monomeric Venus.
Fig 2
Fig 2. Single-cell detection and sorting based on ATP content.
(A) Schema illustrating ATP FACS sorting protocol. K562 cells were transduced to stably express the dCas9-KRAB and then the ATP FRET sensor (or Dead sensor), and a small population was selected for dual expression by FACS. These cells were then expanded and transduced with a CRISPRi sgRNA lentiviral library so that each cell individually expressed one of approximately 28,000 sgRNAs. Cells were selected for expression of the sgRNA by puromycin for 4–5 days, allowed to recover from puromycin, and then exposed to substrate and drug conditions forcing ATP synthesis from glycolysis only (oligomycin and glucose) or oxidative phosphorylation only (2DG and pyruvate) 30 minutes prior to sorting. Cells were then sorted for 60 minutes. Cells in the lowest and highest ATP quartiles were isolated by flow cytometry, and the abundance of each sgRNA was quantified in the high- and low-ATP quartiles by deep sequencing. (B) Time course of ATP decline after incubation of cells with a glycolytic inhibitor (10 mM 2DG) and pyruvate (10 mM) to force reliance on respiration for ATP (“respiratory” conditions) or when both respiration and glycolysis were blocked (10 mM 2DG and 5 μM oligomycin) to prevent all ATP production. ATP was measured both by FRET with the Clover-mApple ATP sensor using flow cytometry (left y-axis, box and whisker plots; line = median; box = 25th–75th percentile; whisker = 5th–95th percentile) and by luciferase assay (right y-axis, lines, error bars ± SD not visible beyond the points). Both show similar relative extents and rates of ATP decline. Respiratory conditions produced a partial drop in ATP level that is stable for at least 75 minutes as measured by both FACS and luciferase (p < 0.0001 versus both control and blocked glycolysis/respiration groups at each time point after start by two-way ANOVA with Tukey multiple comparisons test; n = 6,024–21,295 cells/group for FACS; n = 3 samples/group for luciferase). The FRET experiments were repeated with similar results (S2A Fig). Further information about this figure can be found in S1 Data. 2DG, 2-deoxyglucose; CRISPRi, clustered regularly interspaced short palindromic repeats interference; dCas9, dead CRISPR-associated protein 9; FACS, fluorescence-activated cell sorting; FRET, fluorescence resonance energy transfer; KRAB, Kruppel-associated box; sgRNA, single guide RNA.
Fig 3
Fig 3. Critical role for mitochondrial protein synthesis genes in maintaining ATP under respiratory but not glycolytic conditions.
(A, B) Cells expressing an sgRNA from a mitochondrial-gene–enriched CRISPRi subgenome library with 10 sgRNAs/gene and either the ATP FRET sensor or Dead FRET sensor were placed in either (A) respiratory (10 mM 2DG and 10 mM pyruvate) or (B) glycolytic (5 μM oligomycin, 2 mM glucose and low-dose [3 mM] 2DG) conditions, and the cells were sorted by ATP concentration. Abundance of each sgRNA in the high- and low-FRET fractions was determined by deep sequencing, and the relative enrichment of each sgRNA in the high- versus low-ATP fraction determined. Black dots are individual gene phenotypes based on the average of the 3 sgRNAs with the largest phenotypes, averaged per sgRNA over 3 independent experiments. Grey dots are simulated genes consisting of random combinations of non-targeting sgRNAs. For each gene, the y-axis shows fold-enrichment in high versus low-ATP fractions for cells expressing the ATP FRET sensor, and the x-axis shows the corresponding fold-enrichment in high versus low-ATP fractions with the Dead FRET sensor. (C) Comparison of the ATP FRET phenotypes (3 strongest sgRNAs averaged over 3 repetitions) for genes considered “hits” in both respiratory and glycolytic conditions (see S3 Table). x-axis = glycolytic condition; y-axis = respiratory condition. Note that no genes that decreased ATP in the respiratory condition when knocked down also decreased ATP in the glycolytic condition, and knockdown of many genes decreasing ATP in the respiratory condition protected ATP in the glycolytic condition. (D) Fold-enrichment of individual genes in the high- versus low-ATP fractions (by FRET, y-axis) for cells expressing the ATP FRET sensor, with each point as the mean enrichment of the 3 sgRNAs with the largest fold-enrichment magnitudes, for glycolytic and respiratory conditions (also shown in panel A and B). Genes are grouped by general function, including motility, trafficking, “mito protein synth,” “resp chain,” and “other mito.” The glycolytic condition is on top and the respiratory condition below. Also presented are simulated genes of non-targeting sgRNAs (simulated) and mitochondrial protein synthesis gene knockdown by the Dead FRET sensor. Further information about this figure can be found in S1 Table. 2DG, 2-deoxyglucose; CRISPRi, clustered regularly interspaced short palindromic repeats interference; FRET, fluorescence resonance energy transfer; mito protein synth, mitochondrial protein synthesis; other mito, other mitochondrial functions; resp chain, respiratory chain; sgRNA, single guide RNA.
Fig 4
Fig 4. Mitochondrial pathways identified as critical to maintaining ATP.
Genes identified as hits that decrease ATP when knocked down in the respiratory condition are grouped by their function within the mitochondria. Genes encoding components of the mitochondrial ribosomal subunits or other functions in transcription/translation were enriched among hits. Within the respiratory chain, genes encoding components of complex IV were enriched. Genes that, when knocked down, increased ATP in the glycolytic condition are in red lettering. Genes listed in OMIM (omim.org) as known to cause human mitochondrial disease are highlighted in yellow. Within each functional category, genes are arranged in alphabetical order. OMIM, Online Mendelian Inheritance in Man.
Fig 5
Fig 5. Overlap with reported gene knockdown screens on mitochondrial function.
Venn diagram comparing low-ATP hits (Lanning and colleagues) or lethal hits (Arroyo and colleagues) from 2 related mitochondrial function screens [4,18] to ours in the respiratory condition. This analysis only included genes that were represented in all 3 screens. Hits examining the impact of glucose versus galactose substrate on cell death were derived from Arroyo and colleagues. S3 Table (FDR 0.3, the most inclusive cutoff). Hits examining the impact of 10 mM pyruvate on ATP levels by luciferase assay were derived from Lanning and colleagues S3 Table listing genes that altered ATP by >25%. FDR, false discovery rate.
Fig 6
Fig 6. Validation and characterization of selected low-ATP hits in respiratory conditions.
(A) K562 lines were generated expressing the dCas9-KRAB, Clover-mApple ATP FRET sensor, and 1 sgRNA against MRPL10 or non-targeting control guides (Cont1, Cont2), and ATP levels were assessed by flow cytometry. Compared with the ATP level in basal conditions, MRPL10 knockdown decreased ATP to a greater extent in respiratory conditions (box and whisker plots; line = median; box = 25th–75th percentile; whisker = 5th–95th percentile). In contrast, in glycolytic conditions, ATP levels dropped similarly in MRPL10 and control groups. N = 3,128–11,971 cells examined per group for FACS. ***p < 0.001 versus both corresponding control groups by two-way ANOVA with Tukey multiple comparisons test. (B) Knockdown of MRPL10 in K562 cells also decreased ATP levels by luciferase to a greater extent in respiratory conditions. In contrast, in glycolytic conditions, ATP levels again dropped similarly in MRPL10 and control groups. Data show mean ± SEM; N = 4 wells per group from 2 independent experiments for luciferase. **p < 0.01 versus both corresponding control groups by one-way ANOVA with Dunnett multiple comparisons test. (C) K562 cells expressing dCas9-KRAB were stably transduced with a single sgRNA corresponding to the indicated gene, identified as reducing ATP in the primary FRET-based screen. Cells were selected for sgRNA transduction as in the primary screen, allowed to recover, and then acutely incubated in respiratory or glycolytic conditions as in the primary screen. ATP concentration was measured by luciferase (CellTiter Glo 2.0). Bars represent ATP levels in drug/substrate treatment (respiratory or glycolytic) relative to cells untreated for the same time period from the same pool of cells. *p ≤ 0.05; **p ≤ 0.01; ***p ≤ 0.001. Error bars are mean ± SEM; N = 10–32 wells/group, compiled from 2–4 experiments per cell line. (D, E) OCR (aerobic respiration rate) and ECAR (a surrogate of glycolysis) in K562 lines were measured using a 96-well Seahorse Extracellular Flux Analyzer. Arrows show the additions of the mitochondrial uncoupler FCCP (1 μM), the ATP synthase inhibitor oligomycin (1 μM), or the mitochondrial complex I inhibitor rotenone (1 μM). Knocking down of COX11, KPNB1, PDSS1, PDSS2, or ATP5MPL significantly decreased maximal respiration (after FCCP). Stars in legend box indicate significant difference of maximal respiration after FCCP (panel D). Oligomycin and rotenone additions similarly decreased OCR in all lines (panel E), indicating similar fractions of basal oxygen consumption devoted to mitochondrial respiration (oligomycin) and nonmitochondrial consumption (rotenone). Data are compiled from 4 experiments; n = 6–18 wells per group. Error bars represent SEM. NS, p > 0.05; *p < 0.005; **p < 0.01; ***p < 0.001; using one-way ANOVA with Dunnett multiple comparisons test. Further information about this figure can be found in S1 Data. Cont, control; dCas9, dead CRISPR-associated protein 9; ECAR, extracellular acidification rate; FACS, fluorescence-activated cell sorting; FCCP, carbonyl cyanide-4-(trifluoromethoxy)phenylhydrazone; FRET, fluorescence resonance energy transfer; KRAB, Kruppel-associated box; NS, not significant; OCR, oxygen consumption rate; sgRNA, single guide RNA.
Fig 7
Fig 7. ATP from mitochondria promotes but is not always required for cell growth.
(A, B) Genetic impact on growth can be separated as energy dependent and energy independent. ATP phenotypes in different metabolic contexts (y-axis, same data as in Fig 3) compared to growth phenotypes under basal conditions (x-axis, from Gilbert and colleagues 2014, S3 Table, column B) with the same CRISPRi library in the same K562 cell line. (A) When GROWTHbasGilbert was compared to ATPresp, genes encoding MRP subunits (purple squares) and MPI proteins (orange diamonds) had a strong positive correlation (6.26 ± 0.945 [p < 0.0001 versus null hypothesis] and 3.78 ± 0.163 [p = 0.0302], respectively) (i.e., among these gene knockdowns, decreasing ATP correlated with decreasing growth). Genes encoding cytosolic ribosomal subunits (CRP, green triangles) showed no correlation (−0.693 ± 0.371 [NS]). (B) When GROWTHbasGilbert was compared to ATPglyc, all 3 groups had negative slopes (MRP [−1.508 ± 0.503; p = 0.0039], MPI [−2.02 ± 0.962; p = 0.0474], and CRP genes [−1.91 ± 0.403; p < 0.0001]). (C, D) Genetic impact on growth is dependent on metabolic context. K562 cells expressing the CRISPRi library were grown in media favoring respiration or glycolysis, and the genes enriched and depleted in each metabolic condition were determined. (C) In respiratory conditions, when GROWTHresp was compared to ATPresp, MRP (purple squares) and MPI (orange diamonds) genes had strong positive slopes (0.593 ± 0.164 [p = 0.0006] and 0.851 ± 0.252 [p = 0.0027], respectively, by F-test), and CRP genes (green triangles) did not (−0.0511 ± 0.1011; p = 0.6157). Several genes had low ATP but normal growth (red). (D) Under glycolytic conditions, when GROWTHglyc was compared to ATPglyc, MRP, MPI, and CRP did not have significant slopes (0.060 ± 0.0833 [p = 0.471], −0.176 ± 0.135 [p = 0.587], and −0.061 ± 0.111 [p = 0.205], respectively). Further information about this figure can be found in S1 Data. ATPgly, ATP levels under glycolytic conditions; ATPresp, ATP levels under respiratory conditions; CRISPRi, clustered regularly interspaced short palindromic repeats interference; CRP, cytosolic ribosomal protein; GROWTHbasGilbert,; GROWTHglyc, growth under glycolytic conditions; GROWTHresp, growth under respiratory conditions; MPI, mitochondrial protein import; MRP, mitochondrial ribosomal protein; NS, not significant.
Fig 8
Fig 8. Identification of genes responsive to therapeutic CoQ10.
(A) CoQ10 rescue of ATP in respiratory conditions was assessed with a mini-library of sgRNAs. Cells were pre-incubated with 50 μM CoQ10 for 5 days and then placed under respiratory conditions before sorting. Four genes showed statistically significant improvement in ATP levels (difference of untreated and CoQ10-treated ATP phenotype). Black bars indicate untreated ATP phenotypes, and gray bars show the ATP phenotype with CoQ10. PDSS2, COQ2, and PDSS1 have biosynthetic roles in CoQ10, and CoQ10 blocks the decrease in ATP from knocking down these genes. CoQ10 also significantly blocked the low-ATP phenotype of COX11, which has no known CoQ10 biosynthetic role. Data from 2 experiments, 1–2 guides studied per gene, 1 million cells sorted per group. ***p < 0.001 versus non-targeting guides (with a phenotype of 0 and no change in response to CoQ10) by one-way ANOVA with Dunnett multiple comparisons test. (B) Plot of genes identified as decreasing ATP in the initial screen for rescue with CoQ10 supplementation. Genes that decreased ATP in the respiratory screen were reanalyzed with and without supplementation with CoQ10. The positive (rescue) portion of the graph is shown. x-Axis is fold-rescue by CoQ10 (phenotype in CoQ10 minus phenotype in vehicle). y-Axis is the -log10 of the p-value (t test on null hypothesis that the rescue was 0) based on the multiple sgRNAs tested for that gene. The figure consists of 3 repetitions of the subgenome library screen with CoQ10 and 2 without. Genes showing strong rescue with CoQ10 (either having a t test p-value of <0.05 and rescue larger than 1 SD from the average rescue of non-targeting guides, or a t test p-value of less than 0.1 and a rescue larger than 2 SDs from the average rescue of non-targeting guides) are labeled with red squares. CoQ10 biosynthetic genes are labelled with red text. Other genes that were investigated in other parts of this figure are labelled with hollow circles and blue text. (C) Rescue of low ATP by CoQ10 as measured by luciferase. K562 cells expressing dCas9-KRAB and a single sgRNA were placed in respiratory or glycolytic conditions as in the primary screen. ATP concentrations were measured by luciferase as in Fig 6. Data show mean ± SEM; N = 32 wells per group compiled from 4 independent experiments. *p < 0.05; ***p < 0.001 between untreated and CoQ10-treated conditions by two-way ANOVA with Dunnett multiple comparisons test. (D) K562 cells expressing dCas9-KRAB and a single sgRNA were collected, and total CoQ10 and CoQ10H2 levels were determined by HPLC and mass spectrometry with and without supplementation of 50 μM exogenous CoQ10 in the cell culture medium. The same cells assayed for total CoQ10 were also examined for the fraction of total CoQ10 in the oxidized state with and without CoQ10 supplementation. Untreated CoQ10 total pool sizes were compared with the untreated non-targeting guide by one-way ANOVA with Dunnett multiple comparison correction. The effect of CoQ10 treatment on total pool size and CoQ10 pool oxidation was analyzed within each gene knockdown line by two-way ANOVA with Dunnett multiple comparison correction. Data show mean ± SEM; N = 7–9 replicates per group compiled from 3 independent experiments. *p < 0.05; **p < 0.01; ***p < 0.001. Further information about this figure can be found in S1 Data. CoQ10, coenzyme Q10; dCas9, dead CRISPR-associated protein 9; HPLC, high-performance liquid chromatography; KRAB, Kruppel-associated box; NS, not significant; sgRNA, single guide RNA.

Comment in

References

    1. Pathak D, Berthet A, Nakamura K. Energy failure: does it contribute to neurodegeneration? Ann Neurol. 2013;74(4):506–16. 10.1002/ana.24014 - DOI - PMC - PubMed
    1. Ganapathy-Kanniappan S, Geschwind JF. Tumor glycolysis as a target for cancer therapy: progress and prospects. Mol Cancer. 2013;12:152 10.1186/1476-4598-12-152 - DOI - PMC - PubMed
    1. Koopman WJ, Willems PH, Smeitink JA. Monogenic mitochondrial disorders. N Engl J Med. 2012;366(12):1132–41. 10.1056/NEJMra1012478 - DOI - PubMed
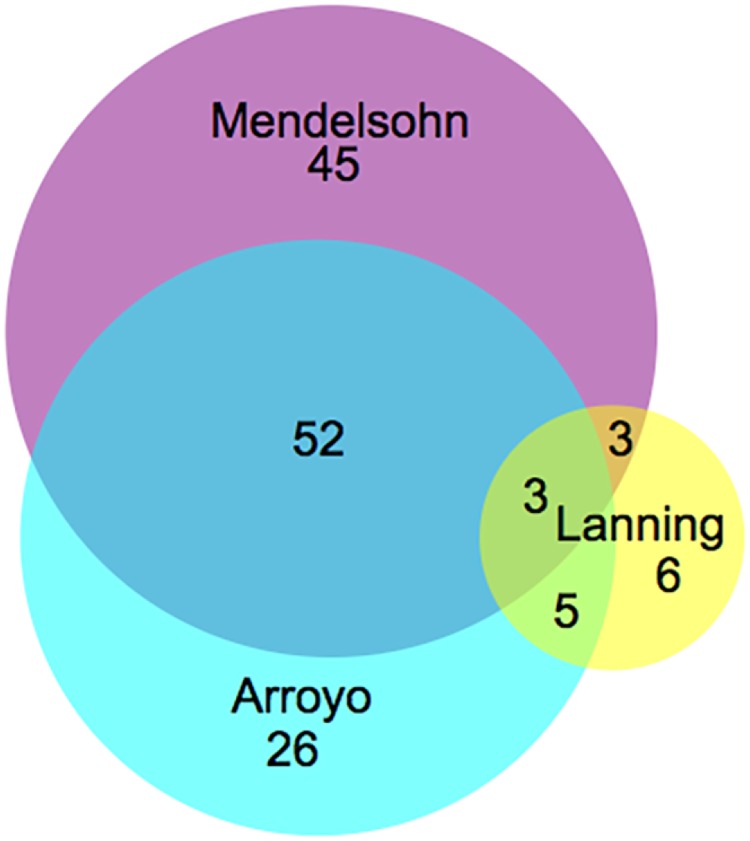
    1. Lanning NJ, Looyenga BD, Kauffman AL, Niemi NM, Sudderth J, Deberardinis RJ, et al. A Mitochondrial RNAi Screen Defines Cellular Bioenergetic Determinants and Identifies an Adenylate Kinase as a Key Regulator of ATP Levels. Cell Rep. 2014;7(3):907–17. 10.1016/j.celrep.2014.03.065 - DOI - PMC - PubMed
    1. Doimo M, Desbats MA, Cerqua C, Cassina M, Trevisson E, Salviati L. Genetics of coenzyme q10 deficiency. Mol Syndromol. 2014;5(3–4):156–62. 10.1159/000362826 - DOI - PMC - PubMed

Publication types

MeSH terms