. 2018 Aug 27;13(8):e0202402.
doi: 10.1371/journal.pone.0202402. eCollection 2018.

Errors in protein synthesis increase the level of saturated fatty acids and affect the overall lipid profiles of yeast

Affiliations

Errors in protein synthesis increase the level of saturated fatty acids and affect the overall lipid profiles of yeast

Ana Rita D Araújo et al. PLoS One. .

Abstract

The occurrence of protein synthesis errors (mistranslation) above the typical mean mistranslation level of 10-4 is mostly deleterious to yeast, zebrafish and mammal cells. Previous yeast studies have shown that mistranslation affects fitness and deregulates genes related to lipid metabolism, but there is no experimental proof that such errors alter yeast lipid profiles. We engineered yeast strains to misincorporate serine at alanine and glycine sites on a global scale and evaluated the putative effects on the lipidome. Lipids from whole cells were extracted and analysed by thin layer chromatography (TLC), liquid chromatography-mass spectrometry(LC-MS) and gas chromatography (GC). Oxidative damage, fatty acid desaturation and membrane fluidity changes were screened to identify putative alterations in lipid profiles in both logarithmic (fermentative) and post-diauxic shift (respiratory) phases. There were alterations in several lipid classes, namely lyso-phosphatidylcholine, phosphatidic acid, phosphatidylethanolamine, phosphatidylinositol, phosphatidylserine, and triglyceride, and in the fatty acid profiles, namely C16:1, C16:0, C18:1 and C18:0. Overall, the relative content of lipid species with saturated FA increased in detriment of those with unsaturated fatty acids. The expression of the OLE1 mRNA was deregulated, but phospholipid fluidity changes were not observed. These data expand current knowledge of mistranslation biology and highlight its putative roles in human diseases.


Conflict of interest statement

The authors have declared that no competing interests exist.

Figures
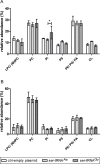
Fig 1
Fig 1. Phospholipid (PL) classes profiles are not affected in mistranslating strains.
Relative abundance of phospholipid classes in logarithmic (A) and post-diauxic shift (B) phases. Phospholipids were fractionated by TLC and their identification was achieved by comparison with PL standards. MIPC and IPC were confirmed by direct infusion-ESI-MSn analysis. Phospholipid classes were quantified by the phosphorus assay. Data were normalized against the sum of all values and are presented as mean ± standard deviation of three biological replicates. Statistical analysis was performed by two-way analysis of variance (ANOVA) followed by Bonferroni's multiple comparison test (*P<0.05).
Fig 2
Fig 2. Differences in phospholipid (PL) molecular species profiles in logarithmic phase.
Relative amounts of the molecular species that showed significant differences within each PL class–PA (A), PE (B), LPC (C), PI (D) and PS (E)–identified after comparison of the phospholipidomes from the mistranslating and control strains, and among each other, analyzed by HPLC-MS in negative mode (A, B, D, E) and positive mode (C. PL molecular species are identified as C:N (carbon number:number of double bonds). Data were normalized against the sum of all the reconstructed areas considered for each class and presented as mean ± standard deviation of three biological replicates. Statistical analysis was performed by two-way analysis of variance (ANOVA) followed by Bonferroni's multiple comparison test (***P<0.001 **P<0.01; *P<0.05). For the profile of all molecular species in each PL class see S3 Fig.
Fig 3
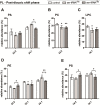
Fig 3. Differences in PL molecular species profile in PDS phase.
Relative amounts of the molecular species that showed significant differences within each PL class–PA (A), PC (B), LPC (C), PE (D) and PS (E)–identified after comparison of phospholipidomes from the mistranslating and the control strains, and among each other, analyzed by HPLC-MS in negative mode (A, D, E) and positive mode (A, C). PL molecular species are identified as C:N (carbon number:number of double bonds). Data were normalized against the sum of all the reconstructed areas considered for each class and presented as mean ± standard deviation of three biological replicates. Statistical analysis was performed by two-way analysis of variance (ANOVA) followed by Bonferroni's multiple comparison test (***P<0.001 **P<0.01; *P<0.05). For the profile of all molecular species in each PL class see S4 Fig.
Fig 4
Fig 4. Differences in TG molecular species profile in logarithmic and PDS growth phases.
Distribution of the relevant molecular species of TG in logarithmic (A) and post-diauxic shift phase (B) was altered. Data is normalized against the sum of the reconstructed areas considered for each phase and presented as mean ± standard deviation of three biological replicates. Statistical analysis was performed by two-way analysis of variance (ANOVA) followed by Bonferroni's multiple comparison test (***P<0.001 **P<0.01; *P<0.05). For the profile of all TG molecular species see S5 Fig.
Fig 5
Fig 5. Assessment of oxidative stress markers in PDS phase.
(A) Quantification of lipid hydroperoxides was achieved by performing the FOX II assay. Data were normalized against the averaged values of the control strain and are presented as mean ± standard deviation of duplicates of 3 biological replicates. (B) Total intracellular ROS and the superoxide anion alone were measured by flow cytometry using the DHR123 and DHE probes, respectively. Data are expressed as median values ± standard deviation of three biological replicates. (C) Enzymatic activities of cytosolic catalase and superoxide dismutase (SOD), and mitochondrial SOD were determined in situ after native-PAGE. Data are expressed as mean values ± standard deviation of three biological replicates assessed in two independent experiments. Statistical significance in all experiments was determined by one-way ANOVA, followed by Bonferroni’s multiple comparison test (*P<0.05; **P<0.01; ***P<0.001).
Fig 6
Fig 6. Membrane fluidity is not altered in PDS phase despite the upregulation of the Δ9 fatty acid desaturase-coding gene.
(A) Quantitative real-time PCR analysis of expression levels of OLE1 gene in logarithmic and PDS phases were assessed. Target/reference ratios were calculated using the mathematical model determined by Pfaffl (2001) [65]. Actin was used as the reference gene. Data are expressed as mean values ± standard deviation of three biological replicates. Statistical analysis was performed by one-way analysis of variance (ANOVA) followed by Dunnett's multiple comparison test (**P<0.01). (B) Membrane fluidity was qualitatively assessed through determination of the thermograms of fluorescence polarization of DPH in liposomes prepared with the PL extracts of S. cerevisiae strains. Liposomes were prepared with PL extracts and incubated with DPH. The depicted graph represents 1n and is illustrative of the observations in two biological replicates.
Fig 7
Fig 7. Phospholipid synthesis pathways in S. cerevisiae.
This simplified scheme shows the biosynthesis routes of the PL analyzed in this study. The dashed and solid lines represent the Kennedy and the CDP-DG pathways, respectively. Cho, Choline. Etn, Ethanolamine; Ino, Inositol.

Similar articles

Cited by

References

    1. Allan Drummond D, Wilke CO. The evolutionary consequences of erroneous protein synthesis. Nat Rev Genet. 2009;10: 715–724. 10.1038/nrg2662 - DOI - PMC - PubMed
    1. Pouplana LR de, Santos MAS, Zhu J-H, Farabaugh PJ, Javid B. Protein mistranslation: friend or foe? Trends Biochem Sci. Elsevier; 2014; 10.1016/j.tibs.2014.06.002 - DOI - PubMed
    1. Buchberger A, Bukau B, Sommer T. Protein quality control in the cytosol and the endoplasmic reticulum: brothers in arms. Mol Cell. 2010;40: 238–52. 10.1016/j.molcel.2010.10.001 - DOI - PubMed
    1. Baker BM, Haynes CM. Mitochondrial protein quality control during biogenesis and aging. Trends Biochem Sci. 2011;36: 254–61. 10.1016/j.tibs.2011.01.004 - DOI - PubMed
    1. Shoffner JM, Lott MT, Lezza AMS, Seibel P, Ballinger SW, Wallace DC. Myoclonic epilepsy and ragged-red fiber disease (MERRF) is associated with a mitochondrial DNA tRNALys mutation. Cell. 1990;61: 931–937. 10.1016/0092-8674(90)90059-N - DOI - PubMed

Publication types

MeSH terms

LinkOut - more resources