. 2018 Oct 19;430(21):4209-4229.
doi: 10.1016/j.jmb.2018.08.017. Epub 2018 Aug 24.

Structure of a Novel Dimeric SET Domain Methyltransferase that Regulates Cell Motility

Affiliations

Structure of a Novel Dimeric SET Domain Methyltransferase that Regulates Cell Motility

Yulia Pivovarova et al. J Mol Biol. .

Abstract

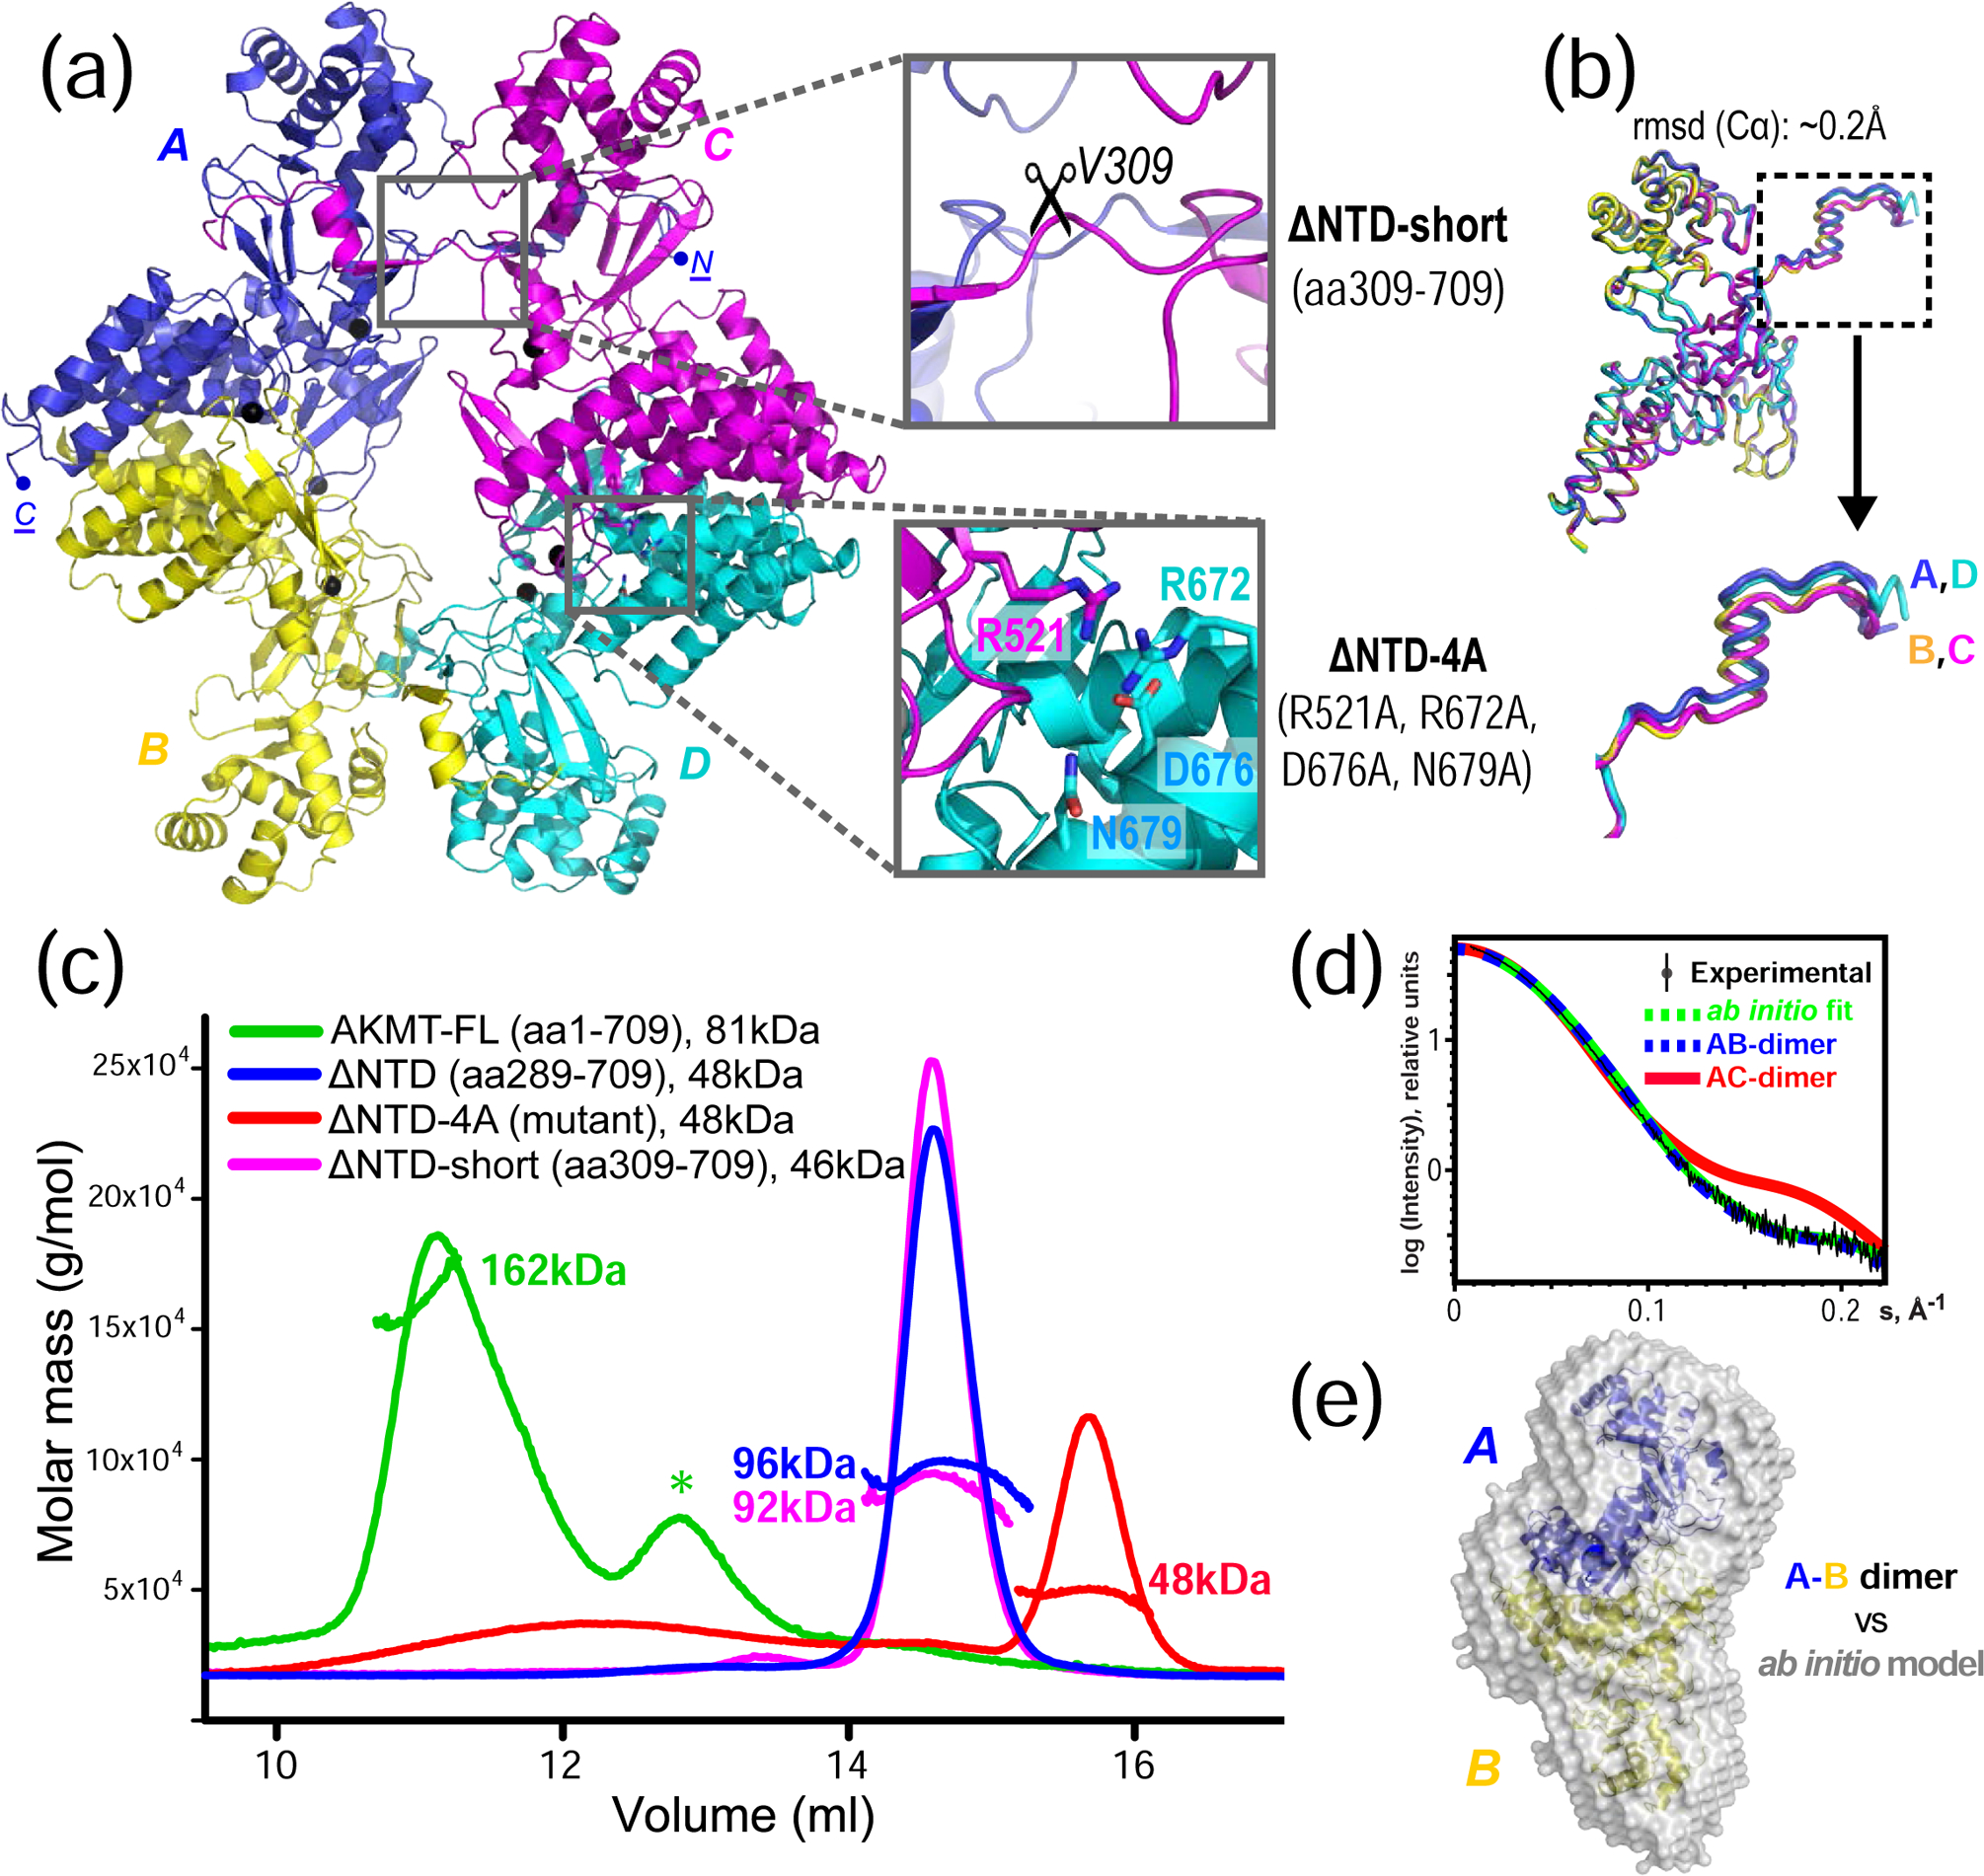
Lysine methyltransferases (KMTs) were initially associated with transcriptional control through their methylation of histones and other nuclear proteins, but have since been found to regulate many other cellular activities. The apical complex lysine (K) methyltransferase (AKMT) of the human parasite Toxoplasma gondii was recently shown to play a critical role in regulating cellular motility. Here we report a 2.1-Å resolution crystal structure of the conserved and functional C-terminal portion (aa289-709) of T. gondii AKMT. AKMT dimerizes via a unique intermolecular interface mediated by the C-terminal tetratricopeptide repeat-like domain together with a specific zinc-binding motif that is absent from all other KMTs. Disruption of AKMT dimerization impaired both its enzyme activity and parasite egress from infected host cells in vivo. Structural comparisons reveal that AKMT is related to the KMTs in the SMYD family, with, however, a number of distinct structural features in addition to the unusual dimerization interface. These features are conserved among the apicomplexan parasites and their free-living relatives, but not found in any known KMTs in animals. AKMT therefore is the founding member of a new subclass of KMT that has important implications for the evolution of the apicomplexans.

Keywords: AKMT; egress; lysine methylation; parasite.


Conflict of interest statement

Conflict of interest

The authors declare that they have no conflict of interest.

Figures

Fig. 1.
Fig. 1.. Crystal structure of T. gondii AKMT.
(a) Schematic showing the domain arrangement of AKMT. The folded part used for structure determination (aa290–709) contains four predicted domains. The AKMT-specific insertion is denoted as “ASI”. (b) Structure of AKMT with the same color scheme as in (a). All α-helices and β-strands are labeled, and zinc ions are shown as black spheres. (c) Secondary structure diagram of AKMT with the same color schemes for the domains as in (a). (d) Stereo view of a part of the 2Fo-Fc map contoured at 1.5 σ. (e) 2Fo-Fc maps (1.0 σ) around the two bound zinc ions in AKMT with all cysteine residues labelled. The inserts show the anomalous difference maps contoured at 6.0 σ for the corresponding zinc ions.
Fig. 2.
Fig. 2.. AKMT is a homodimer.
(a) The structural model of AKMT contains four molecules (A, B, C & D, differently colored) per asymmetric unit. Enlarged boxes show the two types of intermolecular contacts. These were disrupted separately to identify the native interaction, either by deleting the N-terminal extension (ΔNTD-short, aa309–709) or by mutating the four residues that form an extensive hydrogen bond network in the vertical dimer (ΔNTD-4A). (b) Superposition of the four molecules in the asymmetric unit, which shows a RMSD of ~0.2 Å for the aligned Cα atoms. The slight rigid-body shift of the N-termini (boxed) is shown in an enlarged view. (c) SLS data of full-length (FL), truncated, and mutated AKMT. Except for the ΔNTD-4A mutant (red), all other constructs form dimers. The asterisk (*) marks impurities co-purified with the full-length protein. (d) Low-angle region of the SAXS curve of AKMT-ΔNTD (black) overlaid with theoretical scattering curves for the N-terminally mediated A-C dimer (red) and the C-terminally mediated A-B dimer (blue) calculated in CRYSOL. The green curve represents the simulated scattering from ab initio model computed in DAMMIF. (e) The ab initio low resolution model reconstructed in DAMAVER by selecting and averaging the most probable models generated in 10 cycles of DAMMIF. The mean normalized spatial discrepancy (NSD) is 0.538. The N-terminal fragments (aa289–309) in the A-B dimer were rebuilt after rearranging the swapped domains. The model is shown superimposed on a ribbon diagram of the A-B dimer.
Fig. 3.
Fig. 3.. Intermolecular interactions in the AKMT homodimer.
(a) Homodimer of AKMT with chain A shown in ribbon diagrams and chain B in a semi-transparent surface plot. Insets show the enlarged views of the two bound zinc ions in chain A. (b) Sequence alignment of the ASI motifs in AKMT and orthologs. The four conserved cysteines that coordinate zinc binding are indicated with open arrowheads. (c) Ribbon diagram of AKMT monomer with individual domains colored as in (a). (d) Electrostatic plot showing the hand-like structure with the C-terminal end of the protein forming the “thumb”, the ASI motif forming the “fingers”, and the central helices of the TPR-like domain forming the “palm”. (e) “Handshake”-like dimer of AKMT. (f) Intermolecular interactions in the AKMT homodimer. Residues contributing to dimer formation are plotted with DIMPLOT in the LigPlot plus suite [66]. Side chains of residues involved in hydrogen bond formation are shown as ball-and-stick. Oxygen, nitrogen and carbon atoms are colored in red, blue, and black, respectively. Water molecules mediating inter-molecular hydrogen bond formation are shown as cyan-colored spheres. Green dotted lines indicate hydrogen bonds, with the length of the bonds shown on top of the lines. Non-bonded residues involved in hydrophobic interactions are shown as spoked arcs.
Fig. 4.
Fig. 4.. Cofactor binding and biophysical characterizations of AKMT.
(a) ITC binding curves of wild-type full-length and AKMT-ΔNTD with the cofactor SAM or the analog SFG. (b) ITC binding curves of AKMT-ΔNTD-4A with SAM or SFG. (c) Pymol B-factor putty representation of the AKMT dimer. Width of the tubes, which is proportional to the values of the B-factors of each residue, indicates the dynamics of the local structure. Shown in the inset is an enlarged view of the highly rigid region around residue H447 that bridges the putative cofactor binding site to the zinc-bound ASI motif. The cofactor SAM (shown in yellow sticks) is based on superposition of SAM bound SMYD2 structure (5ARG.pdb) onto the AKMT structure. (d) Deconvoluted MS spectrum of AKMT-ΔNTD in the denatured state. The measured molecular mass (48202.54 Da) is in excellent agreement with the theoretical value calculated from the primary sequence of the protein (48202.76 Da). (e) Mass determination of SGF-bound AKMT-ΔNTD in at the native state. Based on the calculated masses, each of the three peaks could be mapped to a subspecies of the complex, with the majority being the homodimer loaded with four zinc ions and two SFG molecules (2×SFG). (f) Collision-induced dissociation of native SFG-bound AKMT-ΔNTD analyzed by tandem mass spectrometry. Increasing trap collision energy (CE) led to dissociation of SFG from the dimer, but did not affect stability of the zinc-bound dimer. (g) MS spectrum of AKMT-ΔNTD-4A mutant acquired under denaturing conditions. Measured mass of 47945.31 Da closely matches the calculated value, 47945.01 Da. (h) Native MS analyses of AKMT-ΔNTD-4A in the apo form proves the monomeric state of the mutant. (i) CD spectra of AKMT-ΔNTD and AKMT-ΔNTD-4A. (j) Melting curves of various AKMT constructs by the DSF assay. AKMT-FL and -ΔNTD have a similar Tm, whereas that of the monomeric mutant is substantially lower.
Fig. 5.
Fig. 5.. Functional defect of AKMT-ΔNTD-4A and AKMT-ΔNTD revealed by in vitro methylation and in vivo egress assays.
(a) Methylation assay to compare the activity of AKMT-ΔNTD-4A and AKMT-ΔNTD. Top panels: Dot-blot of tritium signal (left) and total protein staining by amido black (right). Bottom panel: X-axis shows time (in minutes) of reactions spent at room temperature. Y-axis shows “normalized tritium signal” (in arbitrary units). To generate the normalized tritium signal, the signal from the Typhoon scan of the phosphorimager was first normalized against the corresponding protein staining by amido black to correct for variations in protein retention on the dot-blot to generate “retention corrected tritium signal”. Individual retention corrected tritium signals were then normalized against the sum of corrected signals of reactions in the same experiment. The error bars represent ±2 standard deviations of three independent experiments. (b) WT: Δakmt parasites expressing eGFP-AKMT-WT. 4A: Δakmt parasites expressing eGFP-AKMT-4A. Images selected from time-lapse imaging of calcium ionophore (A23187)-induced egress of Δakmt parasites expressing eGFP-AKMT-WT (top panels) or eGFP-AKMT-4A (bottom panels). Inset images (4X) include the apical region from which the eGFP-AKMT-WT or eGFPAKMT-4A translocates after the addition of A23187. Inset graphs are line plots of integrated intensity over the region indicated by the dotted lines (X-axis: distance in microns; Y-axis: intensity). The elapsed time (min:sec) since A23187 addition is indicated on each panel. The parasites shown here initiated egress around 2:09 for eGFP-AKMT-WT- and 9:19 for eGF-PAKMT-4A-expressing parasites. Fluorescence and DIC/fluorescence overlay images are shown. The red dotted circle in the overlay indicates untransfected Δakmt parasites. (c) Bargraph of percentage of vacuoles that egressed within ~11 min of A23187 addition. The average is indicated next to the bar. The error-bars represent the standard deviation (SD). The number of individual dishes (n) and the total number of vacuoles (v) examined were indicated underneath the bars. The p-values from unpaired and one-tailed Student’s t-test were indicated above the bars; n.s., non-significance. (d) Box plot of the egress response time for vacuoles containing eGFP-AKMT-WT or eGFP-AKMT-4A transfected parasites that did egress. The central mark, upper and lower edges of the box, and upper and lower whiskers denote the median, 75th and 25th percentiles, and the maximum and minimum egress time respectively. The p-value from unpaired and one-tailed Student’s t-test was indicated above the boxes.
Fig. 6.
Fig. 6.. AKMT forms a novel homodimer mediated by both its ASI motif and TPR-like domain.
(a) Ribbon diagram that shows the side-by-side arrangement of the SET domains in the vSET homodimer. (b) Crystal structure of the AKMT homodimer. (c) An extracted view of the dimeric interface formed by the ASI motif and the TPR-like domain of AKMT. (d) The same structure as in (c) but with both ASI motifs deleted. The two TPR-like domains are shown in rainbow coloration to demonstrate the extensive contacts across the two antiparallelly arranged structures. Notably, without ASI motifs, the buried interface area is reduced by ~50%, and in the meantime ΔiG increases significantly, suggesting a substantial drop in structural stability.
Fig. 7.
Fig. 7.. Structural comparison of AKMT with SMYD proteins.
(a) Schematics of the domain organization of AKMT and SMYD1–3. (b) Ribbon diagrams of AKMT, SMYD1 (3N71.pdb), SMYD2 (5ARG.pdb), and SMYD3 (5EX0.pdb), in the same color scheme as in (A). All bound zinc ions are shown as black spheres. The putative cofactor and substrate binding sites in AKMT are marked by a red star and a black arrow, respectively. (c) Direct structural comparison between AKMT and SMYD3, with the “stirring” loop in AKMT colored in blue and the counterpart in SMYD3 in yellow. Superposition of AKMT on SMYD3 is based on the rigid body around their post-SET domains (see Fig. S7B–E). The “stirring” loops are better visualized in the enlarged view where potential clashes between the loop of AKMT and the MYND domain of SMYD3 are indicated by a dashed circle. The loops are also shown in isolation next to the inset to clearly illustrate the dramatic flip (black arrow). (d) Close-up view of the “stirring” loops in AKMT and SMYD1–3 structures, with regular β strands shown in flat sheets and irregular structures in loops. SMYD1, 2, 3, and AKMT are colored green, magenta, yellow, and blue, respectively. (e) Sequence alignment of the “stirring” loops of AKMT orthologs (boxed) and SMYD1–3. (f) Overlay of the AKMT and SMYD1–3 structures to demonstrate the variation of their inter-lobe grooves. The structures are superimposed on the C-terminal rigid body (see Fig. S7f–h).
Fig. 8.
Fig. 8.. Comparison of dimeric AKMT with monomeric SMYD1–3.
Two orthogonal views of the electrostatic plots of AKMT monomer (a), SMYD1 (b), SMYD2 (c), and SMYD3 (d). In contrast to the structurally and electrostatically complementary hand-like structure in AKMT, the corresponding surfaces in all SMYD proteins are unfavorable for intermolecular interactions. All plots were made using PyMOL (the PyMOL Molecular Graphics System, Version 2.0 Schrödinger, LLC).

References

    1. Santos-Rosa H, et al. , Active genes are tri-methylated at K4 of histone H3. Nature, 2002. 419(6905): p. 407–11. - PubMed
    1. Schaft D, et al. , The histone 3 lysine 36 methyltransferase, SET2, is involved in transcriptional elongation. Nucleic Acids Res, 2003. 31(10): p. 2475–82. - PMC - PubMed
    1. Krogan NJ, et al. , Methylation of histone H3 by Set2 in Saccharomyces cerevisiae is linked to transcriptional elongation by RNA polymerase II. Mol Cell Biol, 2003. 23(12): p. 4207–18. - PMC - PubMed
    1. Huang J and Berger SL, The emerging field of dynamic lysine methylation of non-histone proteins. Curr Opin Genet Dev, 2008. 18(2): p. 152–8. - PubMed
    1. Yang XD, Lamb A, and Chen LF, Methylation, a new epigenetic mark for protein stability. Epigenetics, 2009. 4(7): p. 429–33. - PubMed

Publication types

LinkOut - more resources