. 2018 Nov 1:196:8-24.
doi: 10.1016/j.physbeh.2018.08.012. Epub 2018 Aug 25.

Mouse incising central pattern generator: Characteristics and modulation by pain

Affiliations

Mouse incising central pattern generator: Characteristics and modulation by pain

Charles G Widmer et al. Physiol Behav. .

Abstract

Introduction: Vertebrate incising and chewing are controlled by a set of neurons comprising the central pattern generator (CPG) for mastication. Mandibular positioning and force generation to perform these tasks is complex and requires coordination of multiple jaw opening and closing muscle compartments located in muscles on both sides of the jaw. The purpose of this study was to determine the characteristics of the CPG by recording mouse incising forces in the home cage environment to evaluate changes in force characteristics with incising frequency and force direction. A second purpose was to evaluate the effects of jaw closing muscle pain on CPG output parameters.

Methods: Digitized incising forces were recorded for approximately 24 h using a 3-dimensional force transducer attached to solid food chow. Male and female CD-1 mice were evaluated during their last (fourth) baseline assessment and seven days after a second acidic saline injection into the left masseter muscle when maximum pain was experienced. Incising force resultants were calculated from the three axes data and force parameters were assessed including inter-peak intervals (IPI), peak amplitude, load time and unload time. Multiple regression analyses were conducted to identify incising episodes that had parameters of force that were significantly correlated (p < 0.001). These incising episodes were considered to represent the output of the CPG with a steady state of incoming sensory afferent inputs. Incising parameters were evaluated for each of the discrete incising frequencies (4.6, 5.3, 6.2, 7.6 Hz) and the predominant force directions: jaw closing (-Z), jaw retrusion (+X) and jaw protrusion (-X).

Results: A significant correlation between incising frequency (IPI) and the load time was observed. A significant decrease in peak amplitude was observed with higher incising frequency while the load rate significantly increased. The force peak amplitude and load rates were found to be statistically different when the force direction was considered, with smaller peak amplitudes and smaller load rates found in the jaw closing direction. The effect of pain on incising was to reduce the peak amplitude and load rate of incising compared to the baseline condition at lower incising frequencies.

Conclusions: Like the central pattern generator for locomotion, the CPG for incising controls rhythmicity, peak amplitude and force load duration/rate. However, unlike the CPG for locomotion, the amplitude of incising force decreases as the frequency increases. During incising, load rate increases with faster rhythm and is consistent with the recruitment of larger motor units. Muscle pain reduced the excitatory drive of the CPG on motoneurons and provides further support of the Pain Adaptation Model.

Keywords: Animal behavior; Central pattern generator; Hyperalgesia; Masticatory muscle; Physiological adaptation.


Conflict of interest statement

Conflict of Interest

The authors have no known conflicts of interest associated with this publication and received no significant financial support for this work that could have influenced the outcome of the study.

Figures

Figure 1.
Figure 1.
Diagram of the 3-dimensional force transducer mounted on the wireframe cage top. Note the orientation of the X, Y and Z axes of the force transducer.
Figure 2.
Figure 2.
Diagram of the incising force parameters that were calculated from pairs of peak forces. A threshold was set at 15% above the average baseline and peak amplitude, inter-peak interval and load and unload times were calculated. Load rate represented the slope of the load and was calculated by a line from the threshold of force onset to the peak amplitude.
Figure 3.
Figure 3.
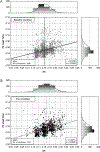
Plots of force data in two dimensions representing pairs of axes. The shaded regions represent data not included in the analyses (jaw opening direction). The lines forming a triangle in figure 3A define the data that have a predominant −Z (jaw closing) force direction. The dotted lines define the data with a predominant +X (jaw retrusion) and the dashed lines define the predominant −X (jaw protrusion) force directions.
Figure 4.
Figure 4.
Median correlation coefficients for pairs of force peak parameters for female mice (A) and male mice (B). Dispersion about the median is represented as ± 25–75% range. Note that interpeak interval (IPI) vs. P2 (peak 2) have statistically significant differences between baseline and pain conditions for both male and female mice.
Figure 5.
Figure 5.
Examples from one female mouse showing data plots for baseline (A) and pain (B) conditions depicting the relationship between the interpeak interval (IPI) and peak 2 (P2) load time. The means for the IPI and P2 load time are shown with dotted lines. A statistically significant difference was found between baseline and pain conditions for mean inter-peak interval (IPI) (t-test, t-value = −7.4, p < 0.0001) but not for P2 load time (t-test, t-value = −1.7, p > 0.05). The slope of the data for each condition is shown as a solid line depicting a positive relationship (r > 0.4) between IPI and P2 load time. Note the mean IPI for the baseline condition is shorter (i.e., higher incising frequency) than the mean IPI for the pain condition.
Figure 6.
Figure 6.
Examples from one male mouse showing data plots for baseline (A) and pain (B) conditions depicting the relationship between the interpeak interval (IPI) and peak 2 (P2) load time. The means for the IPI and P2 load time are shown with dotted lines . A statistically significant difference was found between baseline and pain conditions for mean inter-peak interval (IPI) (t-test, t-value = −9.4, p < 0.0001) but not for P2 load time (t-test, t-value = −1.9, p > 0.05). The slope of the data for each condition is shown as a solid line depicting a positive relationship (r > 0.3) between IPI and P2 load time. Note the mean IPI for the baseline condition is shorter (i.e., higher frequency) than the mean IPI for the pain condition.
Figure 7.
Figure 7.
Force parameters that were significantly correlated with peak 2 load time for female mice (A, B) and male mice (C, D). Data from both baseline and pain conditions are shown for comparison. No significant difference was found between baseline and pain correlation coefficients or the frequency of force parameters with significant correlations. Data are shown for the median and 25–75% range for each force parameter.
Figure 8.
Figure 8.
Graphs of the percent of episodes with significant partial correlation coefficient values for the IPI and peak 2 load duration parameters in female (A) and male (B) mice. Both baseline and pain conditions are shown. No statistically significant difference was found between the baseline and pain conditions. Note the median partial correlations are > 0.5 for both conditions in male and female mice.
Figure 9.
Figure 9.
Force parameters that were significantly correlated with peak 2 amplitude for female mice (A, B) and male mice (C, D). Data from both baseline and pain conditions are shown for comparison. No significant difference was found between the percentage of force parameters with significant correlations. However peak 1 amplitude was found be differ in percentage between baseline and pain conditions in the female mouse. Data are shown for the median and 25–75% range for each force parameter.
Figure 10.
Figure 10.
Graphs of the percent of episodes with significant partial correlation coefficient values for the peak 1 and peak 2 amplitude parameters in female (A) and male (B) mice. Both baseline and pain conditions are shown. No statistically significant difference was found between the baseline and pain conditions. Note the median partial correlations are > 0.5 for both conditions in male and female mice.
Figure 11.
Figure 11.
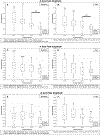
Median resultant force peak amplitudes for incising with different predominant directions of force. Incising with peak forces in the jaw closing direction (11A, B), protrusive direction (11C, D) and retrusive direction (11E, F) were statistically different between the baseline (11A, C, E) and pain (11B, D, F) conditions and between different incising frequencies.
Figure 12.
Figure 12.
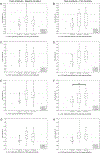
Median load rates for incising with different predominant directions of force. Incising in the jaw closing direction (A, B), protrusion direction (C, D) and retrusion (E, F) direction are shown. Statistical differences between load rates in the baseline and pain conditions were found in the jaw closing direction (12A, B) and between different incising frequencies (12A, B). Significant differences were only found among the different frequencies for the baseline condition in the rostral direction incising (12C).
Figure 13.
Figure 13.
Comparison of median resultant force peak amplitudes for incising with different predominant directions of force for each baseline and pain condition at each incising frequency. Note the magnitude of incising force is smaller for the predominant jaw closing direction compared to the predominant jaw protrusion or retrusion directions.
Figure 14.
Figure 14.
Comparison of median incising load rates for different predominant directions of force at each incising frequency for baseline and pain conditions. Note that load rates are smaller for incising in the predominant jaw closing direction compared to the incising in the predominant jaw protrusion or retrusion directions.

Similar articles

Cited by

References

    1. Hylander WL Incisal bite force direction in humans and the functional significance of mammalian mandibular translation. Am J Phys Anthropol 1978,48:1–7. - PubMed
    1. Hiiemae K, Heath MR, Heath G, Kazazoglu E, Murray J, Sapper D, et al. Natural bites, food consistency and feeding behaviour in man. Arch Oral Biol 1996,41:175–89. - PubMed
    1. Dellow PG, Lund JP Evidence for central timing of rhythmical mastication. J Physiol 1971,215:1–13. - PMC - PubMed
    1. Morquette P, Lavoie R, Fhima MD, Lamoureux X, Verdier D, Kolta A Generation of the masticatory central pattern and its modulation by sensory feedback. Prog Neurobiol 2012,96:340–55. - PubMed
    1. Westberg K, Clavelou P, Sandstrom G, Lund JP Evidence that trigeminal brainstem interneurons form subpopulations to produce different forms of mastication in the rabbit. J Neurosci 1998,18:6466–79. - PMC - PubMed

Publication types

LinkOut - more resources