. 2018 Nov:182:299-311.
doi: 10.1016/j.biomaterials.2018.07.043. Epub 2018 Jul 27.

Human iPS derived progenitors bioengineered into liver organoids using an inverted colloidal crystal poly (ethylene glycol) scaffold

Affiliations

Human iPS derived progenitors bioengineered into liver organoids using an inverted colloidal crystal poly (ethylene glycol) scaffold

Soon Seng Ng et al. Biomaterials. 2018 Nov.

Abstract

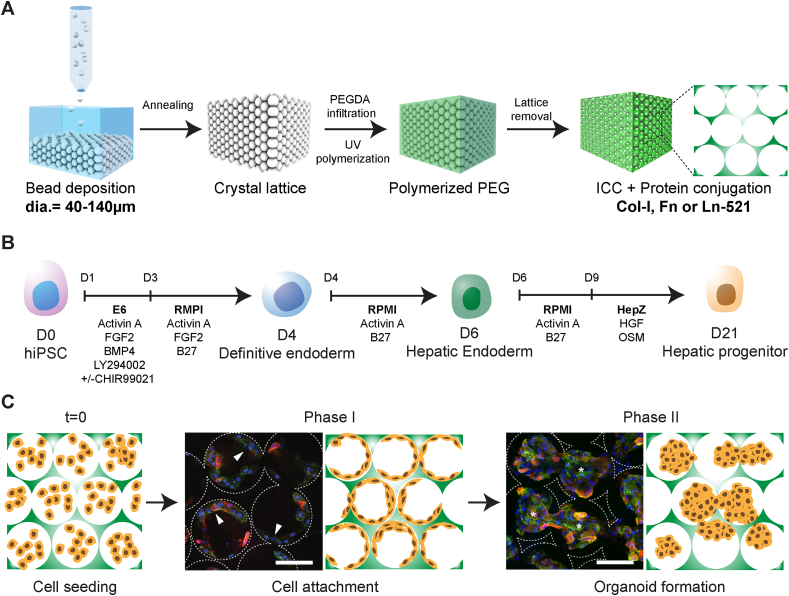
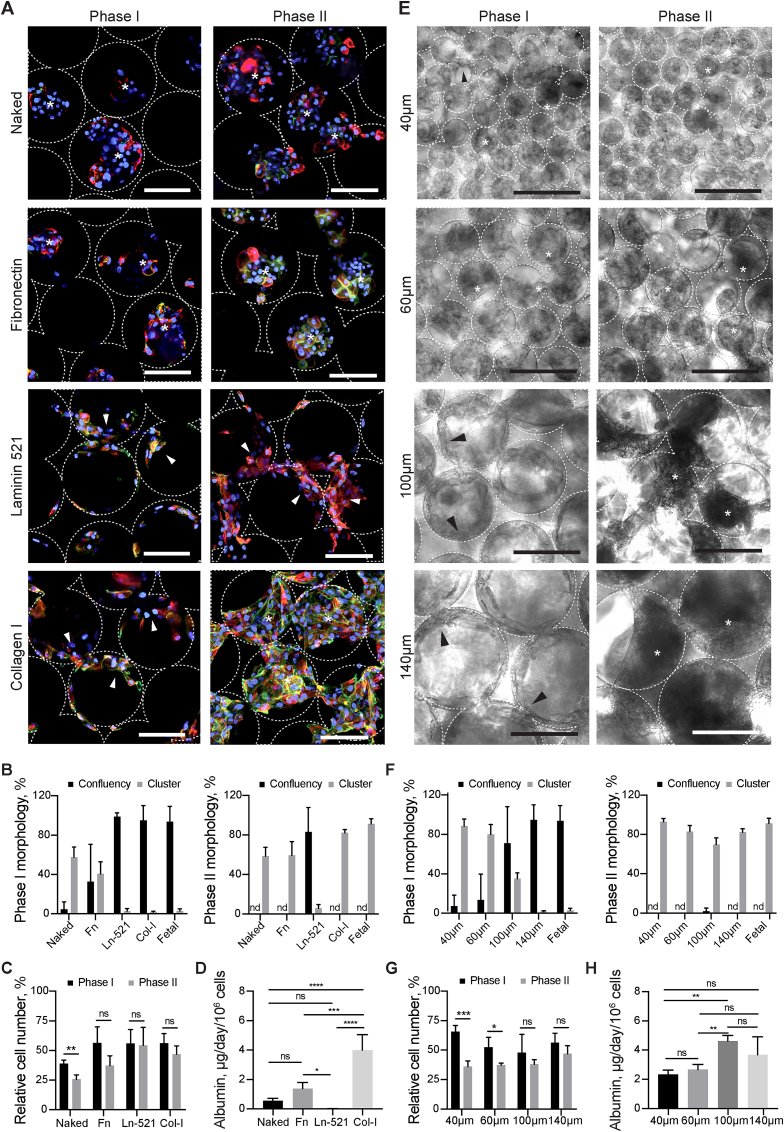
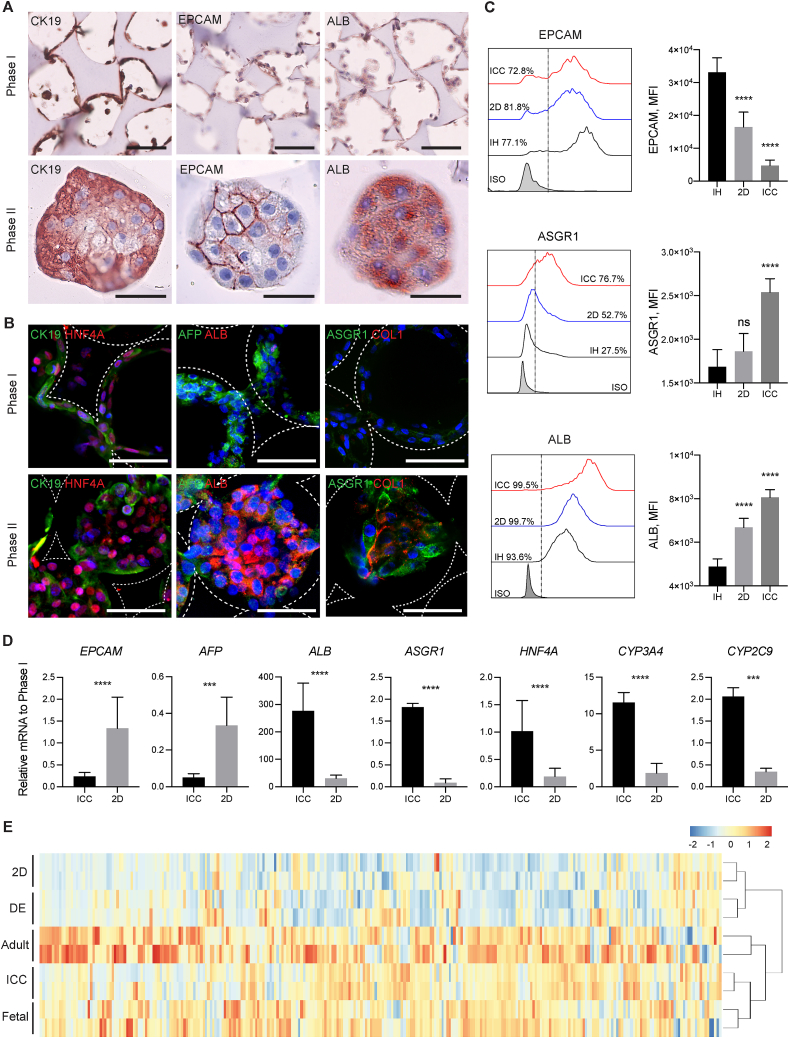
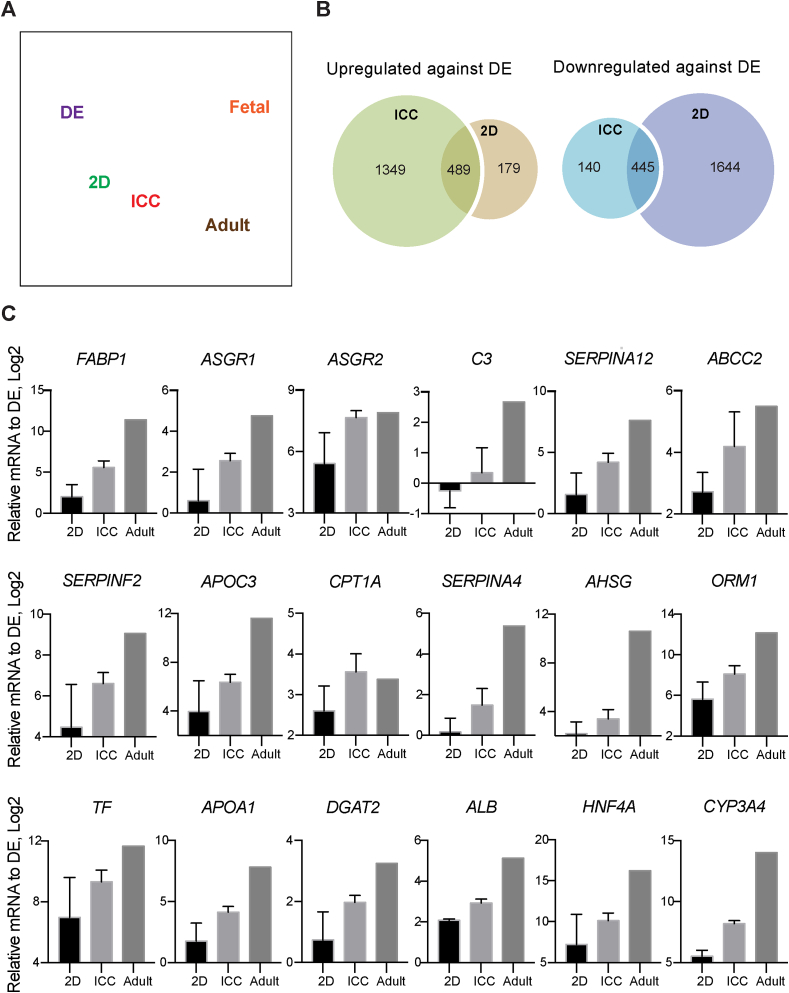
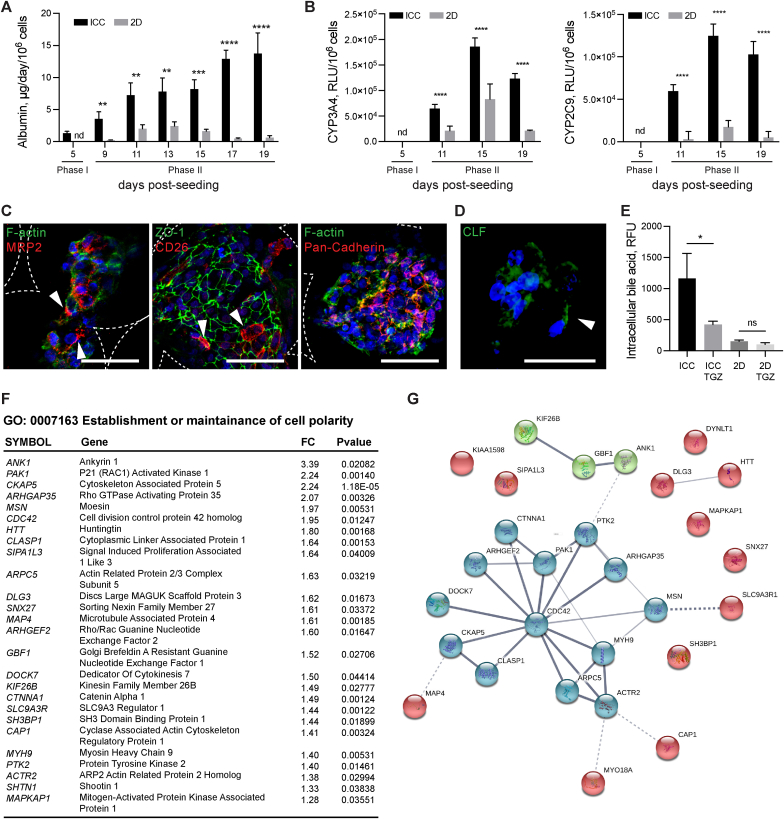
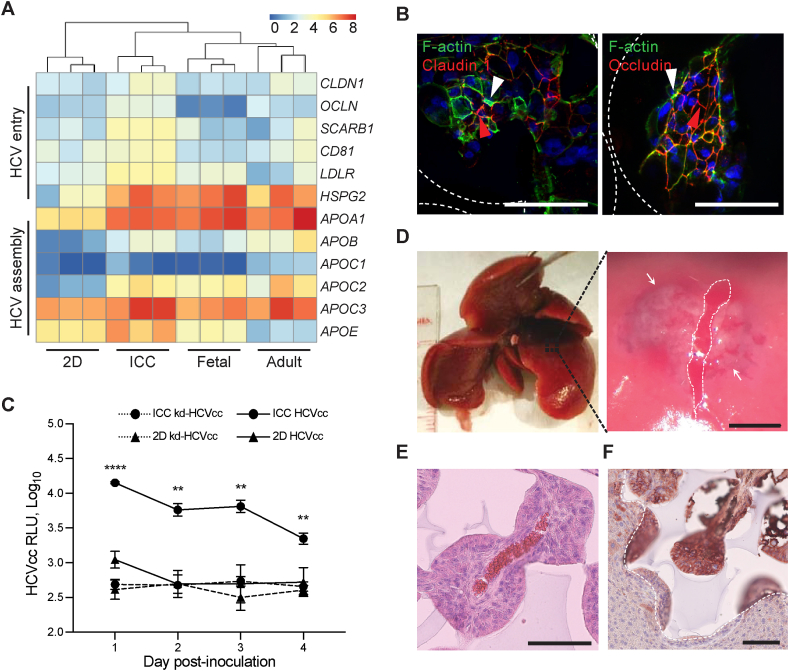
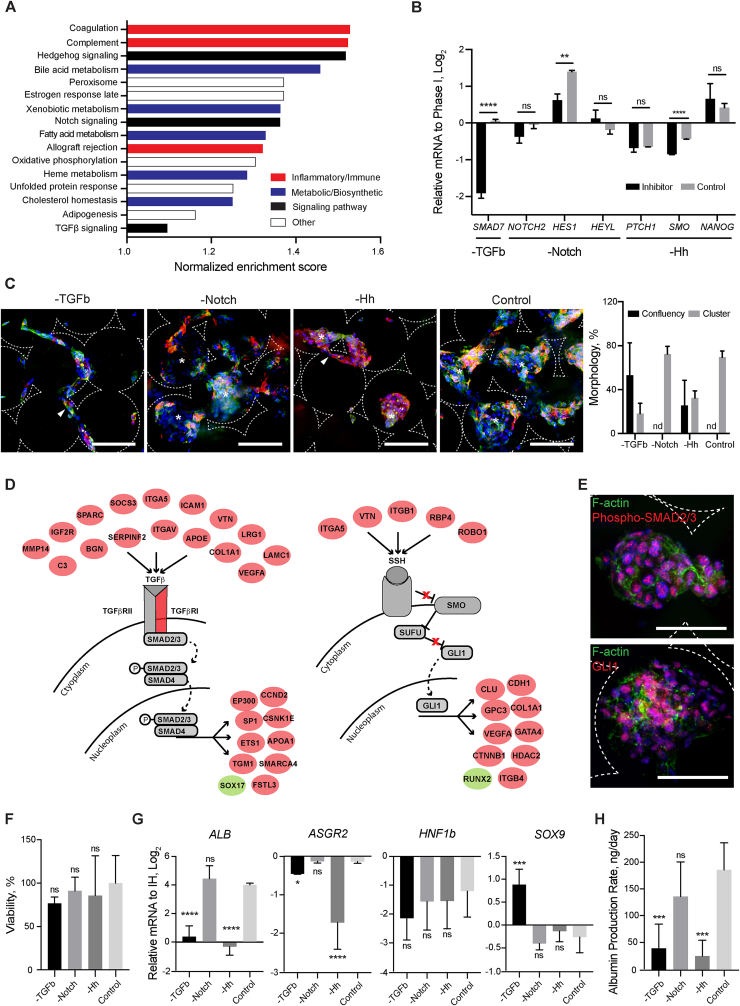
Generation of human organoids from induced pluripotent stem cells (iPSCs) offers exciting possibilities for developmental biology, disease modelling and cell therapy. Significant advances towards those goals have been hampered by dependence on animal derived matrices (e.g. Matrigel), immortalized cell lines and resultant structures that are difficult to control or scale. To address these challenges, we aimed to develop a fully defined liver organoid platform using inverted colloid crystal (ICC) whose 3-dimensional mechanical properties could be engineered to recapitulate the extracellular niche sensed by hepatic progenitors during human development. iPSC derived hepatic progenitors (IH) formed organoids most optimally in ICC scaffolds constructed with 140 μm diameter pores coated with type I collagen in a two-step process mimicking liver bud formation. The resultant organoids were closer to adult tissue, compared to 2D and 3D controls, with respect to morphology, gene expression, protein secretion, drug metabolism and viral infection and could integrate, vascularise and function following implantation into livers of immune-deficient mice. Preliminary interrogation of the underpinning mechanisms highlighted the importance of TGFβ and hedgehog signalling pathways. The combination of functional relevance with tuneable mechanical properties leads us to propose this bioengineered platform to be ideally suited for a range of future mechanistic and clinical organoid related applications.

Keywords: Bioengineering; Biomimetic materials; Liver stem cells; Organogenesis.


Figures

Fig. 1
Fig. 1
Bioengineering liver organoids using ICC scaffold and iPSC-derived hepatic progenitor (IH). (A) Schematic illustration of ICC fabrication using a range of sacrificial monodispersed beads and ECM proteins for stem cell niche modulation. (B) Schematic of human iPSC-derived hepatic progenitors differentiation protocol. (C) Schematic of bioengineering liver organoids using IH and ICC in three main steps, cell seeding, cell attachment (Phase I) and organoid formation (Phase II). Confocal micrographs of human fetal liver cells (Fetal; CTNNB green; CK19 red) demonstrating the two-phase organoid formation in Col-I coated ICC with 140 μm pore size. Arrowheads indicate cells lining surface of ICC; asterisks represent cells forming clusters. Scale bar, 100 μm. (For interpretation of the references to colour in this figure legend, the reader is referred to the Web version of this article.)
Fig. 2
Fig. 2
Characterizing the effects of pore size and ECM proteins on liver organoid formation in ICC scaffold. (A) Confocal micrographs of IH (CTNNB, green; CK19, red) following seeding into non-coated (Naked), Fibronectin (Fn), Laminin 521 (Ln-521), and Collagen I (Col-I) coated ICC's. (B) Quantification of cellular attachment (confluency) and cluster formation (cluster) ability seen across different ECM's during Phase I and II. (C) Cell number relative to initial cell seeding number in Phase I and II. (D) Albumin secretion rate of IH seeded in different ECM coated ICC in Phase II (E) Bright field images revealing the morphologies of IH in ICC with different collagen coated pore sizes (40 μm, 60 μm, 100 μm and 140 μm) and the respective (F) morphological quantitation and (G) relative cell number in Phase I and II. (H) Albumin secretion rate of IH seeded in ICC with different pore sizes in Phase II. Arrowheads indicate cells lining surface of ICC; asterisks represent cells forming clusters. Scale bar, 100 μm. Mean ± sd, N = 4. *p < 0.05; **p < 0.005; ***p < 0.0005; ****p < 0.0001; ns non-significant. (For interpretation of the references to colour in this figure legend, the reader is referred to the Web version of this article.)
Fig. 3
Fig. 3
Morphological and transcriptomic characterization of IH-ICC organoids. (A) Histochemical images demonstrating morphogenesis of IH from a single cell layer (Phase I top panel; scale bar, 100 μm) to organoids (Phase II bottom panel; scale bar, 50 μm) occurs in conjunction with differential protein expression of developmental markers CK19 (left), EPCAM (middle) and ALB (right). (B) Confocal micrographs highlighting upregulated protein expression of mature (ALB, ASGPR1, COL1) hepatic markers occurs in conjunction with down regulation of immature (CK19 and AFP) markers during transition of IH from Phase I (top panel; scale bar, 100 μm) to Phase II (bottom panel; scale bar, 100 μm) organoids. (C) FACS histogram and mean fluorescence intensity (MFI) analysis demonstrating hepatic maturation kinetics of IH in ICC vs 2D culture (N = 4). (D) Differential gene expression (by RT-PCR) of selected genes reveals a more mature hepatic signature of IH in ICC vs. 2D culture (N = 8). (e) Bi-clustering heatmap of 296 liver-specific genes across different primary (adult & fetal liver) and IH (DE, 2D & ICC) samples. Samples are linked by the dendrogram above to show the similarity of their gene expression patterns. Mean ± sd, *p < 0.05; **p < 0.005; ***p < 0.0005; ****p < 0.0001; ns nonsignificant.
Fig. 4
Fig. 4
The transcriptomic analysis of liver organoid in ICC. (A) Principle component analysis of RNA-seq data demonstrating the proximity of gene expression variance in 2D plot. (B) Venn diagrams showing the number of up and downregulated gene in ICC and 2D with respect to DE. (C) RT-PCR validation on top 18 liver-specific genes identified by RNA-seq analysis (N = 3) Mean ± sd.
Fig. 5
Fig. 5
Functional validation of organoids. (A) Albumin secretion rate of IH-ICC vs. 2D (N = 8). (B) Basal metabolic activity of Cytochrome P450 isoforms CYP3A4 and CYP2C9 in IH-ICC vs 2D (N = 8). RLU, relative luminescence unit. (C) Confocal micrographs showing expression of hepatocyte polarity markers (MRP2, ZO-1, CD26 and Pan-Cadherin) in IH-ICC organoids. Scale bar, 50 μm. White arrowhead points to apical region. (D) Accumulation of Cholyl-L-lysyl-fluorescein (CLS) in IH-ICC organoids after 40 min of CLF incubation followed by 40 min of washing. White arrowhead points to the CLF accumulation. (E) Effect of adding Troglitazone (TGZ) to CLS retention in IH-ICC (N = 4). (F) A list of uniquely upregulated genes in IH-ICC vs 2D that involved in establishment and maintenance of cell polarity. FC, fold change. (G) The STRING functional network predicted the associations between proteins (nodes) from regulated genes involved in cell polarity in IH-ICC. The cluster analysis was performed using KMEANS clustering algorithms. Mean ± sd, *p < 0.05; **p < 0.005; ***p < 0.0005; ****p < 0.0001; ns nonsignificant.
Fig. 6
Fig. 6
Disease modelling and in vivo transplantation. (A) Heatmap and hierarchal clustering comparing expression of 12 genes involved in encoding HCV entry and assembly in IH-ICC vs 2D vs primary (adult, fetal) liver. (B) Confocal imaging showing expression of claudin 1 and occludin in IH-ICC organoids. Scale bar, 100 μm. White and red arrowheads point to apical and lateral regions respectively. (C) HCV expression of IH-ICC vs 2D following infection with HCV reporter virus expressing secreted GLuc (HCVcc, N = 4) or mock infected with knock down HCVcc (kd-HCVcc, N = 3) and subsequently were sampled and washed daily. RLU, relative luminescence unit. (D) Photograph showing location of surgical pocket formation on murine left lateral lobe (left) and appearance following IH-ICC transplantation (right). The white dashed line depicts the capsular incision and the limits of the sub-capsular scaffold implant are shown by the white arrows. Scale bar 1.5 mm (E) H&E staining of explant reveals neo-vasculature of IH-ICC. Scale bar, 100 μm. (F) Immuno-histochemical staining of explant for human albumin. Dashed white line indicates the boundary between implant and host liver. Scale bar, 100 μm. Mean ± sd; **p < 0.005, ****p < 0.0001, nd not detected. (For interpretation of the references to colour in this figure legend, the reader is referred to the Web version of this article.)
Fig. 7
Fig. 7
Mechanisms of organoid formation. (A) Bar chart detailing gene sets uniquely enriched in IH-ICC over 2D. (B) Gene expression (by RT-PCR) in IH-ICC of selected pathway transcriptional targets, TGFb, Notch and Hedgehog (Hh) following addition of respective inhibitors (N = 4). (C) Confocal micrographs of IH in Phase II (CTNNB, green; CK19, red) demonstrating effects of inhibitors on IH-ICC morphogenesis. Morphological quantification of observations provided on right. (D) Regulatory networks of TGFb (left) and hedgehog (right). Genes labelled in red and green were identified as significantly up- and down regulated in IH-ICC over 2D. (E) Confocal micrographs showing translocation of phosphor-SMAD2/3 and GLI1 in response to TGFb and hedgehog pathway activation in IH-ICC organoids. (F) Cell viability in IH-ICC as a consequence of adding each inhibitor as determined by cell activity (N = 8). (G) Gene expression (by RT-PCR) of selected hepatic and biliary markers in IH-ICC following addition of each inhibitor above (N = 4). (H) Effect of inhibitors on IH-ICC hepatic function by albumin production rate (N = 4). Mean ± sd, *p < 0.05, **p < 0.005, ***p < 0.0005, ****p < 0.0001, ns nonsignificant. (For interpretation of the references to colour in this figure legend, the reader is referred to the Web version of this article.)

References

    1. Takebe T. Vascularized and functional human liver from an iPSC-derived organ bud transplant. Nature. 2013;499(7459):481–484. - PubMed
    1. Huch M. In vitro expansion of single Lgr5+ liver stem cells induced by Wnt-driven regeneration. Nature. 2013;494(7436):247–250. - PMC - PubMed
    1. Sato T. Single Lgr5 stem cells build crypt–villus structures in vitro without a mesenchymal niche. Nature. 2009;459(7244):262–265. - PubMed
    1. Lancaster M.A. Cerebral organoids model human brain development and microcephaly. Nature. 2013;501(7467):373–379. - PMC - PubMed
    1. Takasato M. Kidney organoids from human iPS cells contain multiple lineages and model human nephrogenesis. Nature. 2015;526(7574):564–568. - PubMed

Publication types

MeSH terms

Substances