. 2018;65(4):1267-1281.
doi: 10.3233/JAD-171108.

Colocalization of Aluminum and Iron in Nuclei of Nerve Cells in Brains of Patients with Alzheimer's Disease

Affiliations

Colocalization of Aluminum and Iron in Nuclei of Nerve Cells in Brains of Patients with Alzheimer's Disease

Sakae Yumoto et al. J Alzheimers Dis. 2018.

Abstract

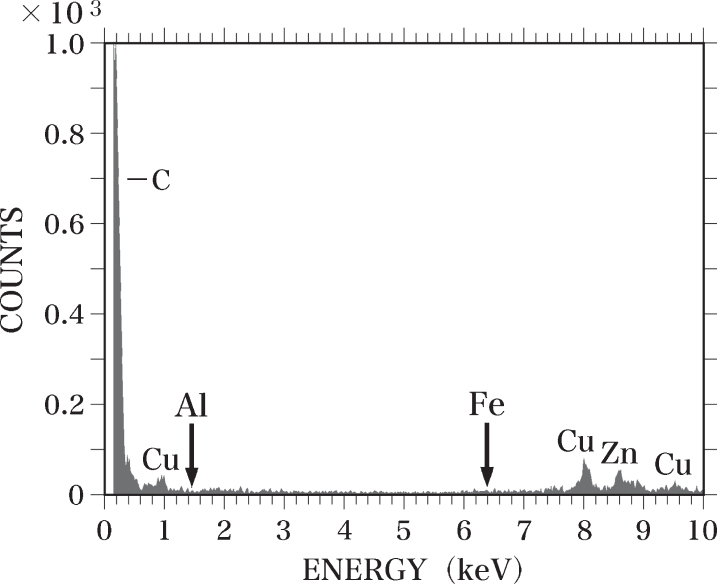
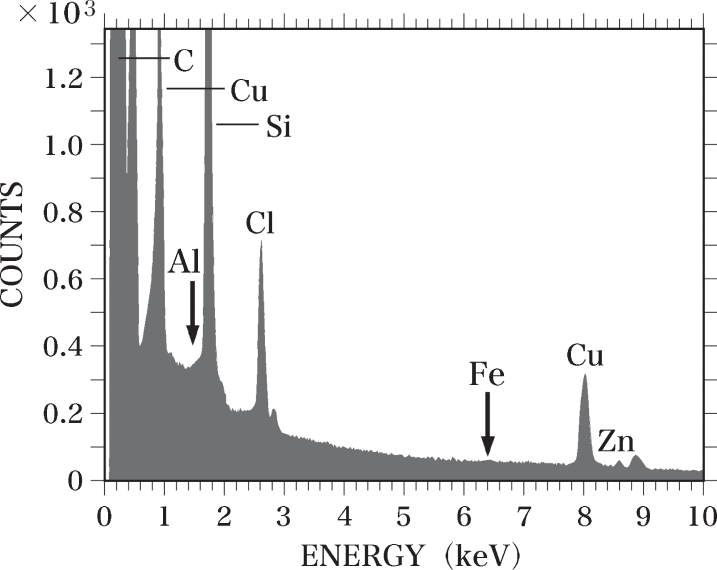
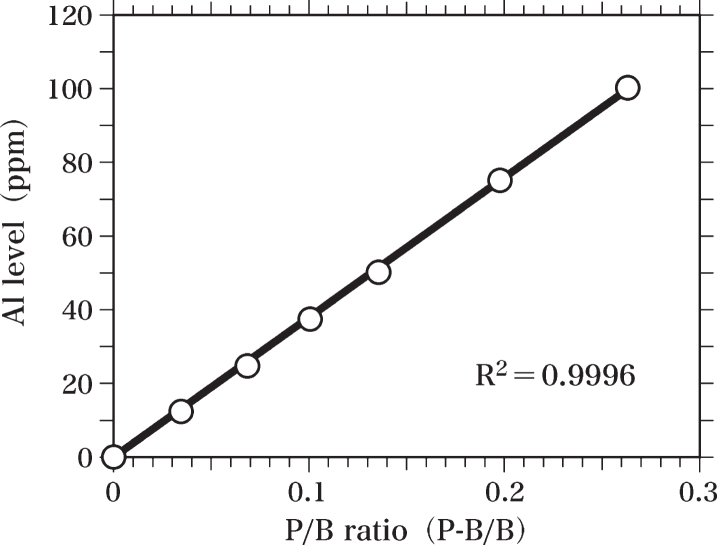
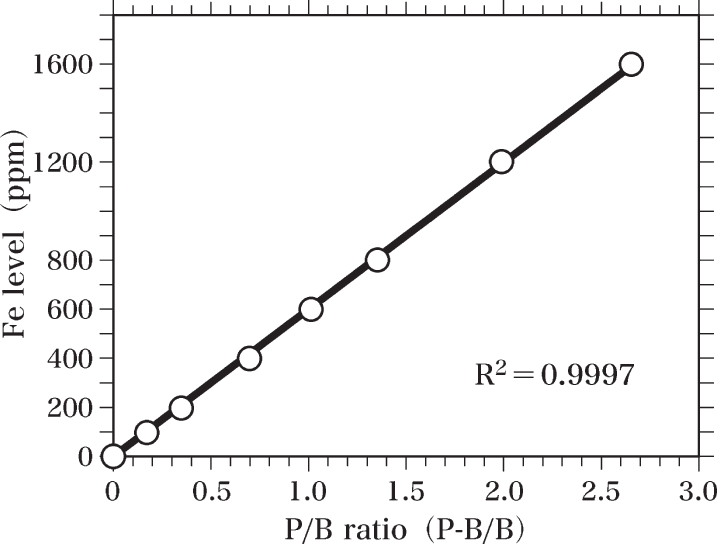
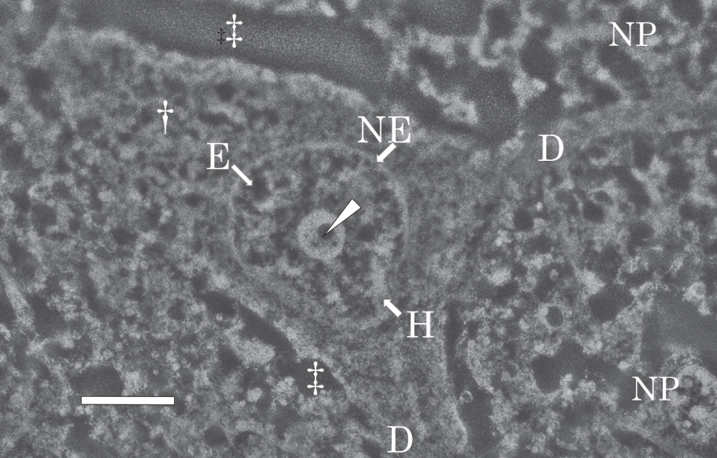
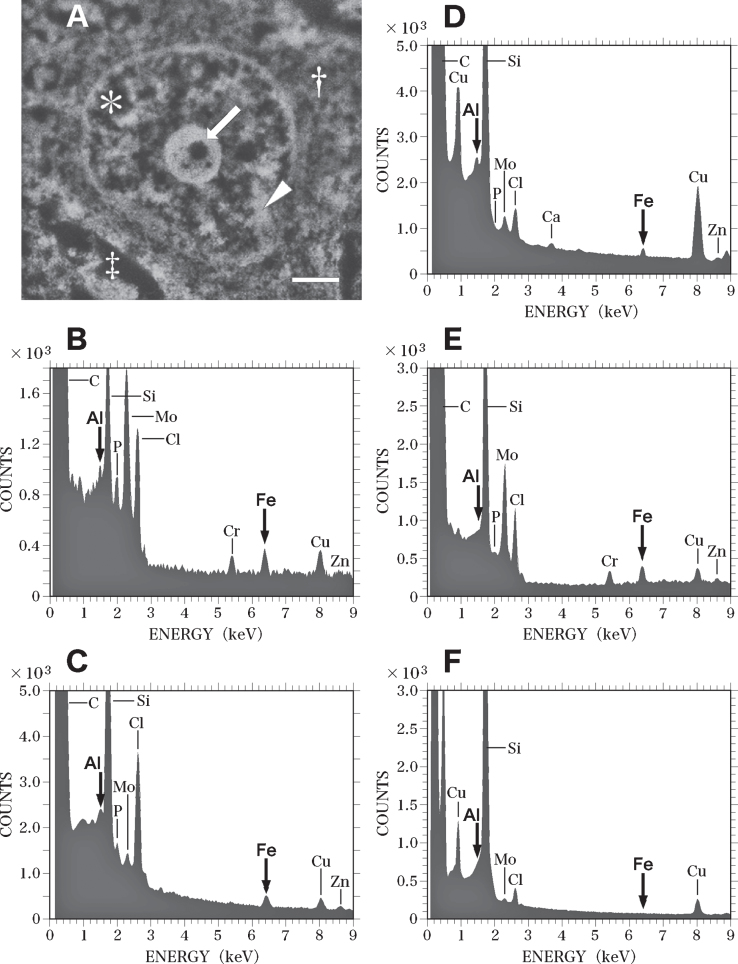
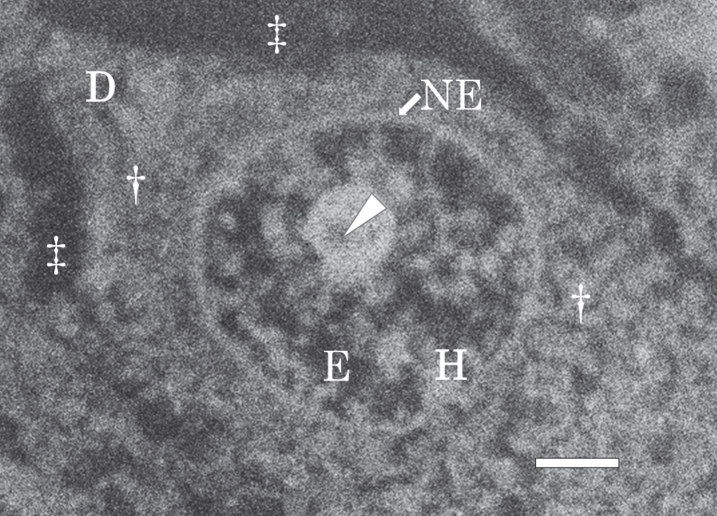
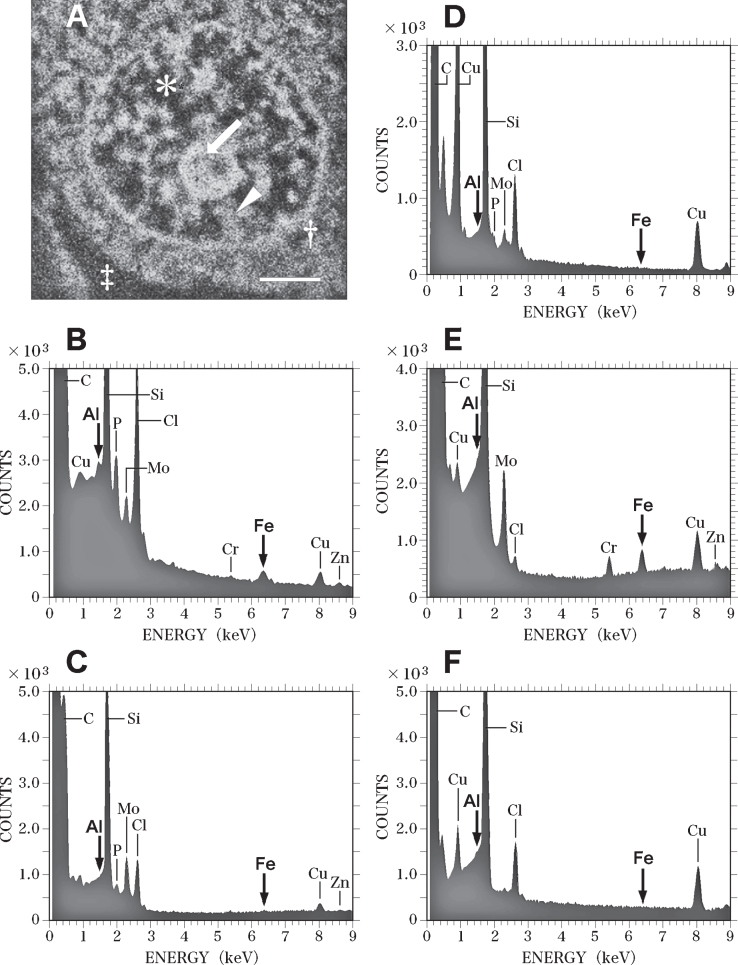
Increasing evidence indicates that metal-induced oxidative stress plays a pivotal role in the pathogenesis of Alzheimer's disease (AD). Recently, the presence of 8-hydroxydeoxyguanosine, a biomarker of oxidative DNA damage, was demonstrated in nuclear DNA (nDNA) in the AD brain. Iron (Fe) is a pro-oxidant metal capable of generating hydroxyl radicals that can oxidize DNA, and aluminum (Al) has been reported to facilitate Fe-mediated oxidation. In the present study, we examined the elements contained in the nuclei of nerve cells in AD brains using scanning electron microscopy coupled with energy-dispersive X-ray spectroscopy (SEM-EDS). Our results demonstrated that Al and Fe were colocalized in the nuclei of nerve cells in the AD brain. Within the nuclei, the highest levels of both Al and Fe were measured in the nucleolus. The SEM-EDS analysis also revealed the colocalization of Al and Fe in the heterochromatin and euchromatin in neuronal nuclei in the AD brain. Notably, the levels of Al and Fe in the nucleus of nerve cells in the AD brain were markedly higher than those in age-matched control brains. We hypothesize that the colocalization of Al and Fe in the nucleus of nerve cells might induce oxidative damage to nDNA and concurrently inhibit the repair of oxidatively damaged nDNA. An imbalance caused by the increase in DNA damage and the decrease in DNA repair activities might lead to the accumulation of unrepaired damaged DNA, eventually causing neurodegeneration and the development of AD.

Keywords: Aluminum; Alzheimer’s disease; DNA damage; Fenton reaction; electron microscopy; energy-dispersive X-ray spectroscopy; iron; neurodegeneration; oxidative stress.


Figures

Fig. 1
Fig. 1
EDS spectrum of the blank test. SEM-EDS analysis was performed without placing samples on the sample holder. No Al or Fe (arrows) was detected. The C peak appears to be derived from the sample holder made of carbon. The Cu and Zn peaks are considered to originate from the components of the electron microscope.
Fig. 2
Fig. 2
EDS spectrum of an Epon section. A semi-thin section (0.4-μm thick) of Epon was analyzed using EDS. No Al or Fe (arrows) was detected in the section. The Si peak is considered to be generated from contamination by oil vapor evaporated from the vacuum pump oil. The Cl peak was considered to originate from the Epon itself.
Fig. 3
Fig. 3
Standard curve of Al. The standard curve of Al levels was prepared by SEM-EDS analysis using semi-thin sections (0.4-μm thick) of Epon and Al-Epon mixtures containing 100, 75, 50, 37.5, 25, and 12.5 ppm Al. The Al standard curve was used to calculate Al levels in brain samples by comparing the peak-to-background ratio (P-B/B) of each sample with that of the standard curve. The standard curve was obtained using the least squares method.
Fig. 4
Fig. 4
Standard curve of Fe. The standard curve of Fe levels was made by SEM-EDS analysis using semi-thin sections (0.4-μm thick) of Epon and Fe-Epon mixtures containing 1600, 1200, 800, 600, 400, 200, and 100 ppm Fe. The Fe standard curve was used to estimate Fe levels in brain samples by comparing the peak-to-background ratio (P-B/B) of each sample with that of the standard curve. The standard curve was obtained using the least squares method.
Fig. 5
Fig. 5
SEM micrograph of a nerve cell in the temporal cortex of the AD brain. The SEM micrograph shows a nerve cell of the AD brain fixed with potassium dichromate and stained with ammonium molybdate. The nuclear envelope (NE) shows an intact shape. Intranuclear structures such as the nucleolus, heterochromatin (H, bright region), and euchromatin (E, dark region) are well preserved. In the center of the nucleolus, pars amorpha (arrowhead) is clearly observed. Two dendrites (D) branches from the cytoplasm (dagger) of the nerve cell. Due to postmortem changes, the extracellular space (double dagger) is enlarged. NP, neuropil. Scale bar, 2μm.
Fig. 6
Fig. 6
SEM-EDS analysis of the nucleus of the nerve cell in the AD brain shown in Fig. 5. A) SEM image of the nucleus of the nerve cell in the AD brain shown in Fig. 5. SEM examination shows a well-developed, large nucleolus (arrow), heterochromatin (arrowhead), and euchromatin (asterisk) in the nucleus. Dagger shows the perinuclear cytoplasm. Double dagger indicates the extracellular space. Scale bar, 1μm. B) EDS spectrum of the nucleolus (A, arrow) of the nerve cell in the AD brain. A small region (0.2μm in diameter) of the nucleolus in the nerve cell was examined using EDS. Elevated peaks for Al and Fe (arrows) are demonstrated. C) EDS spectrum of the heterochromatin (A, arrowhead) of the nerve cell in the AD brain. Al and Fe peaks (arrows) are detected in the heterochromatin. D) EDS spectrum of the euchromatin (A, asterisk) of the nerve cell in the AD brain. Al and Fe peaks (arrows) are detected in the euchromatin. The peaks for both Al and Fe measured in the heterochromatin and euchromatin are markedly lower than those measured in the nucleolus. E) EDS spectrum in the perinuclear cytoplasm (A, dagger) of the nerve cell in the AD brain. The elevated Fe peak is demonstrated in the perinuclear region of the cytoplasm. In contrast, no Al peak is detected. F) EDS spectrum in the extracellular space (A, double dagger) in the AD brain. No Al or Fe can be detected in the extracellular space.
Fig. 7
Fig. 7
SEM micrograph of a nerve cell in the hippocampus of the control brain. The SEM micrograph exhibits a nerve cell of the control brain fixed with potassium dichromate and stained with ammonium molybdate. The nuclear envelope (NE) retains an intact structure and the intranuclear structures such as the nucleolus, heterochromatin (H, bright region), and euchromatin (E, dark region) are well preserved. A dendrite (D) branches from the cytoplasm (dagger). An arrow shows pars amorpha in the nucleolus. The extracellular space (double dagger) is enlarged due to postmortem changes. Scale bar, 1μm.
Fig. 8
Fig. 8
SEM-EDS analysis of the nucleus of the nerve cell in the control brain exhibited in Fig. 7. A) SEM image of the nucleus of the nerve cell in the control brain shown in Fig. 7. SEM image shows the nucleolus (arrow), heterochromatin (arrowhead) and euchromatin (asterisk) in the nucleus. Dagger shows the perinuclear cytoplasm. Double dagger indicates the extracellular space. Scale bar, 1μm. B) EDS spectrum of the nucleolus (A, arrow) of the nerve cell in the control brain. Arrows indicate the sites for Al Kα (1.487 keV) and Fe Kα (6.404 keV), respectively. Al and Fe peaks (arrows) are detected in the nucleolus. However, these Al and Fe peaks of the nucleolus in the control brain are significantly lower than those measured in the AD brain C) EDS spectrum of the heterochromatin (A, arrowhead) in the nerve cell of the control brain. No Al or Fe can be detected in the heterochromatin in the control brain. D) EDS spectrum of the euchromatin (A, asterisk) in the nerve cell in the control brain. No Al or Fe can be detected in the euchromatin in the control brain. E) EDS spectrum in the perinuclear cytoplasm (A, dagger) in the nerve cell in the control brain. The elevated peak for Fe is demonstrated in the perinuclear cytoplasm. In contrast, no Al peak is detected. F) EDS spectrum in the extracellular space (A, double dagger) in the control brain. No Al or Fe can be detected in the extracellular space in the control brain.

References

    1. Smith MA, Rottkamp CA, Nunomura A, Raina AK, Perry G (2000) Oxidative stress in Alzheimer’s disease. Biochim Biophys Acta 1502, 139–144. - PubMed
    1. Kawahara M (2005) Effects of aluminum on the nervous system and its possible link with neurodegenerative diseases. J Alzheimers Dis 8, 171–182. - PubMed
    1. Masters CL, Selkoe DJ (2012) Biochemistry of amyloid β-protein and amyloid deposits in Alzheimer disease. Cold Spring Harb Perspect Med 2, a006262. - PMC - PubMed
    1. Walton JR (2014) Chronic aluminum intake causes Alzheimer’s disease: Applying Sir Austin Bradford Hill’s causality criteria. J Alzheimers Dis 40, 765–838. - PubMed
    1. Hebert LE, Scherr PA, Beckett LA, Albert MS, Pilgrim DM, Chown MJ, Funkenstein HH, Evans DA (1995) Age-specific incidence of Alzheimer’s disease in a community population. JAMA 273, 1354–1359. - PubMed