. 2018 Oct 1;150(10):1444-1458.
doi: 10.1085/jgp.201812086. Epub 2018 Aug 27.

Determining the molecular basis of voltage sensitivity in membrane proteins

Affiliations

Determining the molecular basis of voltage sensitivity in membrane proteins

Marina A Kasimova et al. J Gen Physiol. .

Abstract

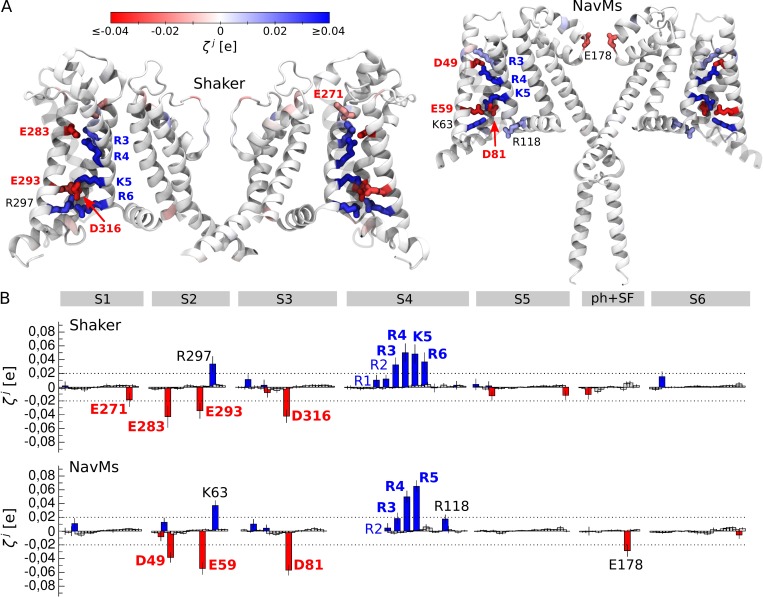
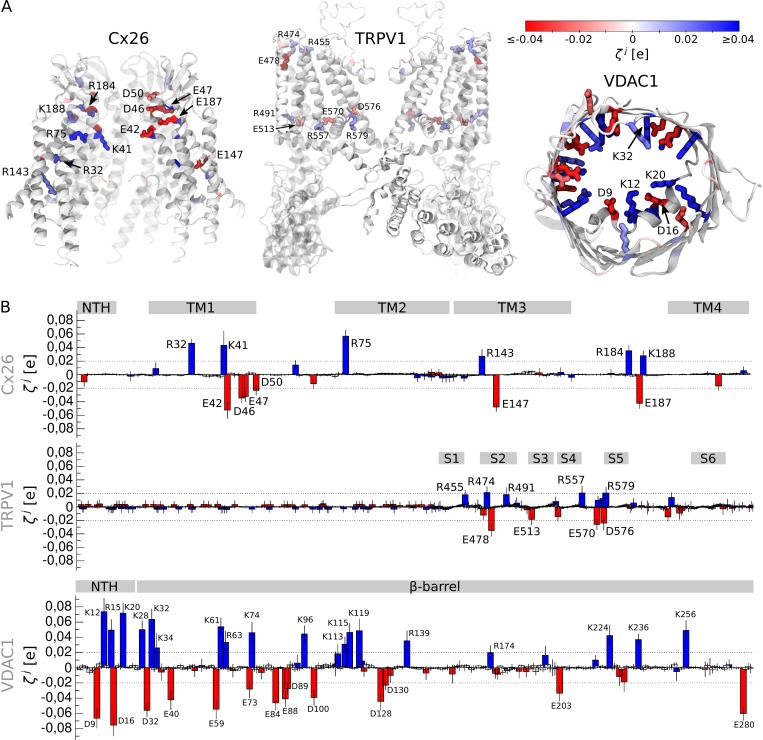
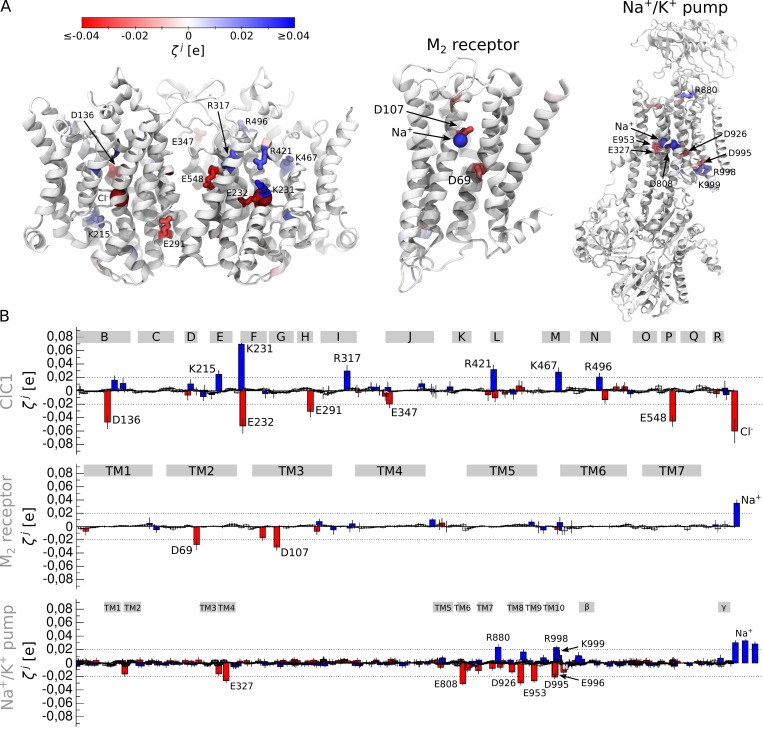
Voltage-sensitive membrane proteins are united by their ability to transform changes in membrane potential into mechanical work. They are responsible for a spectrum of physiological processes in living organisms, including electrical signaling and cell-cycle progression. Although the mechanism of voltage-sensing has been well characterized for some membrane proteins, including voltage-gated ion channels, even the location of the voltage-sensing elements remains unknown for others. Moreover, the detection of these elements by using experimental techniques is challenging because of the diversity of membrane proteins. Here, we provide a computational approach to predict voltage-sensing elements in any membrane protein, independent of its structure or function. It relies on an estimation of the propensity of a protein to respond to changes in membrane potential. We first show that this property correlates well with voltage sensitivity by applying our approach to a set of voltage-sensitive and voltage-insensitive membrane proteins. We further show that it correctly identifies authentic voltage-sensitive residues in the voltage-sensor domain of voltage-gated ion channels. Finally, we investigate six membrane proteins for which the voltage-sensing elements have not yet been characterized and identify residues and ions that might be involved in the response to voltage. The suggested approach is fast and simple and enables a characterization of voltage sensitivity that goes beyond mere identification of charges. We anticipate that its application before mutagenesis experiments will significantly reduce the number of potential voltage-sensitive elements to be tested.


Figures

Figure 1.
Figure 1.
Membrane protein families, encompassing voltage-sensitive representatives. The families are arranged in four large groups according to Almén et al. (2009); only α-helical membrane proteins are shown. Channels are subdivided in voltage-gated (VGIC), ligand-gated (LGICs), chloride channels and aquaporins. Blue indicates families containing voltage-sensitive membrane proteins, and white indicates families in which voltage-sensitive representatives have not yet been discovered. The families shown in red correspond to membrane proteins for which changes in the MP is the primary stimulus for activation. Finally, the families in orange contain membrane proteins whose voltage sensitivity is controversial. To compose this figure we used data from multiple references (Nakao and Gadsby, 1986; Catterall, 1988; Weer et al., 1988; Colombini, 1989; Schnetkamp and Szerencsei, 1991; Bernardi, 1992; Parent et al., 1992; Kavanaugh, 1993; Petronilli et al., 1994; Jentsch et al., 1995; Reddy et al., 1995; Wadiche et al., 1995; Beltrán et al., 1996; Caterina et al., 1997; Halestrap et al., 1997; Scorrano et al., 1997; Cooper et al., 1998; Kaim and Dimroth, 1998, 1999; Künkele et al., 1998; Lostao et al., 2000; Sugawara et al., 2000; Yao et al., 2000; Zheng et al., 2000; Ben-Chaim et al., 2003; DeCoursey et al., 2003; Jutabha et al., 2003, 2011; Mackenzie et al., 2003; Melzer et al., 2003; Bezanilla, 2005, 2008; Valdez and Boveris, 2007; Anzai et al., 2008; Hub et al., 2010; Zhang et al., 2011; Bargiello et al., 2012; Malhotra et al., 2013; Rinne et al., 2013; van der Laan et al., 2013; Zander et al., 2013; Rosasco et al., 2015; Vorburger et al., 2016).
Figure 2.
Figure 2.
Per-residue local electric field response Rj values and response propensity ζj values estimated by using different electric fields for a range of systems. (A) Rj and ζj values estimated for the system with NavMs by using large electric fields (between −0.02 and 0.02 V/Å), small electric fields (between −0.005 and 0.005 V/Å), and TIP4P water (large electric fields). The left panels illustrate the average, and the right panels illustrate the standard deviation. Note that in all three cases, the average of Rj and ζj is almost identical. The error is similar for large electric fields and different water models but significantly larger for the small electric fields. (B) Rj and ζjvalues estimated for Shaker, NavMs, Cx26, TRPV1, VDAC1, ClC1, M2 receptor, Na+/K+ ATPase, GLIC, and TWIK-1. Rzj, Rxj, and Ryj are computed by using the z, x, and y components of the local electric field, respectively (the z axis is the membrane normal, and the direction of the electric field). The left panels illustrate the average, and the right panels illustrate the standard deviation. Based on these data, we chose 0.02 to be the detection threshold for R.
Figure 3.
Figure 3.
Workflow of the suggested approach. The protein is embedded into a bilayer-solution environment and equilibrated. N conformations are extracted from the equilibration trajectory, and for each of them, eight independent runs under different electric fields are performed. For every run, the map of the local electrostatic potential is calculated. Based on this, the local electric field, the local electric field response and the system's response propensity are computed. The system's elements with R and ζj (use greek symbol) above the detection threshold correspond to putative voltage sensors.
Figure 4.
Figure 4.
The local electric field response R (left) and the system’s response propensity ζj (right) estimated for 10 different membrane proteins. They include voltage-gated potassium channel Shaker (Long et al., 2007; Yazdi et al., 2016), voltage-gated sodium channel NavMs (Sula et al., 2017), Cx26 (Maeda et al., 2009), TRPV1 (Cao et al., 2013; Liao et al., 2013; Kasimova et al., 2018), VDAC1 (Ujwal et al., 2008), ClC1 (Park and MacKinnon, 2018), muscarinic acetylcholine receptor M2 (Haga et al., 2012), Na+/K+ ATPase (Kanai et al., 2013), GLIC (Sauguet et al., 2014), and two-pore domain potassium channel TWIK-1 (Miller and Long, 2012). The slices of the systems along the normal to the membrane are shown. The gray area shows the regions that are not accessible to water (i.e., the proteins and the membrane). To clearly represent ζj, we approximated each point charge of the system element j with a Gaussian distribution (σ = 1.5 Å) and then integrated the signal over 25 slices (each 1 Å wide) parallel to the plane shown in the figure. Only the values above the detection threshold were considered for the integration (see Materials and methods). Shaker, NavMs, Cx26, VDAC1, and ClC1, for which changes in the MP are the primary stimulus for activation, have the largest ζjvalues, while TRPV1, which is known to be very weakly voltage-sensitive (Caterina et al., 1997; Nilius et al., 2005; Boukalova et al., 2010), has the smallest ζj value among the voltage-sensitive membrane proteins.
Figure 5.
Figure 5.
Detection of the voltage-sensing elements in the two voltage-gated ion channels, Shaker (Long et al., 2007; Yazdi et al., 2016) and NavMs (Sula et al., 2017). (A) Illustrated representation of the two channels. The residues whose ζj is larger than the detection threshold are shown. (B) ζj values estimated for Shaker and NavMs; the average and the standard deviation are shown. The positively and negatively charged residues are shown as blue and red bars, respectively. The dashed lines represent the detection threshold. S1–S6 denotes the transmembrane segments, and ph+SF is the pore helix and the selectivity filter. The residues shown in blue or red and in bold correspond to the known voltage sensors and were detected by our method; those shown in blue and not in bold correspond to the known voltage sensors, for which our method showed ζj below the detection threshold. Finally, residues shown in black were detected by our method but were not yet shown to play a role in voltage sensitivity.
Figure 6.
Figure 6.
Detection of the voltage-sensing sensing elements in Cx26 (Maeda et al., 2009), transient receptor potential channel TRPV1 (Cao et al., 2013; Liao et al., 2013; Kasimova et al., 2018), and voltage-dependent anion channel VDAC1 (Ujwal et al., 2008). (A) Illustrated representation of the membrane proteins. The residues whose ζj value is larger than the detection threshold are shown. (B) ζj values estimated for Cx26, TRPV1, and VDAC1; the average and standard deviation are shown. The positively and negatively charged residues are shown as blue and red bars, respectively. The gray rectangles correspond to different regions of the proteins: NTH, the α-helical N terminus in Cx26 and VDAC1; TM1–TM4, transmembrane segments in Cx26; S1–S6, transmembrane segments in TRPV1; and β-barrel, the β-barrel in VDAC1.
Figure 7.
Figure 7.
Detection of the voltage-sensing elements in ClC1 (Park and MacKinnon, 2018), muscarinic acetylcholine receptor M2 (Haga et al., 2012) and Na+/K+ ATPase (Kanai et al., 2013). (A) Illustrated representation of the membrane proteins. The residues whose ζj value is larger than the detection threshold are shown. (B) ζj values estimated for ClC1, M2 receptor, and Na+/K+ ATPase; the average and standard deviation are shown. The positively and negatively charged residues are shown as blue and red bars, respectively. The gray rectangles correspond to different regions of the proteins: B-R, the α-helical transmembrane segments in ClC1; TM1–TM7, the transmembrane segments in the M2 receptor; TM1–TM10, the transmembrane segments in Na+/K+ ATPase; β and γ, auxiliary subunits of Na+/K+ ATPase.

Comment in

  • Predicting voltage sensing.
    Sedwick C. Sedwick C. J Gen Physiol. 2018 Oct 1;150(10):1349. doi: 10.1085/jgp.201812233. Epub 2018 Sep 10. J Gen Physiol. 2018. PMID: 30201729 Free PMC article.

References

    1. Abraham M.J., Murtola T., Schulz R., Páll S., Smith J.C., Hess B., and Lindahl E.. 2015. GROMACS: High performance molecular simulations through multi-level parallelism from laptops to supercomputers. SoftwareX. 1–2:19–25. 10.1016/j.softx.2015.06.001 - DOI
    1. Aggarwal S.K., and MacKinnon R.. 1996. Contribution of the S4 segment to gating charge in the Shaker K+ channel. Neuron. 16:1169–1177. 10.1016/S0896-6273(00)80143-9 - DOI - PubMed
    1. Aksimentiev A., and Schulten K.. 2005. Imaging alpha-hemolysin with molecular dynamics: ionic conductance, osmotic permeability, and the electrostatic potential map. Biophys. J. 88:3745–3761. 10.1529/biophysj.104.058727 - DOI - PMC - PubMed
    1. Almén M.S., Nordström K.J.V., Fredriksson R., and Schiöth H.B.. 2009. Mapping the human membrane proteome: a majority of the human membrane proteins can be classified according to function and evolutionary origin. BMC Biol. 7:50 10.1186/1741-7007-7-50 - DOI - PMC - PubMed
    1. Anzai N., Ichida K., Jutabha P., Kimura T., Babu E., Jin C.J., Srivastava S., Kitamura K., Hisatome I., Endou H., and Sakurai H.. 2008. Plasma urate level is directly regulated by a voltage-driven urate efflux transporter URATv1 (SLC2A9) in humans. J. Biol. Chem. 283:26834–26838. 10.1074/jbc.C800156200 - DOI - PubMed

Publication types

LinkOut - more resources