. 2018 Sep 11;115(37):E8783-E8792.
doi: 10.1073/pnas.1807501115. Epub 2018 Aug 27.

Transcriptional switch for programmed cell death in pith parenchyma of sorghum stems

Affiliations

Transcriptional switch for programmed cell death in pith parenchyma of sorghum stems

Masaru Fujimoto et al. Proc Natl Acad Sci U S A. .

Abstract

Pith parenchyma cells store water in various plant organs. These cells are especially important for producing sugar and ethanol from the sugar juice of grass stems. In many plants, the death of pith parenchyma cells reduces their stem water content. Previous studies proposed that a hypothetical D gene might be responsible for the death of stem pith parenchyma cells in Sorghum bicolor, a promising energy grass, although its identity and molecular function are unknown. Here, we identify the D gene and note that it is located on chromosome 6 in agreement with previous predictions. Sorghum varieties with a functional D allele had stems enriched with dry, dead pith parenchyma cells, whereas those with each of six independent nonfunctional D alleles had stems enriched with juicy, living pith parenchyma cells. D expression was spatiotemporally coupled with the appearance of dead, air-filled pith parenchyma cells in sorghum stems. Among D homologs that are present in flowering plants, Arabidopsis ANAC074 also is required for the death of stem pith parenchyma cells. D and ANAC074 encode previously uncharacterized NAC transcription factors and are sufficient to ectopically induce programmed death of Arabidopsis culture cells via the activation of autolytic enzymes. Taken together, these results indicate that D and its Arabidopsis ortholog, ANAC074, are master transcriptional switches that induce programmed death of stem pith parenchyma cells. Thus, targeting the D gene will provide an approach to breeding crops for sugar and ethanol production.

Keywords: NAC transcription factor; pith parenchyma; programmed cell death; sorghum; stem.


Conflict of interest statement

Conflict of interest statement: J.-i. Yonemaru, H.K., T.M., N.T., and S.K. are listed on a patent based on this work (Japanese patent P2015-025241), which was filed by NARO.

Figures

Fig. 1.
Fig. 1.
Phenotypes of dry- and juicy-stem sorghum varieties. (A) Stem juice content in Senkinshiro (SKS, dry-stem variety) and Nakei-MS3B (MS3B, juicy-stem variety) at 30 DAH. Error bars show SD (n = 5, ***P < 0.001). (B) Sugar concentration (Brix value) in stem juice of SKS and MS3B at 30 DAH. Error bars show SD (n = 5). (C) Stem sugar content of SKS and MS3B at 30 DAH. Error bars show SD (n = 5, ***P < 0.001). (D) Whole and magnified cross-sections of the third internodes in SKS and MS3B stems at 9 WAP. White-colored tissues in the cross-sections (Upper) indicate dry pith parenchyma. Darker cells (Lower) indicate dead air-filled pith parenchyma cells. Red and blue arrowheads mark representative examples of air bubbles and cellular contents, respectively. (E) Air porosity of the third internodes in SKS and MS3B stems at 9 WAP. Error bars show SD (n = 3, **P < 0.01). (F) Hoechst 33342-stained vertical sections of the third internodes in SKS and MS3B stems at 9 WAP. Arrowheads indicate nuclei. (G) Percentage of pith parenchyma cells with Hoechst 33342-stained nuclei (calculated from six 0.25-mm2 images containing ∼24–40 cells) in the third internodes of SKS and MS3B stems at 9 WAP. Error bars show SD (n = 6, ***P < 0.001). (H) Evans blue-stained cross-section images of the first internodes of SKS and MS3B stems at 11 WAP. Insets display magnified images of a vascular bundle. White arrowheads indicate tracheary elements. (Scale bars: 5 mm and 100 µm in Upper and Lower, respectively, of D; 100 µm in F; and 2 mm and 50 μm in Lower Right and Upper Right, respectively, in H.)
Fig. 2.
Fig. 2.
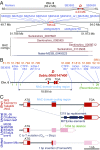
Identification of D in sorghum. (A) Rough mapping of the D locus. Red bidirectional arrows show the candidate region of the D locus. Blue vertical bars show molecular marker positions. Dark red and blue horizontal lines show SKS and MS3B-derived BAC clone contigs, respectively. (B) Fine mapping of the D locus. Blue vertical bars show molecular marker positions. Light gray and red boxes show untranslated and coding regions of D (Sobic.006G147400), respectively. Light blue lines show NAC domain-coding regions. (C) Gene structures of D alleles in 13 sorghum cultivars. Blue and green dashed lines indicate deletion regions in juicy-stem varieties. Dark blue boxes mark MITE-like elements. Blue arrows indicate nonfunctional mutation positions.
Fig. 3.
Fig. 3.
D expression during the formation of dry pith parenchyma in sorghum stems. (A) Graphical presentation of 74LH3213 and d-NIL genotypes. Gray and blue boxes indicate homozygous regions from 74LH3213 and SIL-05, respectively. (B) Positions and cross-sections of panicle base (PB) and each stem internode (IN) of 74LH3213 and d-NIL at 8 WAP. (C) Quantitative RT-PCR analysis of relative D mRNA levels (normalized with respect to actin mRNA levels) in PB and each IN of 74LH3213 (red bars) and d-NIL (blue bars) at 8 WAP. The expression level in the first internode (IN1) of 74LH3213 was defined as 1.00. Error bars show SD (n = 3). (D) Image of the fifth internode cross-section of 74LH3213 at 8 WAP, which was used to examine D expression. Total RNA was extracted from each portion within the red, orange, and blue rectangles (regions 1–3, respectively). (E) Quantitative RT-PCR analysis of relative D mRNA levels (normalized with respect to actin mRNA levels) in the three regions as shown in D. The expression level in region 2 was defined as 1.00. Error bars show SD (n = 3, *P < 0.005, **P < 0.0001). (F) Cross-sections of the second stem internodes of 74LH3213 at 7–11 WAP. (G) Quantitative RT-PCR analysis of relative D mRNA levels (normalized with respect to actin mRNA levels) in the second stem internodes of 74LH3213 at 7–11 WAP. The expression level at 7 WAP was defined as 1.0. Error bars show SD (n = 3). (H) In situ RNA hybridization with D antisense probe (Left) and sense probe (Right, the negative control) in cross-sections of the second stem internode of 74LH3213 at 8 WAP. Arrowheads indicate cells with violet staining derived from transcript-specific hybridization. (Scale bars: 10 cm and 5 mm in Upper and Lower, respectively, of B; 5 mm in D and F; and 300 μm in H.)
Fig. 4.
Fig. 4.
Developmental functions of ANAC74 in Arabidopsis. (A) Quantitative RT-PCR analysis of ANAC074 mRNA levels (normalized with respect to UBQ10 mRNA levels) in seedlings, young leaves, mature leaves, flower buds, and flowers in 50- and 65-d-old hypocotyls and in 35-, 50-, and 65-d-old inflorescence stems. The expression level in 10-d-old seedlings was defined as 1.00. Error bars show SD (n = 3). Different letters indicate statistically significant differences (Tukey’s honestly significant difference; α = 0.05). (B) Histochemical staining of Arabidopsis expressing the GUS reporter gene under control of the ANAC074 promoter. Left and Right show images of 65-d-old inflorescence stem and its cross-section, respectively. (C) Subcellular localization of ANAC074-GFP in pith parenchyma cells of 65-d-old inflorescence stem. Arrowheads indicate nuclei. (D) Evans blue-stained 75-d-old inflorescence stem cross-section images of wild-type, anac074, and anac074 expressing ANAC074-GFP, D-GFP, or OsD-GFP under control of the ANAC074 promoter and terminator regions (anac074 ANAC074pro::ANAC074-GFP, anac074 ANAC074pro::D-GFP, and anac074 ANAC074pro::OsD-GFP). White arrowheads and red asterisks indicate tracheary elements and pith parenchyma, respectively. (Scale bars: 1 mm and 200 μm in Left and Right of B; 100 µm in C; and 200 µm in D.)
Fig. 5.
Fig. 5.
Cellular effects of estrogen-induced overexpression of D and ANAC074. (A) Bright-field (BF) and fluorescent images of DAPI-stained Arabidopsis wild-type culture cells and cells harboring LexA::D, LexA::ANAC074, LexA::OsD, LexA::NAC1, and LexA::VND6 with or without estrogen immediately after (0 h) and 48 h after addition of estrogen. Arrowheads indicate cells without plastids and DAPI-stained nuclei. (B) Bright-field images of Evans blue-stained wild-type, LexA::D, LexA::ANAC074, LexA::OsD, LexA::NAC1, and LexA::VND6 cells with or without estrogen. All images were acquired at 48 h after the addition of estrogen. (C) Percentage of Evans blue-stained cells immediately after (0 h) and 48 h after the addition of estrogen. −E and +E indicate culture conditions without and with estrogen, respectively. Error bars show SD (n = 3). Different letters indicate statistically significant differences (Tukey’s honestly significant difference; α = 0.05). (D) BF and fluorescent images of WGA-stained wild-type, LexA::D, LexA::ANAC074, LexA::OsD, LexA::NAC1, and LexA::VND6 cells with or without estrogen. All images were acquired at 96 h after the addition of estrogen. Arrowheads indicate cells with WGA-stained secondary cell walls. (Scale bars: 50 µm in A, B, and D.)
Fig. 6.
Fig. 6.
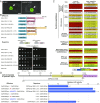
Molecular functions of D and ANAC074. (A) Localization of D-GFP and ANAC074-GFP in nuclei (arrowheads) of Arabidopsis culture cells. (B) Transactivation assay of D and ANAC074 in yeast cells. (Upper) Effectors and reporters used in this assay. The GAL4 BD and its fusions of the N- and/or C-terminal half of D or ANAC074 serve as effectors. HIS3 and ADE2 genes under control of GAL4-binding sites serve as reporters. (Lower) Growth of yeast cells expressing each effector in the presence or absence of histidine and adenine. (C) Changes in the expression levels of Arabidopsis genes encoding PCD-related peptidases, acyltransferases, and nucleases. Color scale indicates fold-changes in gene expression level (on a log-2 scale). Asterisks represent statistically significant changes. (D) Luciferase (LUC)-based transactivation assay in Arabidopsis culture cell protoplasts. (Upper) Schematic of the 555-bp CEP1/AT5G50260 5′-upstream genomic region, CEP1pro(−555), used in this assay. The position of the start codon (ATG) of CEP1/AT5G50260 is numbered as +1. (Lower) Bar graphs represent the relative activities of firefly LUC in Arabidopsis culture cell protoplasts transfected with the indicated combinations of the effector and reporter constructs. LUC activity in each protoplast was normalized with respect to Renilla luciferase activity from the cotransfected internal control construct, and are presented as relative LUC activity. Cauliflower mosaic virus 35S promoter (CaMV35Spro) and terminator (CaMV35Ster) serve as the regulatory elements of D or ANAC074 in the effectors. CEP1pro(−555) or CaMV35Spro and CaMV35Ster serve as the regulatory elements of LUC in the reporters. Error bars show SD (n = 5). Relative LUC activity in protoplasts transfected with the effector construct harboring CaMV35Spro::::CaMV35Ster (the only regulatory elements) and the reporter construct harboring CEP1pro(−555)::LUC::CaMV35Ster was defined as 1.0. Different letters indicate statistically significant differences (Tukey’s honestly significant difference; α = 0.05). (Scale bars: 10 µm in A.)
Fig. 7.
Fig. 7.
Expression levels of PCD-related genes in 74LH3123 and d-NIL stems. Quantitative RT-PCR analysis of relative mRNA levels (normalized with respect to actin mRNA levels) of D, CEP1 family peptidase homologs, XCP1 family peptidase homologs, type II metacaspases homologs, PASPA3 homologs, SCPL48 homologs, BFN1 homologs, and RNS3 homologs in the third internodes of 74LH3123 and d-NIL stems at 8 WAP. The expression level of each gene in 74LH3123 was defined as 1.00. Error bars show SD (n = 3, *P < 0.05, **P < 0.005, ***P < 0.001).

References

    1. Sanchez P, Nehlin L, Greb T. From thin to thick: Major transitions during stem development. Trends Plant Sci. 2012;17:113–121. - PMC - PubMed
    1. Beers EP. Programmed cell death during plant growth and development. Cell Death Differ. 1997;4:649–661. - PubMed
    1. Carr SM, Jaffe MJ. Autolysis in herbaceous, dicotyledonous plants: Experimental manipulation of pith autolysis in several cultivated species. Ann Bot. 1995;75:587–592.
    1. Slewinski TL. Non-structural carbohydrate partitioning in grass stems: A target to increase yield stability, stress tolerance, and biofuel production. J Exp Bot. 2012;63:4647–4670. - PubMed
    1. Aloni B, Pressman E. Stem pithiness in tomato plants: The effect of water-stress and the role of abscisic-acid. Physiol Plant. 1981;51:39–44.

Publication types

MeSH terms

Associated data

LinkOut - more resources