. 2018 Sep 11;115(37):E8642-E8651.
doi: 10.1073/pnas.1717594115. Epub 2018 Aug 27.

Conformational changes in Arp2/3 complex induced by ATP, WASp-VCA, and actin filaments

Affiliations

Conformational changes in Arp2/3 complex induced by ATP, WASp-VCA, and actin filaments

Sofia Espinoza-Sanchez et al. Proc Natl Acad Sci U S A. .

Abstract

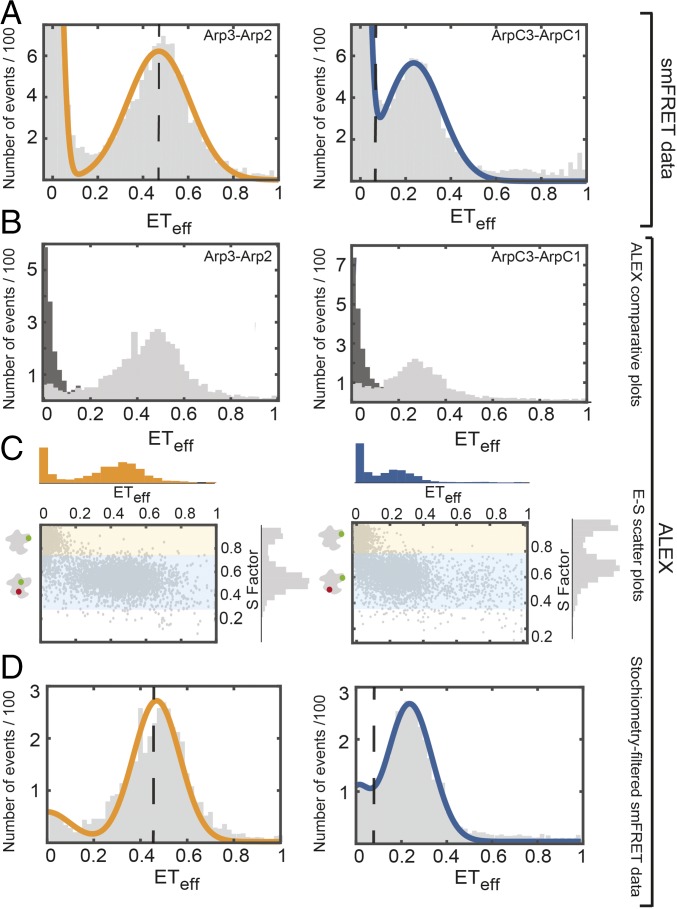
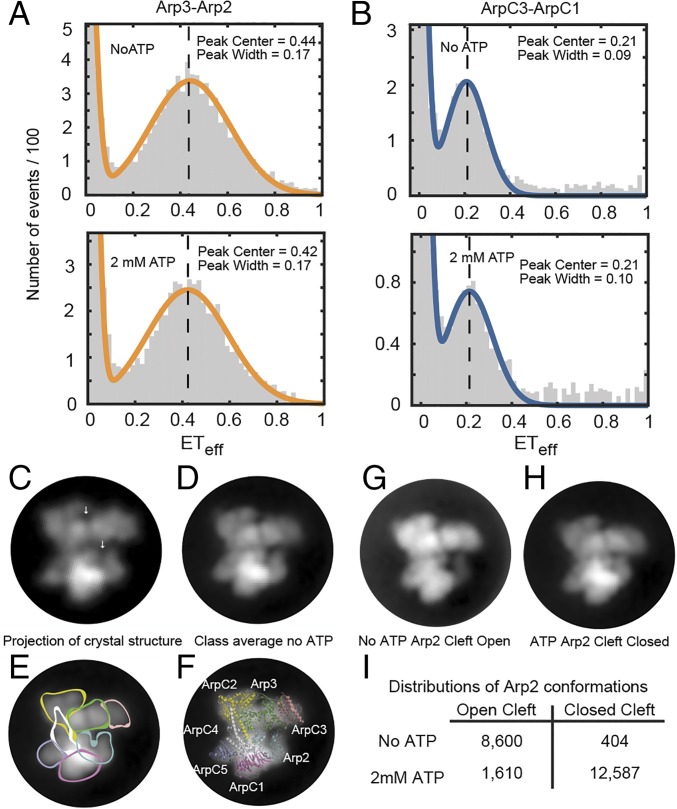
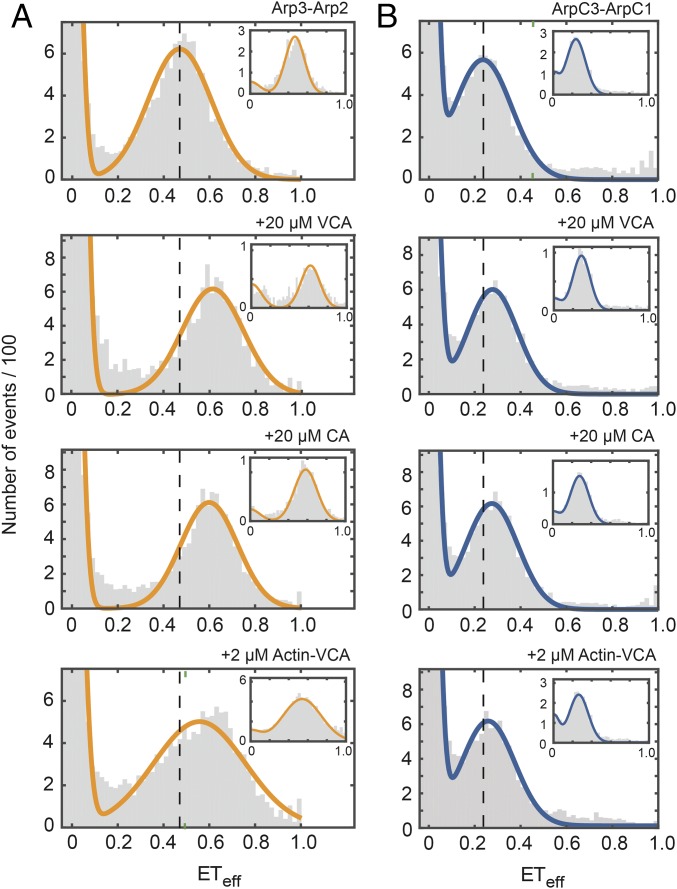
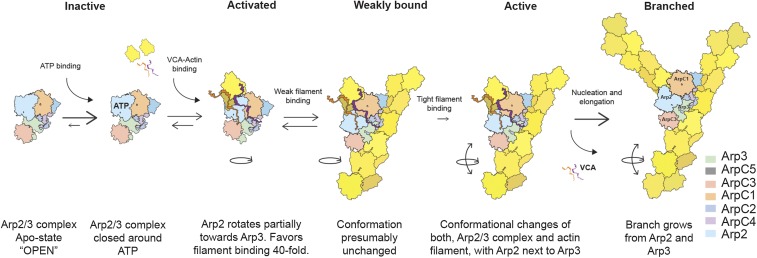
We used fluorescence spectroscopy and EM to determine how binding of ATP, nucleation-promoting factors, actin monomers, and actin filaments changes the conformation of Arp2/3 complex during the process that nucleates an actin filament branch. We mutated subunits of Schizosaccharomyces pombe Arp2/3 complex for labeling with fluorescent dyes at either the C termini of Arp2 and Arp3 or ArpC1 and ArpC3. We measured Förster resonance energy transfer (FRET) efficiency (ETeff) between the dyes in the presence of the various ligands. We also computed class averages from electron micrographs of negatively stained specimens. ATP binding made small conformational changes of the nucleotide-binding cleft of the Arp2 subunit. WASp-VCA, WASp-CA, and WASp-actin-VCA changed the ETeff between the dyes on the Arp2 and Arp3 subunits much more than between dyes on ArpC1 and ArpC3. Ensemble FRET detected an additional structural change that brought ArpC1 and ArpC3 closer together when Arp2/3 complex bound actin filaments. VCA binding to Arp2/3 complex causes a conformational change that favors binding to the side of an actin filament, which allows further changes required to nucleate a daughter filament.

Keywords: Arp2/3 complex; WASp; actin; electron microscopy; fluorescence.


Conflict of interest statement

The authors declare no conflict of interest.

Figures

Fig. 1.
Fig. 1.
Positions of fluorophores on Arp2/3 complex. Front and side views of space-filling models of inactive Arp2/3 complex based on crystal structures [PDB ID codes 1K8K (7) and 4JD2 (43)]. AV calculations of fluorophores (colors) were made with FPS software (36). (A) Fluorophores on the C termini of Arp3 (magenta) and Arp2 (green). (B) Fluorophores on the C termini of ArpC1 (yellow) and ArpC3 (cyan). Interdye distances were calculated using the AV mean fluorophore positions. ETeff values were calculated using Eq. 2.
Fig. 2.
Fig. 2.
Labeled Arp2/3 complexes nucleate and branch actin filaments. (A) Gel electrophoresis of purified and labeled Arp2/3 constructs with data from seven different conditions aligned. Constructs ArpC1cys-ArpC3cys and Arp3cys-Arp3cys were labeled simultaneously with the FRET pair Alexa 488 and Alexa 594. Constructs ArpC1cys-ArpC3tetracys and Arp3cys-Arp2tetracys were labeled sequentially with the FRET pair FlAsH-EDT2 followed by Alexa 568. (Left) Color-coded representation of Arp2/3 complex crystal structure. First gel lane: gel of purified Arp2/3 complex stained with Coomassie blue. Other lanes show the fluorescence of each complex with UV transillumination at 312 nm. EDAS 290 Kodak Molecular Imaging Software was set to SYBR GREEN to image Alexa 488 and FlAsH and to the ethidium bromide channel to image Alexa 568 and Alexa 594. DL, double-labeled; SL, single-labeled. (B) Time course of polymerization of 3 μM actin monomers (10% pyrene-labeled) with 100 nM unlabeled or labeled Arp2/3 complex and 500 nM Wsp1p-VCA at room temperature in KMEI buffer (50 mM KCl, 1 mM MgCl2, 1 mM EGTA, 0.1 mM ATP, 1 mM DTT, and 10 mM imidazole, pH 7.0). (C) TIRF microscopy at intervals of 5 s of 1 μM actin monomers (20% labeled with Alexa-488), 500 nM Wsp1p-VCA and 100 nM of Arp2/3 complex polymerized at room temperature in TIRF buffer [50 mM KCl, 1 mM MgCl2, 1 mM EGTA, 0.1 mM ATP, 1 mM DTT, 10 mM imidazole (pH 7.0), 0.02 mM CaCl2, 15 mM glucose, 0.02 mg/mL catalase, and 0.1 mg/mL glucose oxidase with 0.25% methylcellulose].
Fig. 3.
Fig. 3.
smFRET and ALEX measurements show single populations of labeled Arp2/3 complex. (Left) Arp2cys-Arp3cys construct. (Right) ArpC1cys-ArpC3cys construct. Conditions: 75 pM Arp2/3 complex and 40 nM unlabeled Arp2/3 complex in KMET buffer (50 mM KCl, 1 mM MgCl2, 1 mM EGTA, 0.1 mM ATP, 1 mM DTT, and 10 mM Tris⋅HCl, pH 7.0). (A) Distribution of diffusion-based smFRET events with continuous wave, monochromatic excitation. (B) Distributions of donor-only and donor-acceptor molecules sorted by ALEX (38) with donor-only events in dark gray and donor-acceptor events in light gray. (C) Scatter plots of ETeff vs. stoichiometry (E-S) with histograms for E along the x axis and for S along the y axis. Ratio E sorts species according to FRET, and ratio S sorts species according to donor-acceptor stoichiometry. Donor-only species have low E and high S. (D) Stoichiometry-filtered smFRET histograms using ALEX analysis to exclude donor-only species. Orange: fitted curve for the Arp2cys-Arp3cys construct. Blue: fitted curve for the ArpC1cys-ArpC3cys construct. Dashed black lines: locations of ETeff peaks predicted from AV simulations based on the crystal structure of inactive Arp2/3 complex (Fig. 1).
Fig. 4.
Fig. 4.
Effect of ATP on the conformation of Arp2/3 complex. (A and B) smFRET experiments (Upper) without ATP and (Lower) with 2 mM ATP. Conditions: 75 pM Arp2/3 complex and 40 nM unlabeled Arp2/3 complex in KMET buffer (50 mM KCl, 1 mM MgCl2, 1 mM EGTA, 1 mM DTT, and 10 mM Tris⋅HCl, pH 7.0). Vertical dashed lines indicate the mean of the ETeff peaks without ATP as a visual guide. (A) Arp2cys-Arp3cys construct. (B) ArpC1cys-ArpC3cys construct. (C) Low-resolution (20 Å) 2D projection of the crystal structure of bovine Arp2/3 complex with Ca-ATP in the same orientation as the negative stain class averages. The model was made from PDB ID code 4JD2 with mouse GMF deleted. White arrows indicate the nucleotide-binding clefts of Arp2 (lower) and Arp3 (upper). (DG) Transmission EM of negatively stained Arp2/3 complex without ATP. Virtually all of the particles had the same orientation. After correction for drift, particles were classified and class averages computed. (D) A dominant class average of the projection structure of Arp2/3 complex without ATP computed from 2,066 particles. (E) Subunits are outlined on the class average. (F) A ribbon diagram of the crystal structure of inactive Arp2/3 complex is superimposed on the class average. (G) Dominant class average without ATP (1,636 particles) with the nucleotide-binding cleft of Arp2 open. (H) Dominant class average with ATP with the nucleotide-binding cleft of Arp2 closed. (I) Numbers of particles in two class averages.
Fig. 5.
Fig. 5.
VCA/CA ligands increase the FRET efficiency between labels on Arp2 and Arp3 more than between labels on ArpC1 and ArpC3. Distributions of diffusion-based smFRET events for (A) Arp2cys-Arp3cys construct and (B) ArpC1cys-ArpC3cys construct. Conditions: 75 pM labeled Arp2/3 complex in KMET buffer (50 mM KCl, 1 mM MgCl2, 1 mM EGTA, 0.1 mM ATP, 1 mM DTT, and 10 mM Tris⋅HCl, pH 7.0) with top row, 40 nM unlabeled Arp2/3 complex; second row, 20 μM WASP-VCA from fission yeast Wsp1p; third row, 20 μM WASP-CA from fission yeast Wsp1p; and fourth row, 2 μM actin-VCA from fission yeast Wsp1p. (Insets) Representative stoichiometry-filtered ALEX histograms. Gray: representative histograms of smFRET events collected over 60 min. Orange: fitted curves for Arp2cys-Arp3cys construct. Blue: fitted curves for ArpC1cys-ArpC3cys construct. Vertical dashed reference lines indicate the peak center for Arp2/3 complex alone.
Fig. 6.
Fig. 6.
Electron micrographs of Arp2/3 complex with GST-VCA. Samples of 50 nM Arp2/3 complex, 0.25 µM GST-VCA, and 0.2 mM ATP were negatively stained, imaged by transmission EM, and sorted into classes. (A and B) Analysis by calculating 70 class averages with the ISAC module in EMAN2/Sparx. (A) Top 24 class averages. (B) Angular distribution of GST around Arp2/3 complex with numbers of class averages on the radial axis. (CE) Two-dimensional classification of the same dataset with Relion yields 11 well-resolved class averages. (C) One example of six class averages including 7,187 (61%) particles that appear like Arp2/3 complex without GST-VCA. The arrow points at ArpC5. (D) Two examples of class averages of particles with foreshortened ArpC5 (arrow) including 4,596 (39%) particles. (E) Orientations of three line scans used to measure dimensions of Arp2/3 complex class averages: D, diagonal; H, horizontal; V, vertical. (F) Mean dimensions (±1 SD).
Fig. 7.
Fig. 7.
Actin filaments increase the FRET efficiency between dyes on both Arp2/Arp3 and ArpC1/ArpC3. Ensemble ETeff measurements of 20 nM Arp2/3 complex labeled (blue) with FlAsH on ArpC3 and Alexa 568 on ArpC1 or (orange) with FlAsH on Arp2 and Alexa 568 on Arp3. The measurements are differences between the ETeff values of Arp2/3 complex alone and with the each ligand. Conditions: 50 mM KCl, 1 mM MgCl2, 1 mM EGTA, 0.1 mM ATP, 1 mM DTT, and 10 mM imidazole, pH 7.0, unless indicated otherwise. (A) Titration of Arp2/3 complex with Wsp1p-VCA. (B) Titration of Arp2/3 complex with polymerized actin with overnight incubation. (C) Titration of Arp2/3 complex and 10 μM polymerized actin with Wsp1p-VCA. (D) Interleaved scatter plot of differences in mean ETeff values (±1 SD) of labeled Arp2/3 complex alone and in the presence of 2 mM ATP and with 2 mM ATP and various ligands: 20 µM Wsp1p-CA, 20 µM Wsp1p-VCA, 20 µM GST-VCA, 2 µM actin-VCA (actin monomer covalently linked to VCA), 10 µM polymerized actin with 10 µM VCA, or 20 µM polymerized actin. Numbers of repetitions are in parentheses.
Fig. 8.
Fig. 8.
Pathway of actin filament branch formation by Arp2/3 complex. Binding of ATP to inactive Arp2/3 complex closes the nucleotide-binding clefts of Arp2 and Arp3. Binding of VCA or actin-VCA promotes movement of Arp2 to an activated intermediate conformation that favors binding to the side of a mother filament. Weak binding to a mother filament followed a further conformational change that strengthens Arp2/3 complex binding to the filament and favors nucleation of the daughter filament.

References

    1. Pollard TD, Borisy GG. Cellular motility driven by assembly and disassembly of actin filaments. Cell. 2003;112:453–465. - PubMed
    1. Goley ED, Welch MD. The ARP2/3 complex: An actin nucleator comes of age. Nat Rev Mol Cell Biol. 2006;7:713–726. - PubMed
    1. Pollard TD, Blanchoin L, Mullins RD. Molecular mechanisms controlling actin filament dynamics in nonmuscle cells. Annu Rev Biophys Biomol Struct. 2000;29:545–576. - PubMed
    1. Sept D, McCammon JA. Thermodynamics and kinetics of actin filament nucleation. Biophys J. 2001;81:667–674. - PMC - PubMed
    1. Chhabra ES, Higgs HN. The many faces of actin: Matching assembly factors with cellular structures. Nat Cell Biol. 2007;9:1110–1121. - PubMed

Publication types

MeSH terms

Substances