. 2018 Aug 27;9(1):3465.
doi: 10.1038/s41467-018-05958-z.

LRRK2 kinase regulates α-synuclein propagation via RAB35 phosphorylation

Affiliations

LRRK2 kinase regulates α-synuclein propagation via RAB35 phosphorylation

Eun-Jin Bae et al. Nat Commun. .

Abstract

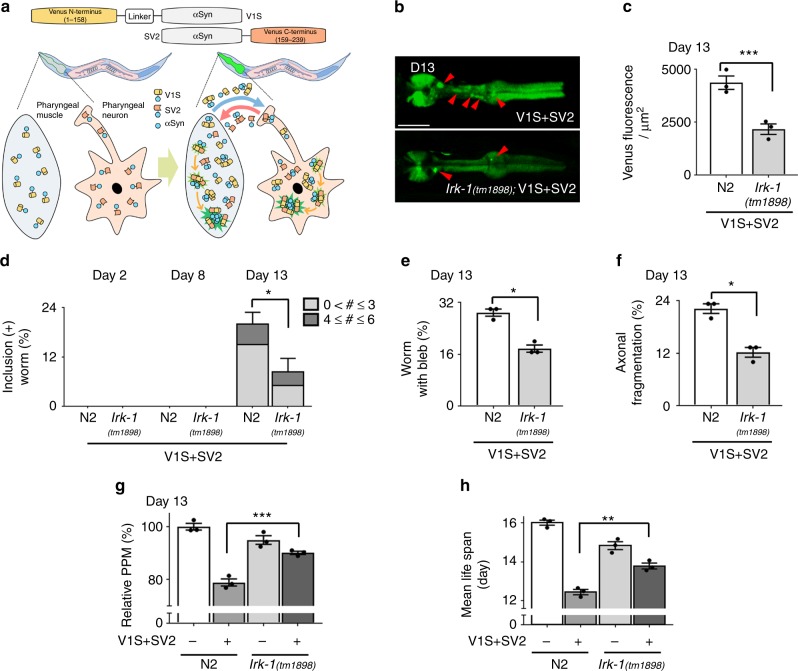
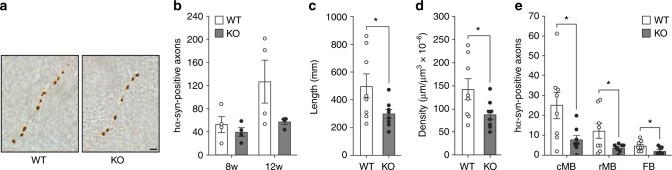
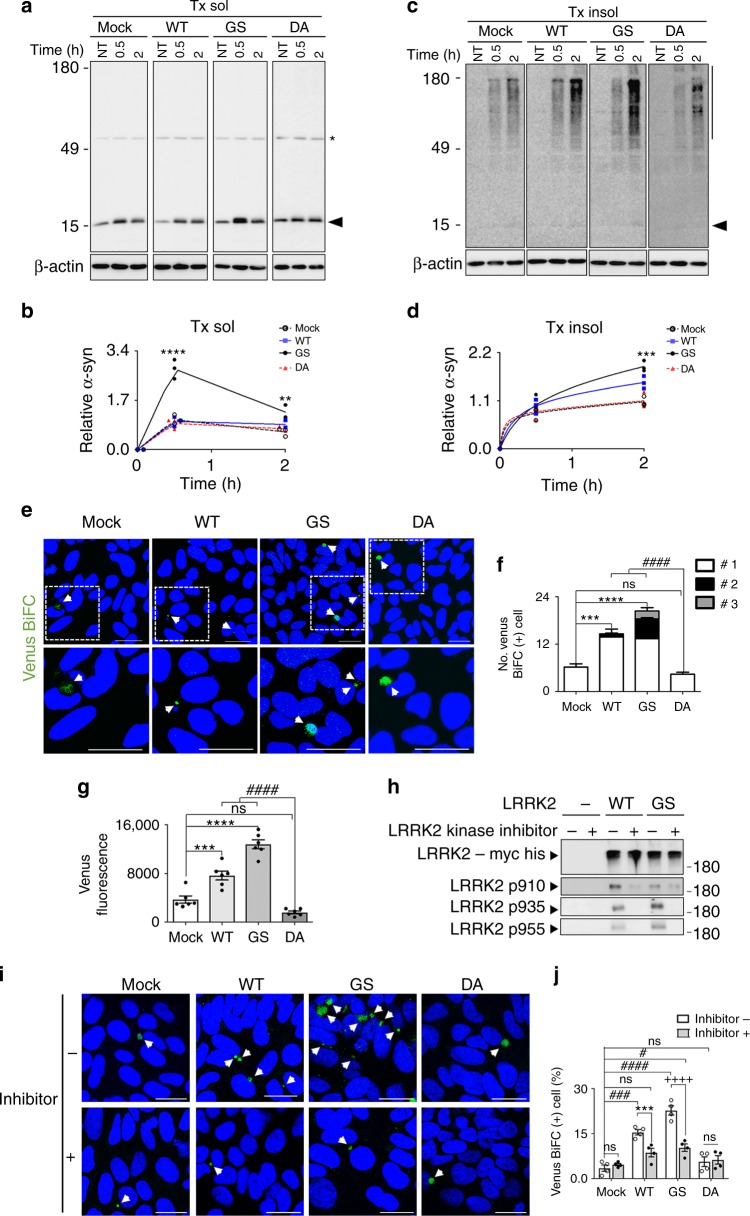
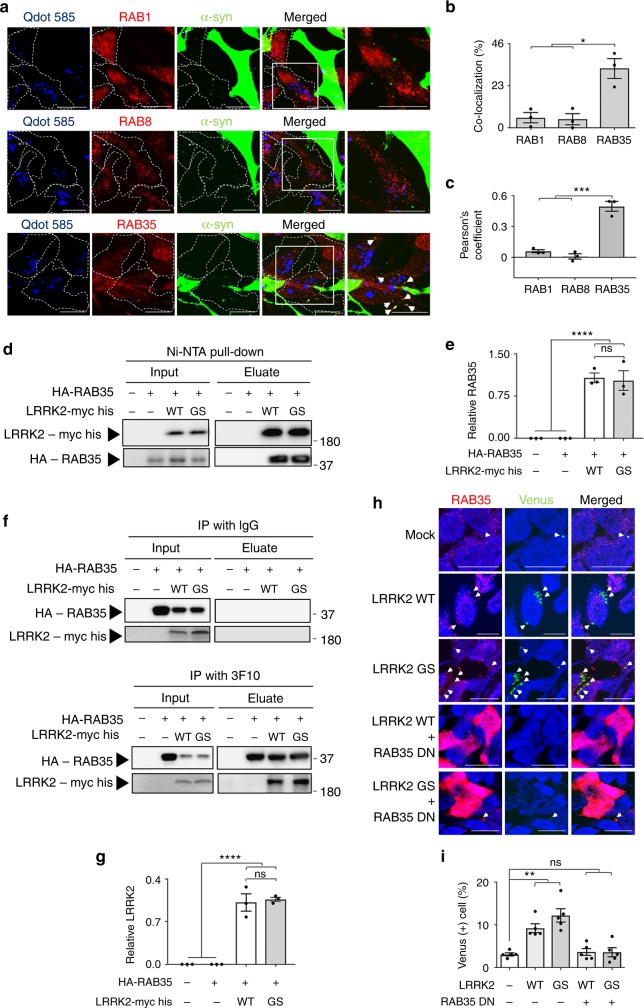
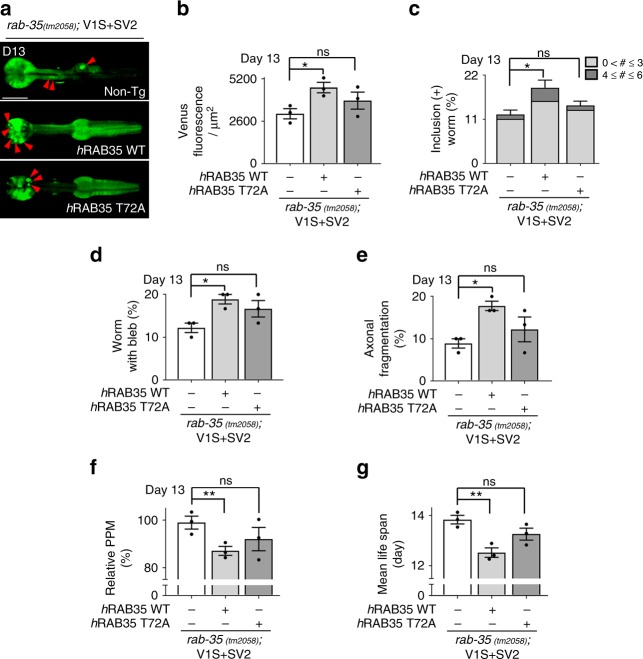
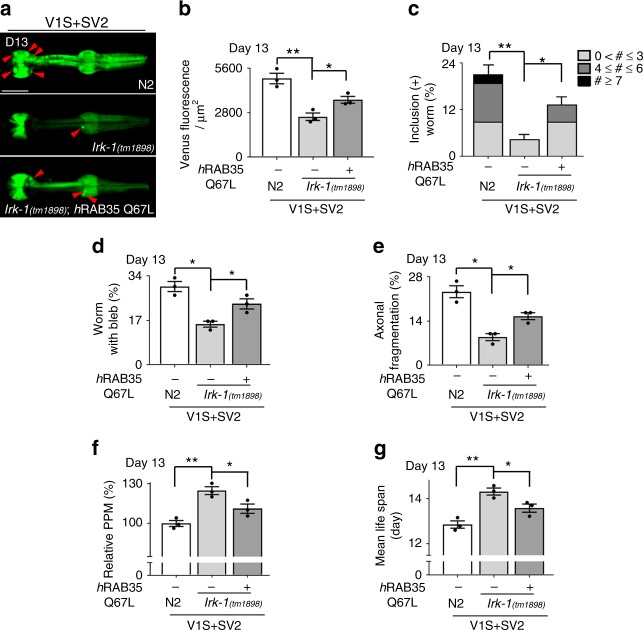
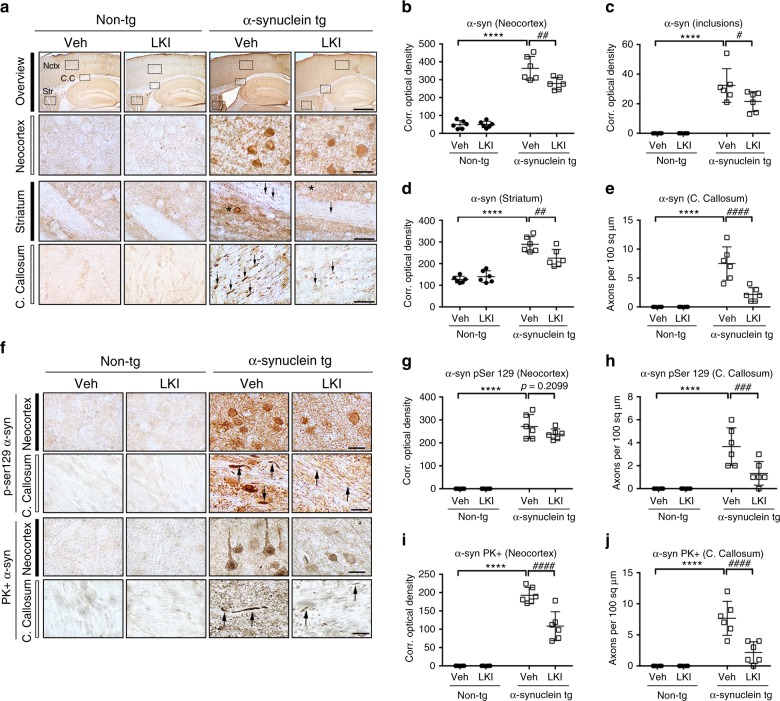
Propagation of α-synuclein aggregates has been suggested as a contributing factor in Parkinson's disease (PD) progression. However, the molecular mechanisms underlying α-synuclein aggregation are not fully understood. Here, we demonstrate in cell culture, nematode, and rodent models of PD that leucine-rich repeat kinase 2 (LRRK2), a PD-linked kinase, modulates α-synuclein propagation in a kinase activity-dependent manner. The PD-linked G2019S mutation in LRRK2, which increases kinase activity, enhances propagation efficiency. Furthermore, we show that the role of LRRK2 in α-synuclein propagation is mediated by RAB35 phosphorylation. Constitutive activation of RAB35 overrides the reduced α-synuclein propagation phenotype in lrk-1 mutant C. elegans. Finally, in a mouse model of synucleinopathy, administration of an LRRK2 kinase inhibitor reduced α-synuclein aggregation via enhanced interaction of α-synuclein with the lysosomal degradation pathway. These results suggest that LRRK2-mediated RAB35 phosphorylation is a potential therapeutic target for modifying disease progression.


Conflict of interest statement

S.J.L. received research grants from and is a stock-holder of Abl Bio. The remaining authors declare no competing interests.

Figures

Fig. 1
Fig. 1
Effects of lrk-1 deficiency in α-synuclein propagation. a Scheme of the propagation of α-synuclein propagation model in C. elegans. b Venus BiFC fluorescence in wild-type and lrk-1(tm1898) mutant worms at day 13. The red arrowheads: inclusions in pharynx. c Quantification of Venus BiFC fluorescence at day 13. Twenty worms for each line were used, N = 3, *** P < 0.001. d Venus BiFC-positive inclusions with aging. The color bars in graph (d) represent quantification of number of Venus BiFC-positive inclusions in each BiFC transgenic line. Twenty worms for each line were used, N = 3, * P < 0.05. e, f Nerve degeneration. Percentage of worms with axonal bleb (e) and with fragmented axonal processes (f) in URA motor neurons in each transgenic line at day 13. Thirty worms for each line were used (N = 3 in each group), * p < 0.05. Error bars represent SEM and P values, including * p < 0.05, *** p < 0.001, were calculated by unpaired, two-tailed Student’s t test. g Relative pharyngeal pumping rates at day 13. Thirty worms for each line were used (N = 3 in each group). F(3, 270) = 65.620, *** p < 0.001 by one-way ANOVA with Tukey's post hoc test. h Life span analyses. One hundred worms for each line were used (N = 3 in each group). F(3, 9) = 91.860, ** p < 0.01 by one-way ANOVA with Tukey's post hoc test. All values shown in the figure represent mean ± SEM
Fig. 2
Fig. 2
Effects of Lrrk2 ablation in α-synuclein spreading in rats. Spreading of α-synuclein is decreased in LRRK2-deficient rats. Wild-type (WT) and LRRK2-deficient (KO) rats received a single injection of AAVs encoding human α-synuclein (hα-syn) into the left vagus nerve. Spreading of α-synuclein was analyzed 8 and 12 weeks later. a Representative images of axons stained with an antibody against human α-synuclein in the left (AAV-injected side) pons of a WT and a KO rat killed at 12 weeks post-AAV injection. Scale bar: 5 μm. b The number of axons immunoreactive for human α-synuclein was quantified in the left pons (Bregma: −9.48 mm) of WT (N = 4/time point) and KO (N = 4/time point) rats. Error bars represent SEM. c, d Length (c) and density (d) of axons immunoreactive for human α-synuclein were estimated in the left pons in an area encompassing the coeruleus/subcoeruleus complex and the parabrachial nucleus. Samples were obtained from rats killed at 8 (N = 4 WT and N = 4 KO) and 12 (N = 4 WT and N = 4 KO) weeks post-AAV injection and, for each animal, measurements were carried out on three separate pontine sections. Data at the two time points were pooled and analyzed together. Error bars represent SEM, * p < 0.05 by unpaired, two-tailed Student’s t test. e The number of axons positive for human α-synuclein was quantified in the left caudal midbrain (cMB; Bregma: −7.8 mm), rostral midbrain (rMB; Bregma: −6.0 mm) and forebrain (FB; Bregma: −2.4 mm) of WT (N = 4 at 8 weeks and N = 4 at 12 weeks) and KO (N = 4 at 8 weeks and N = 4 at 12 weeks) rats. Error bars represent SEM, * p < 0.05 by unpaired, two-tailed Student’s t test
Fig. 3
Fig. 3
LRRK2 kinase activity regulates propagation of α-synuclein. a-d The accumulation of internalized α-synuclein in Triton X-100 soluble fraction (Tx sol) (a, b) and Triton X-100 insoluble fraction (Tx insol) (c, d). The α-synuclein monoclonal antibody Syn-1 from BD Biosciences was used for detection of α-synuclein. NT represents non-treated control. Arrowheads in a and c indicate α-synuclein monomer. Bar on the right side of blot in c represents the α-synuclein aggregates. Asterisk in a represents non-specific binding of antibody. Quantified regions were indicated on the right as an arrowhead in a and a line in (c). Black open circle: Mock, blue closed square: LRRK2 WT, black closed circle: LRRK2 G2019S (GS), red closed triangle: LRRK2 D1994A (DA). b, d Relative levels of internalized α-synuclein in Tx sol (b) and Tx insol (d). b N = 3, Transgene F(3,24)=60.79, Time F(2,24)=264.8, Interaction F(6,24)=28.42, ** p < 0.01, **** p < 0.001. d N = 3, Transgene F(3,24)=13.23, Time F(2,24)=352.2, Interaction F(6,24)=7.237, * p < 0.05, *** p < 0.005, Graphs in b, d were analyzed by two-way ANOVA with Dunnet’s post hoc test. e, f Alterations in LRRK2 kinase activity regulate propagation of α-synuclein. e The effects of LRRK2 kinase activity on the propagation of α-synuclein. Arrowhead: Venus BiFC puncta. Blue: Nuclei. Scale: 20 μm. f The number of Venus BiFC (+) cell. The color bars in graph (f) represent the number of Venus BiFC puncta in Venus BiFC fluorescence (+) cells. Five independent experiments were performed. Two hundred cells were analyzed per each experiment. Y axis represents the number of Venus BiFC(+) cells out of 200 cells analyzed. Transgene F(3,48)=3.09, Puncta number F(2,48)=172.1, Interaction F(6,48)=10.4, ns: not significant, *** p < 0.005, **** p < 0.001, #### p < 0.001 by two-way ANOVA with Tukey’s post hoc test. g Effects of LRRK2 kinase activity on the secondary secretion of Venus (+) α-synuclein aggregates. N = 6, F(3,20)=44.77, ns: not significant, *** p < 0.005, **** p < 0.001, #### p < 0.001 by one-way ANOVA with Tukey’s post hoc test. hj Pharmacological inhibition of LRRK2 kinase activity diminishes LRRK2-induced α-synuclein propagation. h The autophosphorylation of LRRK2. i The propagation of α-synuclein. Arrowhead: Venus BiFC puncta. Blue: Nuclei. Scale: 20 μm. j Quantification of Venus BiFC fluorescence (+) cell (%). Four independent experiments were performed. Two hundred cells were analyzed per each experiment. Treatment F(1,24)=24.12, Transgene F(3,24)=41.28, Interaction F(3,24)=13.35, ns: not significant, *** p < 0.005, ++++ p < 0.0001, # p < 0.05, ### p < 0.005, #### p < 0.0001 by two-way ANOVA with Tukey’s post hoc test. Data are represented as mean ± SEM
Fig. 4
Fig. 4
RAB35 mediates LRRK2-induced propagation of α-synuclein. a-c Localization of transferred α-synuclein in the co-culture of α-synuclein overexpressing SH-SY5Y cells (donor cells) and naive SH-SY5Y cells (recipient cells labeled with Q tracker). a The localization of transmitted α-synuclein was analyzed by co-immunostaining with RAB proteins (RAB1, RAB8, and RAB35). Red: RAB proteins, Blue: Qdot 585, recipient cell marker, arrowhead: transmitted α-synuclein, colocalized with RAB proteins, scale bar: 20 μm. The percentage of RAB (+) transmitted α-synuclein was quantified in b. Three independent experiments were performed. Three hundred cells were analyzed per each experiment. F(2,6)=16.09, * p < 0.05 by one-way ANOVA with Dunnet’s post hoc test. The pearson’s coefficient was calculated in (c). Three independent experiments were performed. Fifty cells were analyzed per each experiment. F(2,6)=68.1, *** p < 0.005 determined by one-way ANOVA with Dunnet’s post hoc test. dg Interaction between LRRK2 and RAB35. WT: LRRK2 WT, GS: LRRK2 G2019S. d Pull-down assay of 6X histidine conjugated LRRK2 with nickel beads. The relative levels of eluted RAB35 were calculated in e. N = 3, F(3,8)=39.08, ns: not significant, **** p < 0.0001 by one-way ANOVA with Tukey’s post hoc test. f Immunoprecipitation of RAB35 with 3F10, monoclonal antibody against HA tag. Mouse IgG was used as a control. The relative levels of eluted LRRK2 were quantified in g. N = 3, F(3,8)=66.84, ns: not significant, **** p < 0.0001 by one-way ANOVA with Tukey’s post hoc test. h, i Dominant-negative mutant RAB35 S22N (RAB35 DN) ameliorated LRRK2-induced-propagation of α-synuclein. Propagation of α-synuclein aggregates were calculated by measuring the Venus BiFC (+) cell (%). Arrowhead: Venus BiFC (+) puncta, red: RAB35, blue: nuclei, scale: 20 μm. The percentage of Venus BiFC (+) cells was calculated in (i). Five independent experiments were performed. Three hundred cells were analyzed per each experiment. F(4,20)=15.79, ns: non-significant, ** p < 0.01 by one-way ANOVA with Dunnet’s post hoc test. Data are represented as mean ± SEM
Fig. 5
Fig. 5
Mutation in rab-35 resulted in the similar phenotypes as lrk-1. a, b Venus BiFC fluorescence in wild-type and rab-35 transgenic models at day 13. The red arrowheads point to Venus BiFC-positive inclusions in pharynx. Twenty worms for each line were used (N = 3 in each group), * p < 0.05, Scale bars: 200 μm. c Worms with Venus BiFC-positive inclusions were quantified at the different ages. The color bars in graph (c) indicate percentages of Venus BiFC-positive inclusions. Thirty worms for each line were used (N = 3 in each group), * P < 0.05. d Quantification of worms that have axonal blebs. e Nerve fragmentation of each transgenic line at day 13. f Relative pharyngeal pumping rates at day 13. Thirty worms for each line were used (N = 3 in each group), * p < 0.05. All error bars represent SEM, P value, * p < 0.05, was measured by unpaired, two-tailed Student’s t test. g Mean life span. One hundred worms for each line were used (N = 3 in each group). F(3, 9)=33.730, P value,* p < 0.05, was calculated by one-way ANOVA with Tukey's post hoc test. All values are represented as mean ± SEM
Fig. 6
Fig. 6
RAB35 Phosphorylation is necessary for regulation of α-synuclein propagation. a Venus BiFC fluorescence in Non-Transgenic (Non-Tg), hRAB35 WT, and hRAB35 T72A transgenic line at day 13. The red arrowheads indicate Venus BiFC-positive inclusions in pharynx. Scale bars: 200 μm. b Quantification of Venus BiFC fluorescence at day 13. Thirty worms for each line were used (N = 3 in each group). F(2, 6)=4.105, ns: not significant, * p < 0.05. c Worms with Venus BiFC-positive inclusions at day 13. The color bars in graph (c) show percentages of worms that have Venus BiFC-positive inclusions in rab-35 (tm2058) BiFC transgenic background. Thirty worms for each line were used (N = 3 in each group). F(2, 6)=4.670, ns: not significant, * p < 0.05. d, e Quantification of axonal bleb number (d) and fragmentation (e) at day 13. Thirty worms for each line were used (N = 3 in each group). F(2, 6)=5.607 (d), F(2, 6)=5.450 (e), ns: not significant, * p < 0.05. f Relative pharyngeal pumping rates at day 13. Thirty worms for each line were used (N = 3 in each group). F(2, 180)=4.421, ns: not significant, ** p < 0.01. g Mean life span (N = 3 in each group). One hundred worms for each line were used (N = 3 in each group). F(2, 6)=10.750, ns: not significant, ** p < 0.01. All values shown in figures are represented as mean ± SEM. P values, including ns: not significant, * p < 0.05, ** p < 0.01, were calculated by one-way ANOVA with Dunnet’s post hoc test
Fig. 7
Fig. 7
RAB35 mediates α-synuclein propagation in the downstream of lrk-1. a, b Venus BiFC fluorescence in wild-type, lrk-1 background worm, and hRAB35 Q67 L transgenic in lrk-1 background worm at day 13. The red arrowheads designate inclusions in pharynx. Thirty worms for each line were used (N = 3 in each group). F(2, 6)= 21.00, * p < 0.05, ** p < 0.01. Scale bars: 200 μm. c Venus BiFC-positive inclusions at day 13. The color bars in graph (c) display the percentages of Venus BiFC-positive inclusions (+) worms. Thirty worms for each line were used (N = 3 in each group). F(2, 6)=21.13, * p < 0.05, ** p < 0.01. d, e Degeneration of axonal processes. The percentage of worms with neuritic blebs (d) and fragmentation of axonal processes (e) at day 13. Thirty worms for each line were used (N = 3 in each group). F(2, 6)=18.140, (d), F(2, 6)= 25.370 (e), * p < 0.05. f Relative pharyngeal pumping rates at day 13 (N = 3 in each group). F(2, 180)=13.670, * p < 0.05, ** p < 0.01. The transgenic lines expressing constitutively active form showed more severe behavioral defects than lrk-1 transgenic worms. g Mean life span. One hundred worms for each line were used (N = 3 in each group. The overexpression of transgene under the deficiency of lrk-1 worsened disease phenotype. F(2, 6)=18.910, * p < 0.05, ** p < 0.01. All values represent the mean ± SEM. P values, including * p < 0.05, ** p < 0.01, were calculated by one-way ANOVA with Dunnet’s post hoc test
Fig. 8
Fig. 8
Blockade of LRRK2 kinase inhibits α–synuclein propagation in mice. a Representative immunohistochemical analysis of α-synuclein in the neocortex (Nctx), striatum (Str), and corpus callosum (C.C) of non-transgenic (non-tg) and α-syn tg mice. Age-matched mice were injected with either vehicle (Veh) or LRRK2 inhibitor (LKI) for 4 weeks. Scale bars, 250 μm (low magnification) and 25 μm (high magnification). be Optical analysis of α-synuclein deposition in non-tg and α-syn tg mice (b) Optical density analysis of α-synuclein immunoreactivity in neocortex. Treatment F(1,20)=6.601, Genotype F(1,20)=276.8, Interaction F(1,20)=6.919, **** p < 0.001, ## p < 0.01. c The number of α-synuclein inclusion positive cells in neocortex. Treatment F(1,20)=4.034, Genotype F(1,20)=99.61, Interaction F(1,20)=4.034, **** p < 0.001, # p < 0.05. d Optical density analysis of α-synuclein immunoreactivity in striatum. Treatment F(1,20)=3.88, Genotype F(1,20)=96.22, Interaction F(1,20)=9.303, **** p < 0.001, ## p < 0.01. e The number of α-synuclein-positive axons in corpus callosum. Treatment F(1,20)=17.66, Genotype F(1,20)=58, Interaction F(1,20)=17.66, **** p < 0.001, #### p < 0.001. f Representative immunohistochemical analysis of phosphorylated (pSer129)- and Proteinase K (PK)-resistant α-synuclein in the neocortex and corpus callosum of non-tg and α-syn tg mice. Brain sections were immunostained against either phosphorylated- α-synuclein (pSer129) or α-synuclein following PK treatment. Scale bars, 250 μm (low magnification) and 25 μm (high magnification). g Optical density analysis of phosphorylated α-synuclein immunoreactivity in neocortex. Treatment F(1,20)=2.064, Genotype F(1,20)=476.2, Interaction F(1,20)=2.064, **** p < 0.001. h The number of phosphorylated α-synuclein-positive axons in corpus callosum. Treatment F(1,20)=8.75, Genotype F(1,20)=40.18, Interaction F(1,20)=8.75, **** p < 0.001, ### p < 0.005. i Optical density analysis of PK-resistant α-synuclein immunoreactivity in neocortex. Treatment F(1,20)=20.97, Genotype F(1,20)=269.3, Interaction F(1,20)=20.97, **** p < 0.001, #### p < 0.001. j The number of PK-resistant α-synuclein-positive axons in corpus callosum. Treatment F(1,20)=17.4, Genotype F(1,20)=55.61, Interaction F(1,20)=17.4, **** p < 0.001, #### p < 0.001. All analyses were done with N = 6 mice per group. All data were analyzed by using two-way ANOVA with Tukey’s post hoc test
Fig. 9
Fig. 9
Blockade of LRRK2 kinase regulates traffkicking of α–synuclein in mice. a Non-tg and α-syn tg mice were treated with either vehicle or LRRK2 inhibitor for 4 weeks. Brain sections were double-immunolabelled with antibodies against α-synuclein and RAB35. Scale bars, 25 μm. b Co-localization analysis of α-synuclein and RAB35 in neocortex of non-tg and α-syn-tg mice. Treatment F(1,20)=79.8, Genotype F(1,20)=156, Interaction F(1,20)=79.15, **** p < 0.001, #### p < 0.001. c Fluorescence intensity analysis for RAB35 in neocortex of non-tg and α-syn tg mice. Treatment F(1,20)=18.58, Genotype F(1,20)=208.1, Interaction F(1,20)=46.07, **** p < 0.001, #### p < 0.001. d Non-tg and α-syn tg mice were administrated with either vehicle or LRRK2 inhibitor for 4 weeks. Brain sections were double-immunolabelled with antibodies against α-synuclein and Cathepsin-D. Scale bars, 25 μm. e Co-localization analysis of α-synuclein and Cathepsin D in neocortex of non-tg and α-syn-tg mice. Treatment F(1,20)=21.55, Genotype F(1,20)=65.25, Interaction F(1,20)=22.01, #### p < 0.001. All data were analyzed by using two-way ANOVA with Tukey’s post hoc test. All analysis was done with N = 6 mice per group. Data are represented as mean ± SEM

References

    1. Dauer W, Przedborski S. Parkinson's disease: mechanisms and models. Neuron. 2003;39:889–909. doi: 10.1016/S0896-6273(03)00568-3. - DOI - PubMed
    1. Goedert M, Spillantini MG, Del Tredici K, Braak H. 100 years of Lewy pathology. Nat. Rev. Neurol. 2013;9:13–24. doi: 10.1038/nrneurol.2012.242. - DOI - PubMed
    1. Braak H, et al. Staging of brain pathology related to sporadic Parkinson's disease. Neurobiol. Aging. 2003;24:197–211. doi: 10.1016/S0197-4580(02)00065-9. - DOI - PubMed
    1. Brundin P, Melki R. Prying into the prion hypothesis for Parkinson's disease. J. Neurosci. : Off. J. Soc. Neurosci. 2017;37:9808–9818. doi: 10.1523/JNEUROSCI.1788-16.2017. - DOI - PMC - PubMed
    1. Surmeier DJ, Obeso JA, Halliday GM. Parkinson's disease is not simply a prion disorder. J. Neurosci. : Off. J. Soc. Neurosci. 2017;37:9799–9807. doi: 10.1523/JNEUROSCI.1787-16.2017. - DOI - PMC - PubMed

Publication types

MeSH terms

Substances