

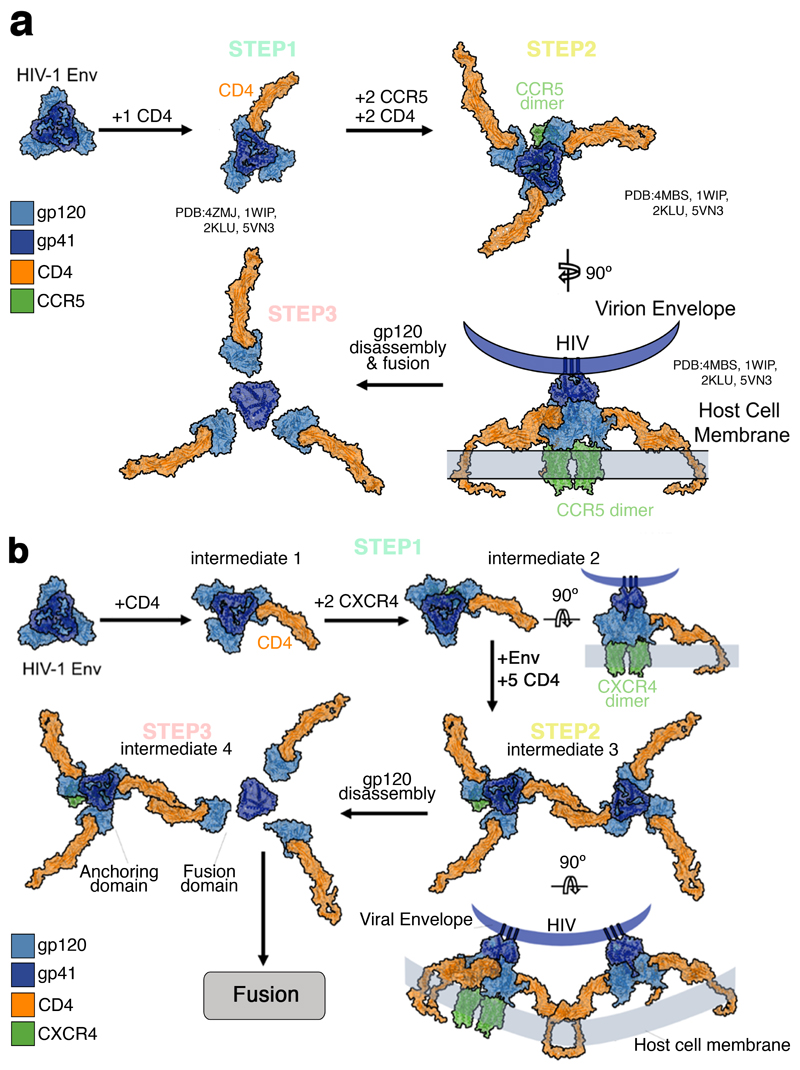
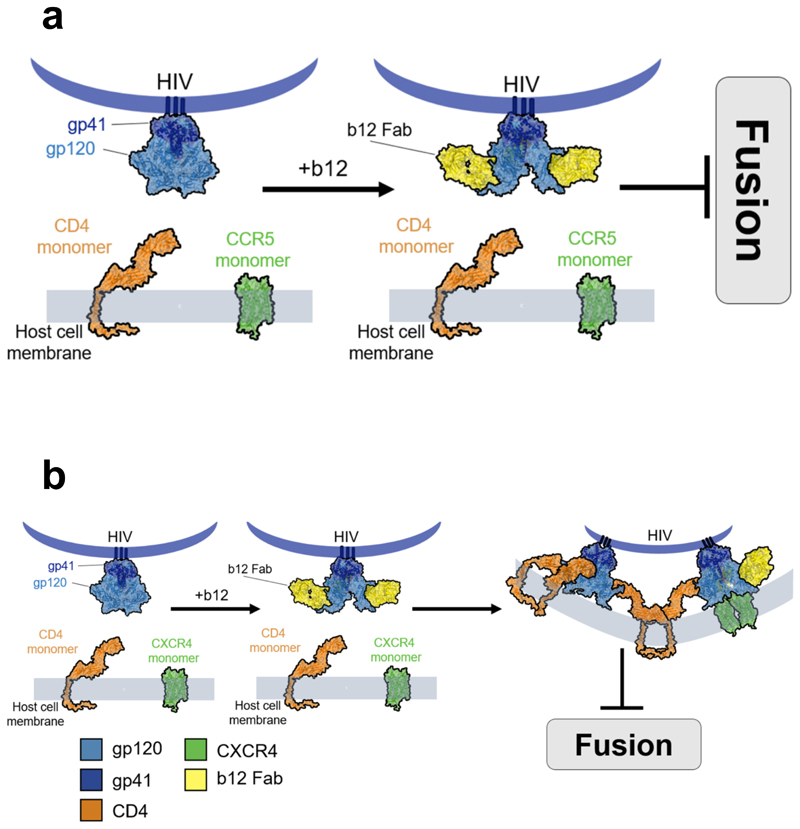
A dynamic three-step mechanism drives the HIV-1 pre-fusion reaction
- PMID: 30150645
- PMCID: PMC7056357
- DOI: 10.1038/s41594-018-0113-x
A dynamic three-step mechanism drives the HIV-1 pre-fusion reaction
Erratum in
-
Author Correction: A dynamic three-step mechanism drives the HIV-1 pre-fusion reaction.Nat Struct Mol Biol. 2019 Jun;26(6):526. doi: 10.1038/s41594-019-0244-8. Nat Struct Mol Biol. 2019. PMID: 31073171
Abstract
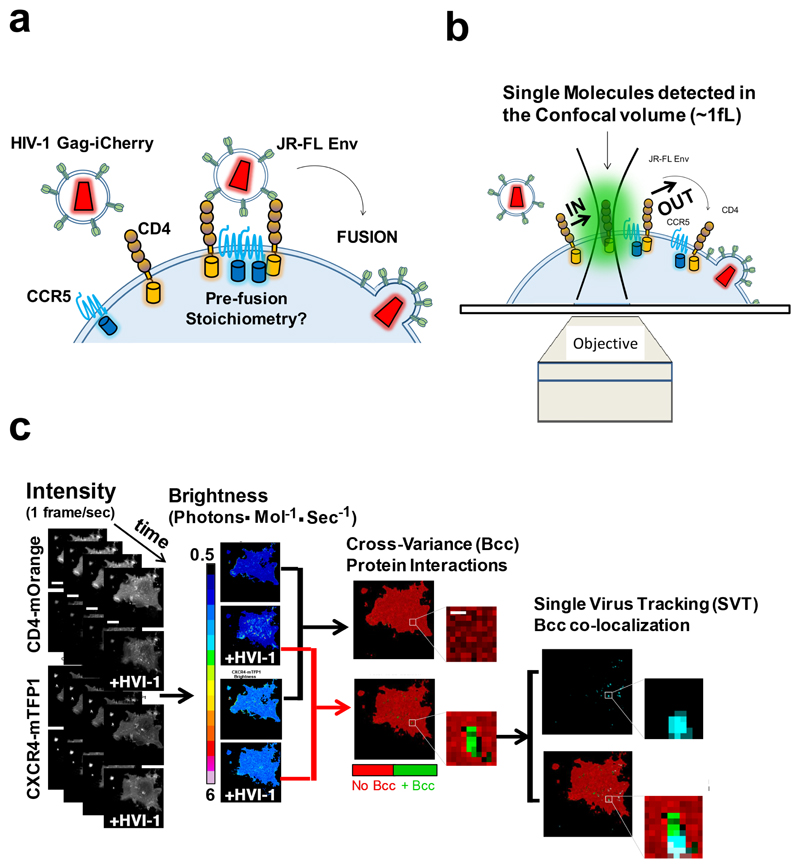
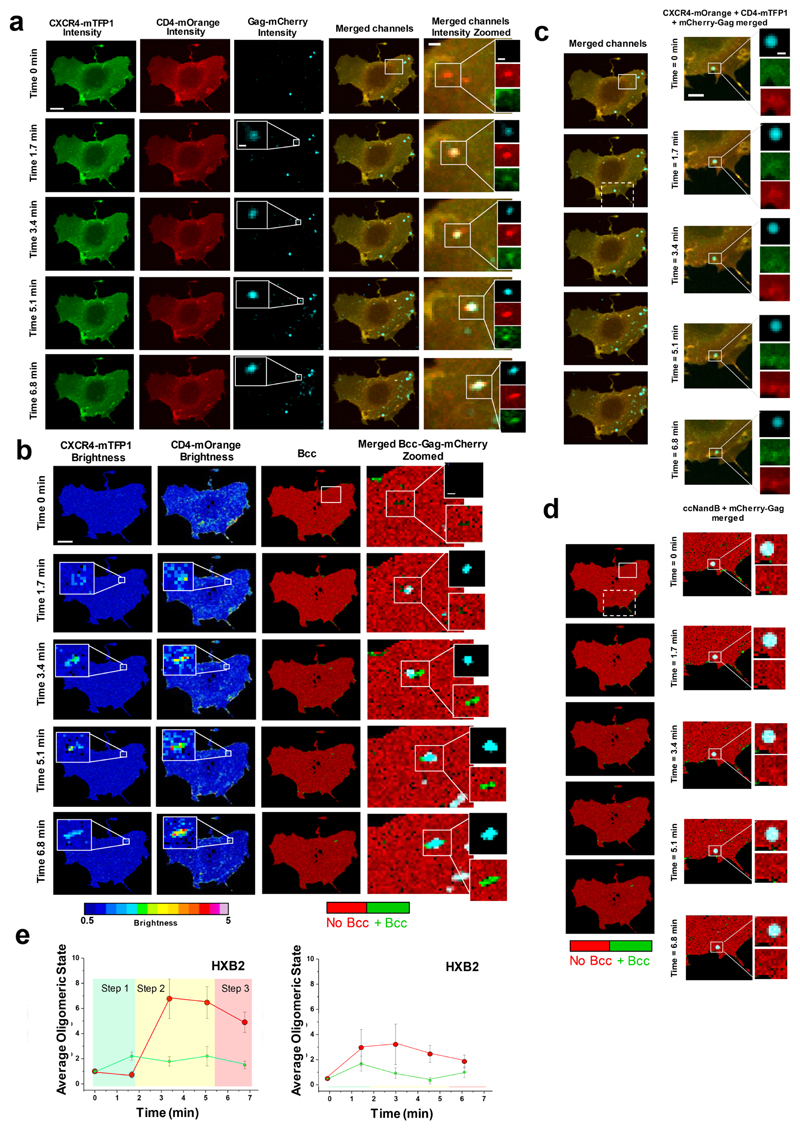
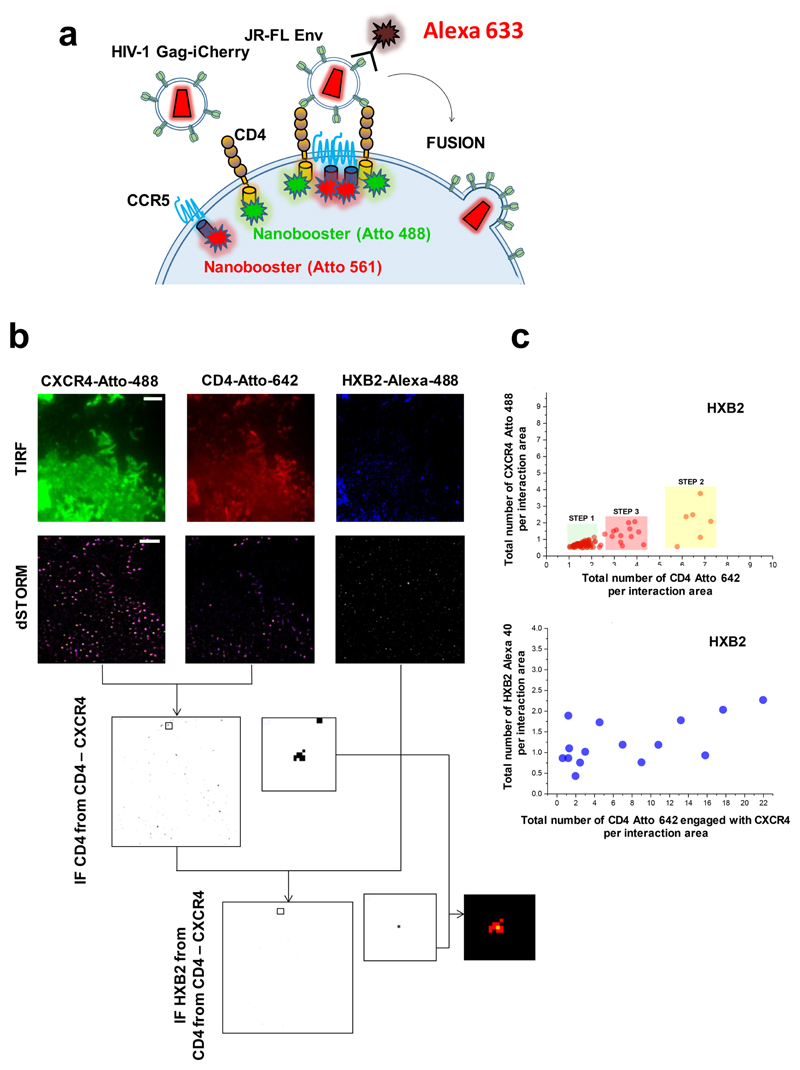
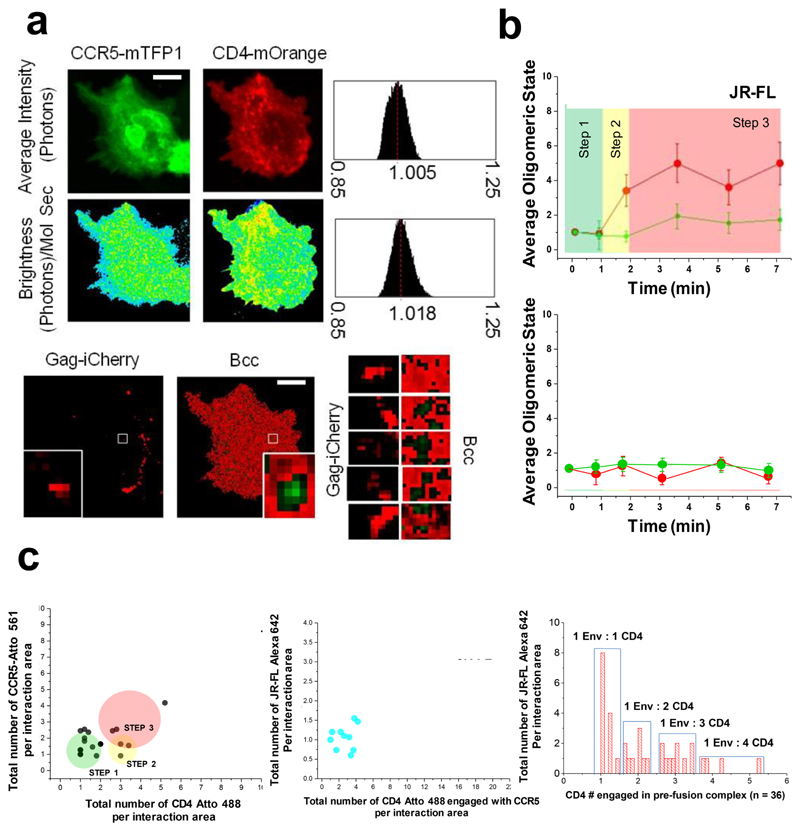
Little is known about the intermolecular dynamics and stoichiometry of the interactions of the human immunodeficiency virus type 1 (HIV-1) envelope (Env) protein with its receptors and co-receptors on the host cell surface. Here we analyze time-resolved HIV-1 Env interactions with T-cell surface glycoprotein CD4 (CD4) and C-C chemokine receptor type 5 (CCR5) or C-X-C chemokine receptor type 4 (CXCR4) on the surface of cells, by combining multicolor super-resolution localization microscopy (direct stochastic optical reconstruction microscopy) with fluorescence fluctuation spectroscopy imaging. Utilizing the primary isolate JR-FL and laboratory HXB2 strains, we reveal the time-resolved stoichiometry of CD4 and CCR5 or CXCR4 in the pre-fusion complex with HIV-1 Env. The HIV-1 Env pre-fusion dynamics for both R5- and X4-tropic strains consists of a three-step mechanism, which seems to differ in stoichiometry. Analyses with the monoclonal HIV-1-neutralizing antibody b12 indicate that the mechanism of inhibition differs between JR-FL and HXB2 Env. The molecular insights obtained here identify assemblies of HIV-1 Env with receptors and co-receptors as potential novel targets for inhibitor design.
Conflict of interest statement
Figures
References
Publication types
MeSH terms
Substances
Grants and funding
LinkOut - more resources
Full Text Sources
Other Literature Sources
Research Materials
