. 2018 Sep;50(9):1271-1281.
doi: 10.1038/s41588-018-0200-2. Epub 2018 Aug 27.

Genomic correlates of response to immune checkpoint blockade in microsatellite-stable solid tumors

Affiliations

Genomic correlates of response to immune checkpoint blockade in microsatellite-stable solid tumors

Diana Miao et al. Nat Genet. 2018 Sep.

Abstract

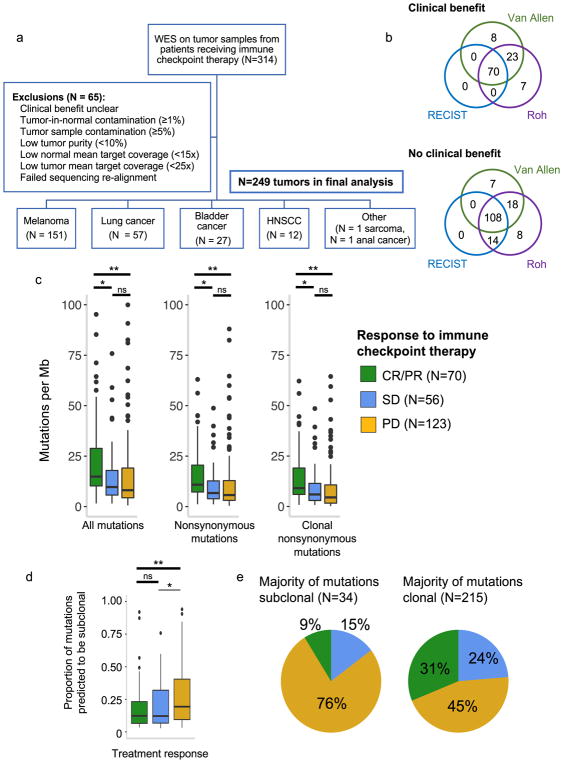
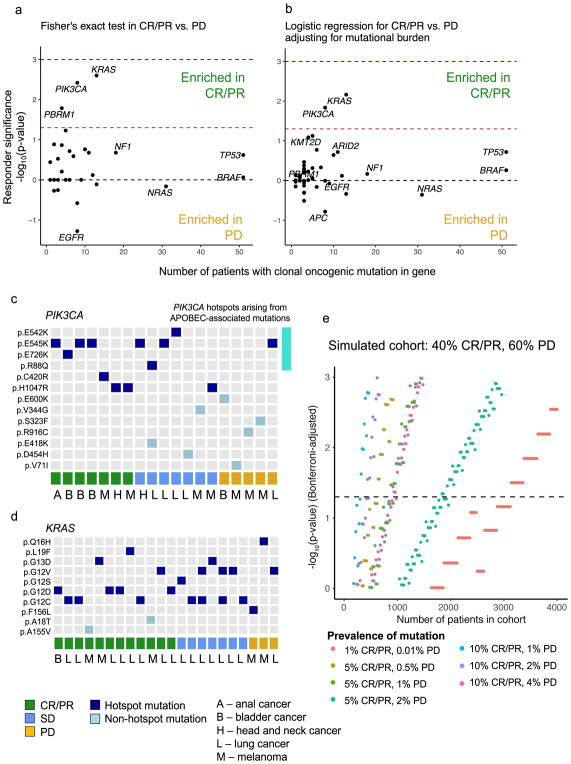
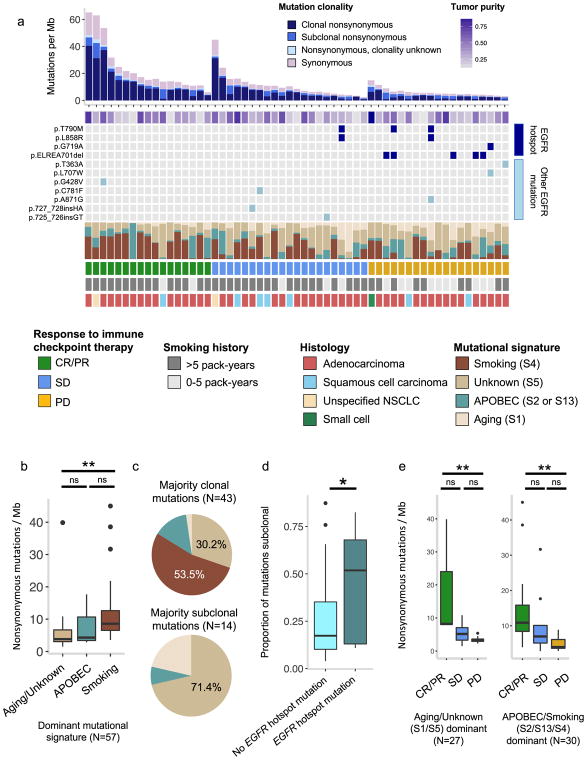
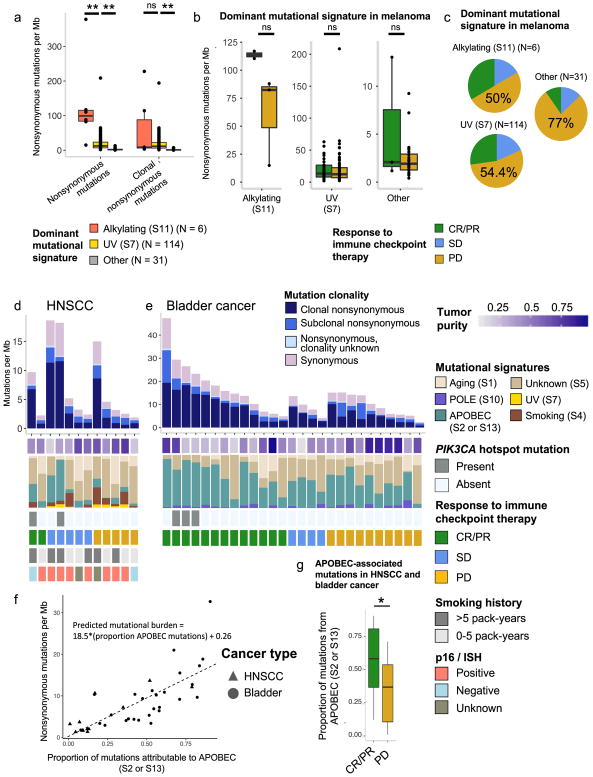
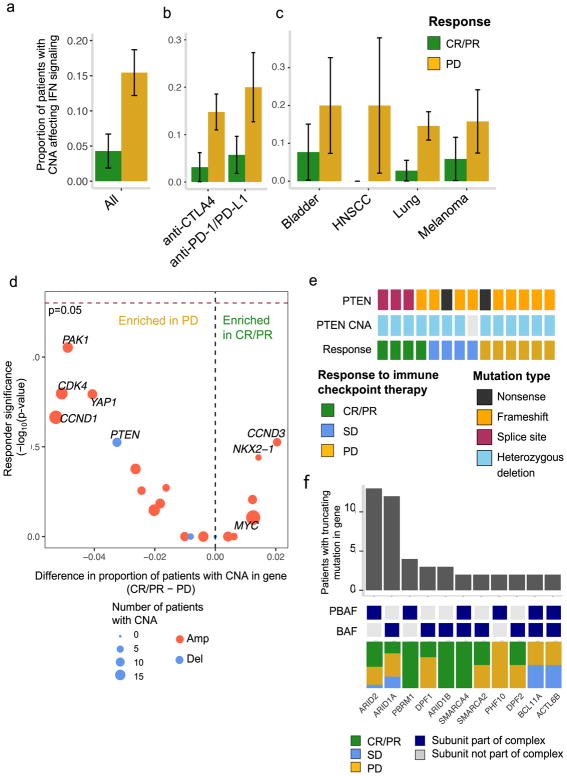
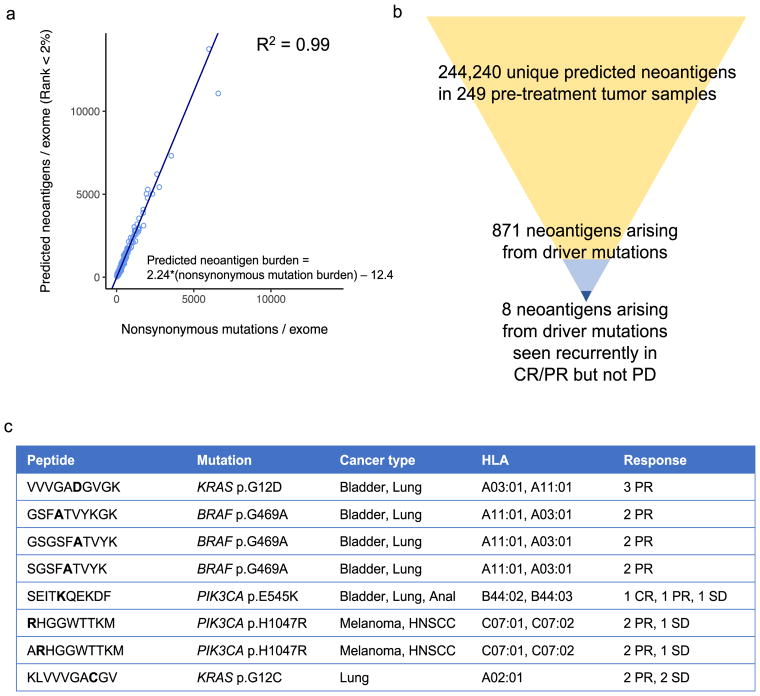
Tumor mutational burden correlates with response to immune checkpoint blockade in multiple solid tumors, although in microsatellite-stable tumors this association is of uncertain clinical utility. Here we uniformly analyzed whole-exome sequencing (WES) of 249 tumors and matched normal tissue from patients with clinically annotated outcomes to immune checkpoint therapy, including radiographic response, across multiple cancer types to examine additional tumor genomic features that contribute to selective response. Our analyses identified genomic correlates of response beyond mutational burden, including somatic events in individual driver genes, certain global mutational signatures, and specific HLA-restricted neoantigens. However, these features were often interrelated, highlighting the complexity of identifying genetic driver events that generate an immunoresponsive tumor environment. This study lays a path forward in analyzing large clinical cohorts in an integrated and multifaceted manner to enhance the ability to discover clinically meaningful predictive features of response to immune checkpoint blockade.


Conflict of interest statement

Competing Financial Interests Statement

A.T., D.L., D.M., M.M., N.I.V., C.A.M., D.A., D.K., S.M.W., L.M.S., A.T.W., P.P., K.K.W, S.J.R., J.B., P.A.J., N.G.C., R.H., and M.M.A. declare no conflicts of interest. T.K.C. has advisory roles with AstraZeneca, Bayer, Bristol-Myers Squibb, Cerulean, Elsa, Foundation Medicine, Genentech, GlaxoSmithKline, Merck, Novartis, Peloton, Pfizer, Prometheus Labs, Roche, and Elsai. T.K.C. receives research funding from AstraZeneca, Bristol-Myers Squibb, Exelixis, Genentech, GSK, Merck, Novartis, Peloton, Pfizer, Roche, Tracon, and Eisai. G.J.H. receives institutional support from Bristol-Myers Squibb and EMD Serono. B.S. is on the advisory board or has received honoraria from Novartis, Roche, Bristol-Myers Squibb and MSD Sharp & Dohme, research funding from Bristol-Myers Squibb and MSD Sharp & Dohme, and travel support from Novartis, Roche, Bristol-Myers Squibb and AMGEN. R.I.H. has advisory roles with Bristol-Myers Squibb, Pfizer, Merck, AstraZeneca, Genentech and Celgene. R.I.H. receives research funding from Bristol-Myers Squibb, Merck, Genentech, and Pfizer. S.S. is a consultant for AstraZeneca and Merck, and receives research funding from AstraZeneca, Bristol-Myers Squibb, Exelixis, and Roche. G.G. has an advisory role with MD Anderson, and receives research funding from IBM and Bayer AG. G.G. is listed as an inventor on patent applications regarding MuTect, ABSOLUTE and Polysolver. D.A.B. is a consultant for N of One. D.S. receives consulting fees from Amgen, GSK, BMS, Novartis, Roche, Amgen, Merck, AstraZeneca, Merck-Serono, and Pfizer. P.H. and J.E. are employees of Novartis. F.S.H is a consultant to Bristol-Myers Squibb, Merck, Novartis, EMD Serono, Sanofi, and Genentech, and receives institutional research support from Bristol-Myers Squibb. E.M.V. holds consulting roles with Tango Therapeutics, Invitae and Genome Medical and receives research support from Bristol-Myers Squibb and Novartis.

Figures

Fig. 1
Fig. 1. Clinical cohort consolidation, response stratification, and mutational load investigation
(a) Data quality control for 249 samples included in final analysis. (b) Comparison of three published response metrics for determining OR vs. NR. (c) Comparison of tumor mutational burden between CR/PR vs. PD (For ‘All mutations’, p=0.0005 for CR/PR vs PD, p=0.0054 for CR/PR vs SD, and p=0.434 for SD vs PD; for ‘Nonsynonymous mutations’, p=0.0003 for CR/PR vs PD, p=0.0063 for CR/PR vs SD, and p=0.3769 for SD vs PD; for ‘Clonal nonsynonymous mutations’, p=0.00005 for CR/PR vs PD, p=0.011 for CR/PR vs SD, and p=0.151 for SD vs PD). Outlying points from patients with mutations/Mb > 101 are not shown (2 CR/PR, 1 SD, 3 PD). (d) Intratumoral heterogeneity across response groups (n=249 biologically independent samples, p=0.001 for CR/PR vs. PD, p=0.5122 for CR/PR vs SD). (e) Clinical response to immune checkpoint therapy broken down by intratumoral heterogeneity. For (c, d), p-values calculated by two-sided Mann-Whitney U *p<0.05, **p<0.005, ns = not significant. Boxplots show the median, first and third quartiles, whiskers extend to 1.5 × the interquartile range, and outlying points are plotted individually.
Fig. 2
Fig. 2. Mutations in specific genes associated with response to immune checkpoint therapy
(a) Response-associated mutations in CR/PR vs. PD (Two-failed Fisher’s exact test, n = 70 biologically independent samples with CR/PR, n = 123 with PD). Dashed red line indicates Fisher’s exact p=0.05, and dashed dark red line indicates false discovery rate (FDR) q=0.05. (b) Response-associated mutations corrected for mutational burden. Sample size and dashed lines for p- and q-value cutoffs same as in (a). (c–d) Tile plot showing known hotspot and non-hotspot mutations in (c) PIK3CA and (d) KRAS by response group (bottom), with cancer type indicated by capital letters. Top four rows of (c) represent mutations arising in APOBEC-associated mutational contexts (See Supplementary Fig. 6). (e) Simulated statistical power calculation for detection of response-associated genes. Significance of association between response and presence of mutation in gene (Two-tailed Fisher’s exact test) is shown on the y-axis, for varying samples sizes (x-axis). Colors represent frequency of mutations and specificity of alteration to OR vs. NR. Dashed horizontal line represents Bonferroni-correct p=0.05 after correcting for multiple comparisons over the 116 cancer driver genes assessed in this study. Simulated cohort contains 40% CR/PR and 60% PD patients.
Fig. 3
Fig. 3. Integrated analysis of EGFR mutational status, intratumoral heterogeneity, and mutational signatures in lung cancer
(a) Stacked plot showing mutational burden (histogram, top), estimated tumor purity (tile plot, top), mutations in EGFR (tile plot, middle), mutational signatures (filled histogram, middle), and clinical response and clinical covariates (bottom). (b) Interaction between smoking-related mutational signatures and mutational burden. For aging/unknown vs smoking signatures p=0.0001; for aging/unknown vs APOBEC, p=0.427; for APOBEC vs smoking, p=0.158. (c) Proportion of patients with a given dominant mutational signature by clonal mutation composition. (d) Proportion of subclonal mutations in EGFR-mutant vs. EGFR-wildtype tumors (n = 57 biologically independent samples, p=0.035, unpaired two sample t-test). (e) Relationship between mutational burden and response by dominant mutational signature (for Aging/unknown dominant samples, CR/PR vs PD p=0.0044, CR/PR vs SD p=0.07, SD vs PD p=0.0597; for APOBEC/smoking dominant samples, CR/PR vs PD p=0.0023, CR/PR vs SD p=0.08, SD vs PD p=0.252). Two-sided Mann-Whitney U for (b, e), *p<0.05, **p<0.005, ns = not significant. Boxplots (b, d, e) show the median, first and third quartiles, whiskers extend to 1.5 × the interquartile range, and outlying points are plotted individually.
Fig. 4
Fig. 4. Integrated analysis of mutational burden, intratumoral heterogeneity, and mutational signatures in melanoma, HNSCC, and bladder cancer
(a) Nonsynonymous mutational burden (alkylating- vs. UV-dominant, p=0.0005; UV- vs. other-dominant, p=6.079e-14) and clonal mutational burden (alkylating- vs UV-dominant, p=0.938, UV- vs. other-dominant, p=6.404e-15) stratified by dominant mutational signature in melanoma patients only. b) Association between mutational burden and response within dominant mutational signature in melanoma (CR/PR vs PD in alkylating-dominant, p=0.2; CR/PR vs PD in UV-dominant, p=0.549; CR/PR vs PD in ‘Other’ dominant, p=0.689). (c) Likelihood of response by dominant mutational signature group in melanoma. (d–e) Stacked plots of mutational burden (histogram, top), tumor purity (tile plot, top), mutational signatures (filled histogram, middle), and histology and clinical response to immune checkpoint therapy (tile plots, bottom) for HNSCC (d) and bladder cancer (e). (f) Proportion of mutations attributable to APOBEC mutational signatures (S2/13) vs. nonsynonymous mutational burden (n = 39 biologically independent samples, p=2.66e-08 for slope; p=0.848 for intercept). Symbols indicate cancer type. (g) Proportion of mutations probabilistically attributable to the APOBEC mutational signature in CR/PR vs. PD in HNSCC and bladder cancer (p=0.019, n = 39). Two-sided Mann-Whitney U for all, *p<0.05, **p<0.005, ns = not significant. Boxplots (a, b, g) show the median, first and third quartiles, whiskers extend to 1.5 × the interquartile range, and outlying points are plotted individually.
Fig. 5
Fig. 5. Tumor copy number alterations associated with response to immune checkpoint therapy
(a) Amplifications and deletions of genes in the interferon-γ signaling pathway in CR/PR vs. PD across all samples (Two-tailed Fisher’s exact p=0.019, 95% CI 0.05 to 0.885, n=193), by (b) drug class (n=120 anti-CTLA4-treated, n = 65 anti-PD1/PD-L1-treated) and (c) cancer type (n = 23 bladder, 7 HSNCC, and 125 melanoma). Error bars denote proportion of CR/PR or PD with CNA +/− standard error. *p<0.05. (d) Difference in proportion of CR/PR vs. PD harboring focal cancer driver CNAs. Negative log10(p-value) for a two-tailed Fisher’s exact test for enrichment of a gene-level CNA in CR/PR vs. PD is shown on the y-axis. Genes more commonly affected by CNAs in CR/PR are shown on the right, while those more commonly deleted or amplified in PD are shown on the left. Dashed red line indicates p=0.05. (n=193 biologically independent samples) (e) Truncating mutations in PTEN by response group. (f) Prevalence and response association of truncating alterations in genes encoding SWI/SNF subunits. Dark blue tiles indicate membership in either PBAF or BAF, which are complexes within the SWI/SNF family. Only genes encoding SWI/SNF subunits harboring truncating mutations in at least two patients are shown.
Fig. 6
Fig. 6. Response-associated in silico predicted neoantigens
(a) Relationship between predicted neoantigen burden (y-axis) and nonsynonymous mutational burden (x-axis). Linear regression excludes one outlier (Pat110) (n = 249 biologically independent samples). (b) Prioritization of clinically actionable predicted neoantigens by presence in cancer driver genes and exclusive presence in CR/PR. (c) Response-associated predicted neoantigens generated by cancer driver mutations.

References

    1. Topalian SL, Taube JM, Anders RA, Pardoll DM. Mechanism-driven biomarkers to guide immune checkpoint blockade in cancer therapy. Nat Rev Cancer. 2016;16:275–287. doi: 10.1038/nrc.2016.36. - DOI - PMC - PubMed
    1. Brahmer J, et al. Nivolumab versus docetaxel in advanced squamous-cell non–small-cell lung cancer. New England Journal of Medicine. 2015;373:123–135. doi: 10.1056/NEJMoa1504627. - DOI - PMC - PubMed
    1. Tumeh PC, et al. PD-1 blockade induces responses by inhibiting adaptive immune resistance. Nature. 2014;515:568–571. doi: 10.1038/nature13954. - DOI - PMC - PubMed
    1. Sharma P. Immune checkpoint therapy and the search for predictive biomarkers. Cancer J. 2016;22:68–72. doi: 10.1097/PPO.0000000000000185. - DOI - PMC - PubMed
    1. Carbognin L, et al. Differential activity of nivolumab, pembrolizumab and MPDL3280A according to the tumor expression of programmed death-ligand-1 (PD-L1): Sensitivity analysis of trials in melanoma, lung and genitourinary Cancers. PLOS ONE. 2015;10:e0130142. doi: 10.1371/journal.pone.0130142. - DOI - PMC - PubMed

Publication types