. 2018 Sep;21(9):1209-1217.
doi: 10.1038/s41593-018-0213-2. Epub 2018 Aug 27.

Direct vascular channels connect skull bone marrow and the brain surface enabling myeloid cell migration

Affiliations

Direct vascular channels connect skull bone marrow and the brain surface enabling myeloid cell migration

Fanny Herisson et al. Nat Neurosci. 2018 Sep.

Abstract

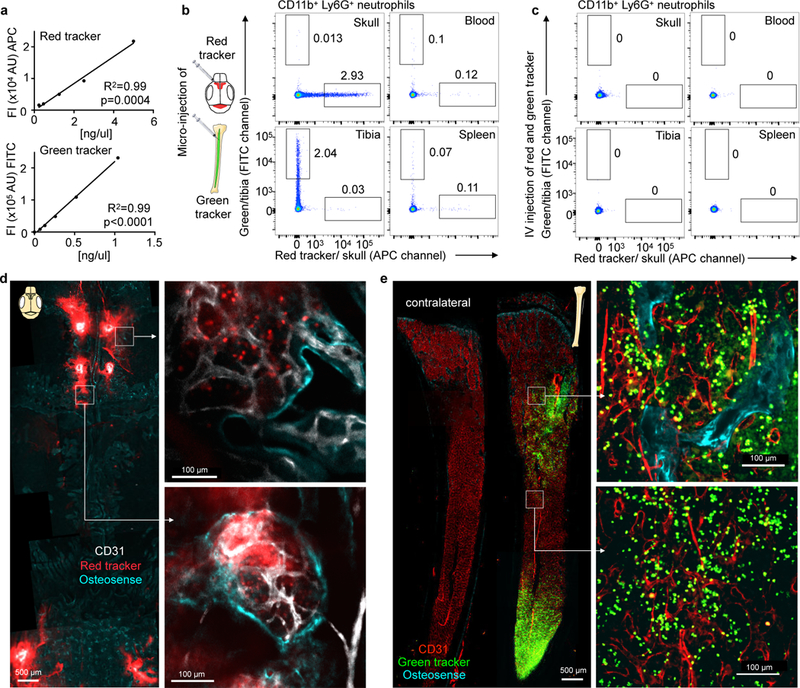
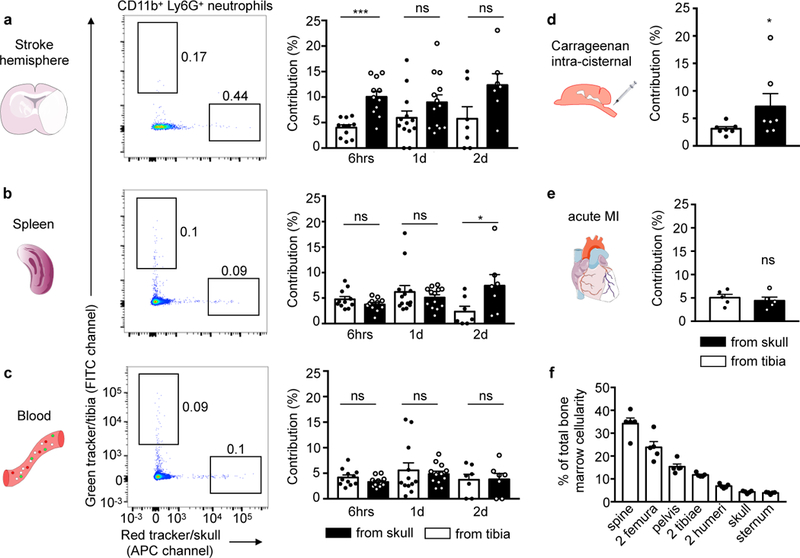
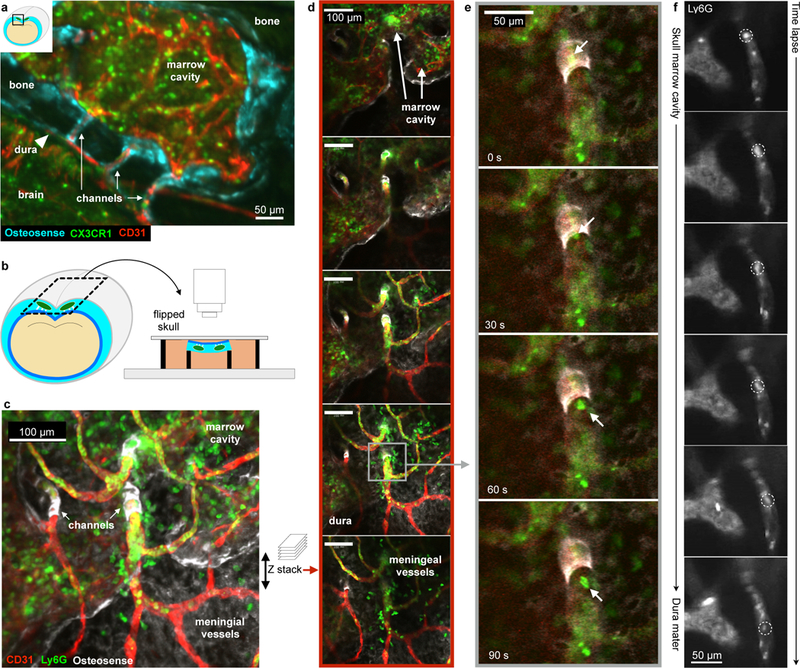
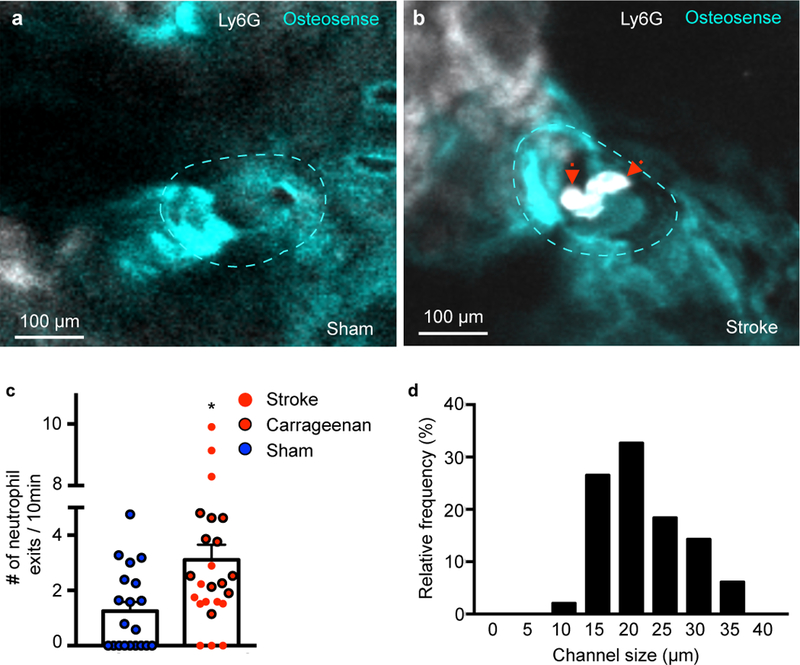
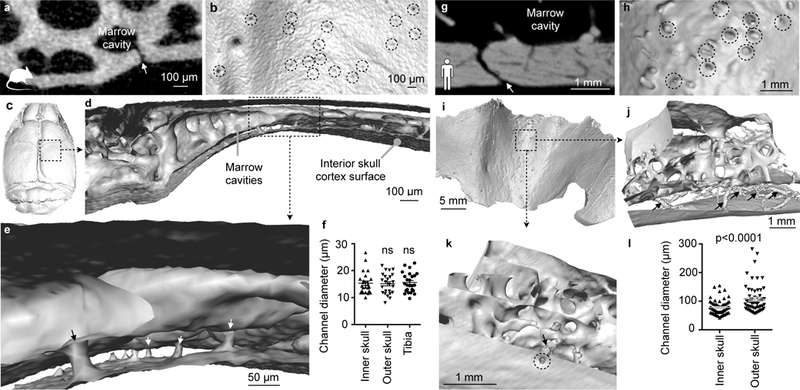
Innate immune cells recruited to inflammatory sites have short life spans and originate from the marrow, which is distributed throughout the long and flat bones. While bone marrow production and release of leukocyte increases after stroke, it is currently unknown whether its activity rises homogeneously throughout the entire hematopoietic system. To address this question, we employed spectrally resolved in vivo cell labeling in the murine skull and tibia. We show that in murine models of stroke and aseptic meningitis, skull bone marrow-derived neutrophils are more likely to migrate to the adjacent brain tissue than cells that reside in the tibia. Confocal microscopy of the skull-dura interface revealed myeloid cell migration through microscopic vascular channels crossing the inner skull cortex. These observations point to a direct local interaction between the brain and the skull bone marrow through the meninges.


Conflict of interest statement

Competing financial interests

The authors declare that they have no competing financial interests.

Figures

Figure 1.
Figure 1.. Bone marrow cell tagging.
a, Concentration dependent fluorescence intensity of in vitro labeled bone marrow cells by flow cytometry for the red (APC, n=5 mice) and green (FITC, n=6 mice) cell tracker in 2 different experiments. b,c, Representative flow cytometry from naive mice 24 hrs after (b) marrow microinjection of red and green cell tracker or (c) intravenous injection (independently repeated twice with same results). d,e, Confocal imaging of (d) calvarium and (e) tibia after microinjection of red and green cell tracker into 2 different mice (single experiment). Bone outline is visualized with osteosense (turquoise) and endothelium with CD31 in vivo immunolabeling.
Figure 2.
Figure 2.. Neutrophil tracking in stroke, carrageenan-induced meningoencephalitis and myocardial infarction.
a-c, Representative examples of neutrophil tracking after tagging in skull (red) and one tibia (green tracker) in the same animal, 6 hrs (n=11, 5 experiments), 1 day (n=13 for brain and spleen, n=12 for blood, 5 experiments) and 2 days after stroke induced by permanent occlusion (n=7, 2 experiments). Contribution was normalized to cell frequency at injection site. Two-tailed paired Wilcoxon test; brain, 6hrs, ***P=0.002, 1d, P=0.127, and 2d, P=0.219; spleen, 6hrs, P= 0.206, 1d, P=0.787 and 2d *P=0.016; blood, 6hrs, P=0.153, 1d, P=0.97 and 2d, P=0.812. d, Neutrophil exit from the skull and the tibia in aseptic meningoencephalitis (n=7, 4 experiments, two-tailed paired Wilcoxon test, *P=0.031) and (e) after myocardial infarction (n= 5, 1 experiment, two-tailed Wilcoxon test, P=0.813). f, Size of bone marrow compartments, n=5 mice. Data are mean ± s.e.m. See also Supplementary Fig. 2 for gating and Supplementary Fig. 3 for related analyses.
Figure 3.
Figure 3.. Skull release more of cells after stroke.
a, Representative flow cytometry plots of skull and tibia bone marrow 6 hours after stroke induced by 30 min tMCAO or sham controls (6 experiments). Additional gating is shown in Supplementary Fig. 2. b, Neutrophil and monocyte numbers in skull after stroke or sham controls. Data are mean ± s.e.m.. Neutrophils, n=16 stroke, n=17 sham, 6 experiments; Ly6Chi monocytes, n=13 stroke, n=12 sham, 4 experiments; two-tailed Mann-Whitney test, neutrophils, **P=0.008; monocytes, **P=0.007. c, Neutrophil and monocyte numbers in both tibiae. Data are mean ± s.e.m.. Neutrophils, n=16 stroke, n=17 sham, 6 experiments; Ly6Chi monocytes, n=13 stroke, n=12 sham, 4 experiments; two-tailed Mann-Whitney test, neutrophils, P=0.49; monocytes, P=0.54. d,e, Data normalized to sham at 6hrs (neutrophils, n=16 and monocytes, n=12 per condition; 4 experiments) and 3 days after stroke (n=7 per condition, 3 experiments) and displayed as mean (center) ± s.e.m. (error bars). Two-tailed paired Wilcoxon test, neutrophils, 6hrs, **P=0.002 skull versus tibia; 3 days, *P=0.031 skull versus tibia; monocytes, 6hrs *P=0.016 skull versus tibia; 3 days,*P=0.016 skull versus tibia. See Supplementary Fig. 5 for spine.
Figure 4.
Figure 4.. Retention factor SDF-1 and bone marrow permeability.
a, SDF-1 protein ELISA in skull and tibia bone marrow 6hrs after stroke induced by 30 min occlusion. Data are from 2 separate experiments and normalized to the mean sham value. Stroke, n=12 skull, n=12 tibia; sham n=12 skull, n=11 tibia sham. Two-tailed Welch’s t test, skull, *P=0.025; tibia, P=0.567. b, Evans blue permeability after stroke induced by 30min occlusion, n=6 sham, n=8 stroke, 5 experiments. Two-tailed Mann Whitney, skull, P=0.59, tibia, P=0.28. c, Histology of Evans blue in skull and tibia bone marrow after stroke and in sham animals. d, Evans blue permeability after carrageenan injection, control, n=15; carageenan, n=6, 6 experiments; two-tailed Welch’s t test, skull, P=0.112; tibia, *P=0.027. Data are mean ± s.e.m., ns indicates not significant.
Figure 5.
Figure 5.. Ex vivo confocal microscopy of channels connecting the skull marrow to the dura.
a, Coronal view of the skull and brain in a Cx3cr1GFP mouse showing channels in relation to the brain, bone and dura (single experiment). b, Ex-vivo skull marrow bath using fMLP containing medium. c, Collapsed z stack and (d) single slices after intracisternal carrageenan injection. e, Time series of neutrophil channel exit (replicated 4 times). See also Supplementary movie 1. f, In vivo time lapse of neutrophil migrating through a channel, representative example of imaging in 2 mice after stroke (permanent MCAO). See also Supplementary movie 2,3.
Figure 6.
Figure 6.. Cells exit channels in organ bath.
a,b, Representative examples of channels (dotted line) in (a) sham control and (b) stroke (permanent MCAO). See also Supplementary movie 4,5. c, Number of neutrophil exits. Data are mean ± s.e.m. Two-tailed Mann-Whitney test, *P= 0.011, sham, n=20 channels, acute inflammation n=24 (including 13 stroke) channels per group, 4 independent experiments. Sham, n=4 mice, stroke, n=3 mice, carageenan, n=4 mice. d, Distribution of channel diameter by histology. Sham, n=4 mice, stroke, n=3 mice, carageenan, n=4 mice.
Figure 7.
Figure 7.. Electron microscopy of channel.
a, Entire channel connecting a skull bone marrow cavity (bm) filled with blood cells with a blood vessel (bv) in the dura mater (dm) while traversing the inner bone cortex (asterisks), single experiment. b, Channel is clad with endothelial cells (ec), above fibroblasts (fb). c, Connective tissue in the dura mater (dm) in the vicinity of the channel, fibroblast (fb), plasma cell (p). d, Dura mater with collagen (col) and fibrocyte (fc).
Figure 8.
Figure 8.. Channels in the mouse (a-f) and human skull (g-l) imaged by microCT.
a,g, Coronal view of channel (arrow) in a mouse (a) and human (g). b,h, Interior skull surface reconstruction, channel openings indicated by dashed circles. c,i, Interior skull surface reconstruction. d,e,j,k, Coronal surface rendering of channels (arrows). f, Channel diameter according to location in mouse and (l) in human. Each point is one channel. Data were obtained in 1 mouse (inner and outer skull, n= 24; tibia, n=25), one-way Anova P= 0.96 and 3 humans (inner and outer skull, n=60), two-tailed t-test with Welch’s correction, p<0.0001 . Data are mean ± s.e.m. See Supplementary movie 6.

Comment in

References

    1. Swirski FK & Nahrendorf M Leukocyte behavior in atherosclerosis, myocardial infarction, and heart failure. Science 339, 161–166 (2013). - PMC - PubMed
    1. Jickling GC et al. Targeting neutrophils in ischemic stroke: translational insights from experimental studies. J Cereb Blood Flow Metab 35, 888–901 (2015). - PMC - PubMed
    1. Kamel H & Iadecola C Brain-immune interactions and ischemic stroke: clinical implications. Arch Neurol 69, 576–581 (2012). - PMC - PubMed
    1. Offner H et al. Experimental stroke induces massive, rapid activation of the peripheral immune system. J Cereb Blood Flow Metab 26, 654–665 (2006). - PubMed
    1. Courties G, Moskowitz MA & Nahrendorf M The innate immune system after ischemic injury: lessons to be learned from the heart and brain. JAMA Neurol 71, 233–236 (2014). - PMC - PubMed

Publication types

MeSH terms

LinkOut - more resources