. 2018 Sep;21(9):1161-1170.
doi: 10.1038/s41593-018-0206-1. Epub 2018 Aug 27.

GWAS of lifetime cannabis use reveals new risk loci, genetic overlap with psychiatric traits, and a causal influence of schizophrenia

Affiliations

GWAS of lifetime cannabis use reveals new risk loci, genetic overlap with psychiatric traits, and a causal influence of schizophrenia

Joëlle A Pasman et al. Nat Neurosci. 2018 Sep.

Erratum in

  • Author Correction: GWAS of lifetime cannabis use reveals new risk loci, genetic overlap with psychiatric traits, and a causal effect of schizophrenia liability.
    Pasman JA, Verweij KJH, Gerring Z, Stringer S, Sanchez-Roige S, Treur JL, Abdellaoui A, Nivard MG, Baselmans BML, Ong JS, Ip HF, van der Zee MD, Bartels M, Day FR, Fontanillas P, Elson SL; 23andMe Research Team; de Wit H, Davis LK, MacKillop J; Substance Use Disorders Working Group of the Psychiatric Genomics Consortium; International Cannabis Consortium; Derringer JL, Branje SJT, Hartman CA, Heath AC, van Lier PAC, Madden PAF, Mägi R, Meeus W, Montgomery GW, Oldehinkel AJ, Pausova Z, Ramos-Quiroga JA, Paus T, Ribases M, Kaprio J, Boks MPM, Bell JT, Spector TD, Gelernter J, Boomsma DI, Martin NG, MacGregor S, Perry JRB, Palmer AA, Posthuma D, Munafò MR, Gillespie NA, Derks EM, Vink JM. Pasman JA, et al. Nat Neurosci. 2019 Jul;22(7):1196. doi: 10.1038/s41593-019-0402-7. Nat Neurosci. 2019. PMID: 31168101

Abstract

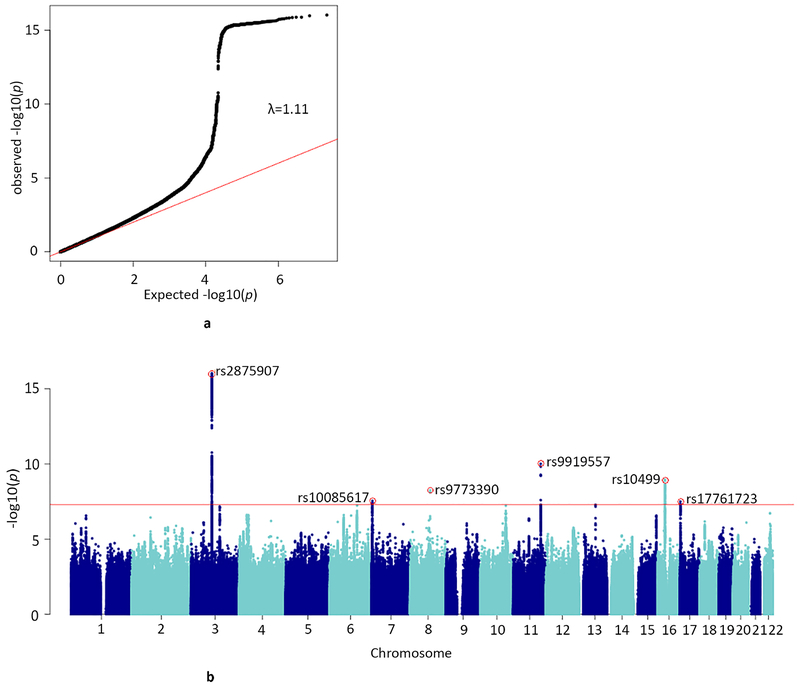
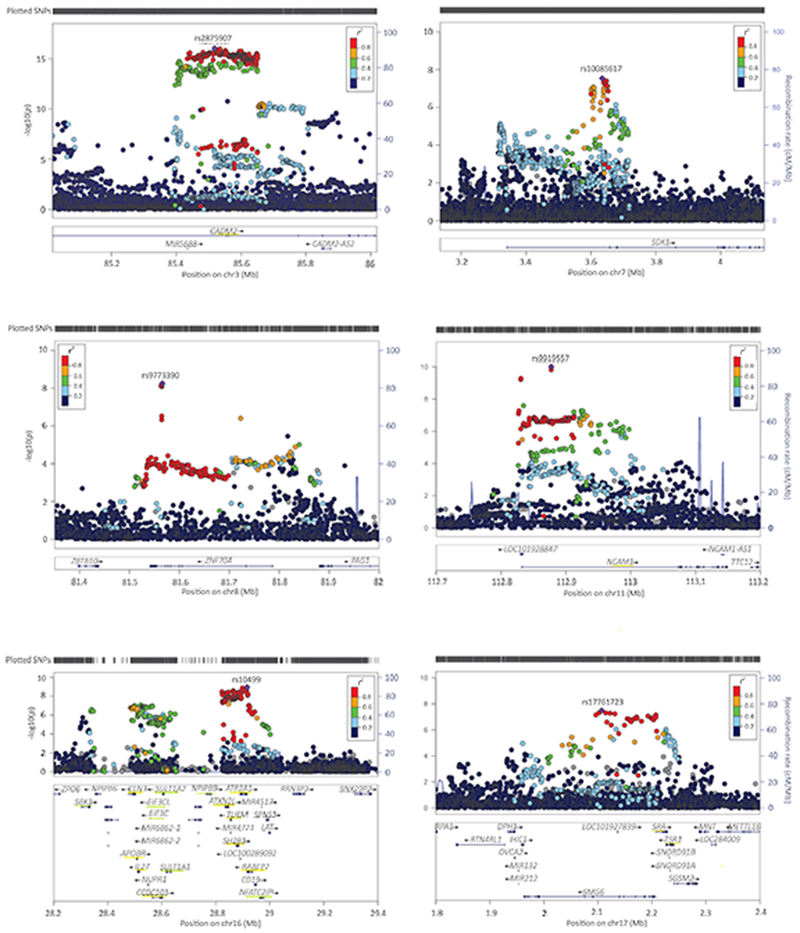
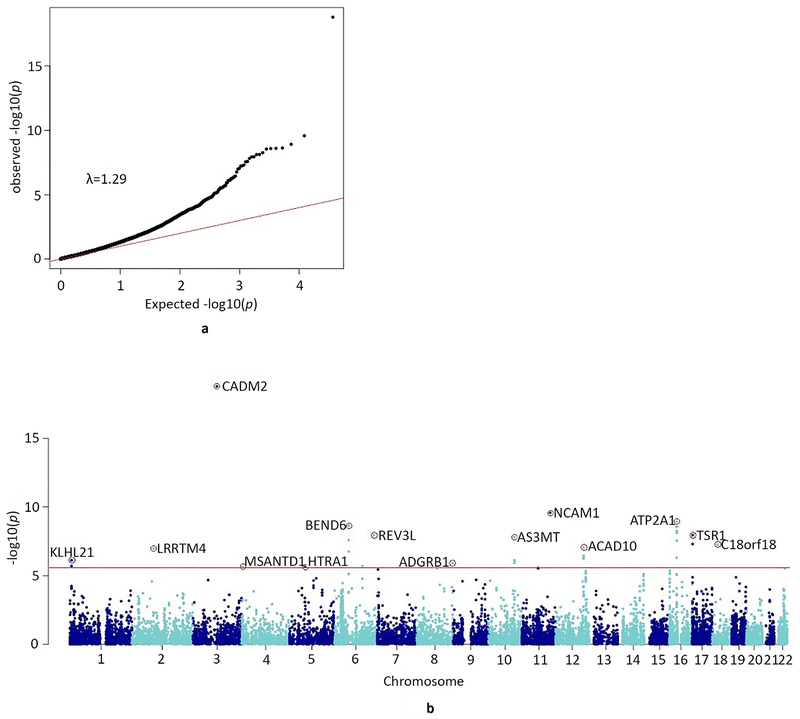
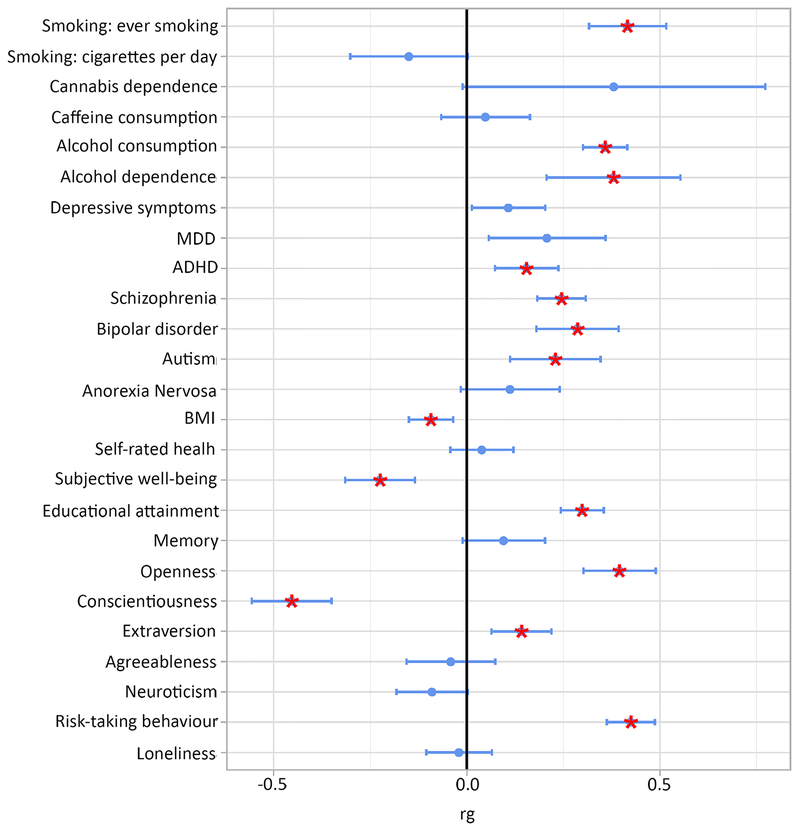
Cannabis use is a heritable trait that has been associated with adverse mental health outcomes. In the largest genome-wide association study (GWAS) for lifetime cannabis use to date (N = 184,765), we identified eight genome-wide significant independent single nucleotide polymorphisms in six regions. All measured genetic variants combined explained 11% of the variance. Gene-based tests revealed 35 significant genes in 16 regions, and S-PrediXcan analyses showed that 21 genes had different expression levels for cannabis users versus nonusers. The strongest finding across the different analyses was CADM2, which has been associated with substance use and risk-taking. Significant genetic correlations were found with 14 of 25 tested substance use and mental health-related traits, including smoking, alcohol use, schizophrenia and risk-taking. Mendelian randomization analysis showed evidence for a causal positive influence of schizophrenia risk on cannabis use. Overall, our study provides new insights into the etiology of cannabis use and its relation with mental health.


Conflict of interest statement

Competing interests

PF, SLE, and members of the 23andMe Research Team are employees of 23andMe Inc.

JARQ was on the speakers’ bureau and/or acted as consultant for Eli-Lilly, Janssen-Cilag, Novartis, Shire, Lundbeck, Almirall, BRAINGAZE, Sincrolab, and Rubió in the last 5 years. He also received travel awards (air tickets + hotel) for taking part in psychiatric meetings from Janssen-Cilag, Rubió, Shire, and Eli- Lilly. The Department of Psychiatry chaired by him received unrestricted educational and research support from the following pharmaceutical companies in the last 5 years: Eli-Lilly, Lundbeck, Janssen- Cilag, Actelion, Shire, Ferrer, and Rubió.

Figures

Figure 1.
Figure 1.
a) QQ-plot of the distribution of the −log 10(p-values) observed for the SNP associations with lifetime cannabis use against those expected under the null hypothesis Expected −log 10(p-values) under the null hypothesis are indicated by the red line. Genomic inflation is indicated with λ in the plot. There was no evidence for population stratification (LD score regression b0=1.00, SE=0.007). b) Manhattan plot for the SNP-based GWAS meta-analysis Results are based on N=184,764 individuals and NSNPs=11,733,371 SNPs. The SNP with the lowest p-value per independent (R2<0.1, window size 250 kb) genome-wide significant locus is annotated (red circle with rs-number). The red line represents the conventional genome-wide significance threshold of p<5e-08. The statistical test comprised linear regression; significance was tested two-sided.
Figure 2.
Figure 2.. Regional plots of the genome-wide significant SNPs
Underlined in yellow are the genes that were significant in the gene-based test (tested two-sided; p<2.74e-06, Bonferroni corrected p-value threshold of p<0.05 adjusted for 18,293 tests); underlined in green the genes that were identified in the S-PrediXcan analysis only (p<1.92e-07, Bonferroni corrected p-value threshold of p<0.05 adjusted for 259,825 tests). Colors of the dots indicate the level of LD (blue for low and red for high LD) with the lead SNP (purple; independent defined as R2<0.1, window size 250 kb).
Figure 3.
Figure 3.
a) QQ-plot of the distribution of the −log10(p-values) for the gene-based association with lifetime cannabis use against those expected under the null hypothesis Expected −log 10(p-values) under the null hypothesis are indicated by the red line. Genomic inflation is indicated with λ. The gene-based test was performed in MAGMA, which uses multiple regression (tested two-sided). b) Manhattan plot for the gene-based test of association The red line represents the genome-wide significance threshold of p<2.74e-06, (Bonferroni corrected p-value threshold of p<0.05 adjusted for 18,293 tests; NSNPs=5,710,956 were mapped to at least one gene). The top-gene (with the lowest p-value) per locus is annotated (red circle with gene symbol).
Figure 4.
Figure 4.. Genetic overlap between lifetime cannabis use and other phenotypes
Blue dots represent point estimates of the genetic correlation, blue error bars represent 95% confidence intervals and red asterisks indicate significant associations after correction for multiple testing (two-sided p<0.002, Bonferroni corrected p-value threshold of p<0.05 adjusted for 25 tests). MDD=Major Depressive Disorder; ADHD=Attention Deficit Hyperactivity Disorder; BMI=Body Mass Index

References

    1. Volkow ND, Compton WM & Weiss SR Adverse health effects of marijuana use. The New England journal of medicine 371, 879, doi:10.1056/NEJMc1407928 (2014). - DOI - PubMed
    1. Moore TH et al. Cannabis use and risk of psychotic or affective mental health outcomes: a systematic review. Lancet (London, England) 370, 319–328, doi:10.1016/s0140-6736(07)61162-3 (2007). - DOI - PubMed
    1. Hall W & Degenhardt L Adverse health effects of non-medical cannabis use. Lancet (London, England) 374, 1383–1391 (2009). - PubMed
    1. Verweij KJH et al. Genetic and environmental influences on cannabis use initiation and problematic use: a meta-analysis of twin studies. Addiction 105, 417–430, doi:10.1111/j.1360-0443.2009.02831.x (2010). - DOI - PMC - PubMed
    1. Agrawal A, Neale MC, Jacobson KC, Prescott CA & Kendler KS Illicit drug use and abuse/dependence: modeling of two-stage variables using the CCC approach. Addict Behav 30, 1043–1048 (2005). - PubMed

Publication types

MeSH terms

Substances