. 2018 Aug 27;8(1):12923.
doi: 10.1038/s41598-018-31025-0.

Ethanol and C2 ceramide activate fatty acid oxidation in human hepatoma cells

Affiliations

Ethanol and C2 ceramide activate fatty acid oxidation in human hepatoma cells

Jason M Correnti et al. Sci Rep. .

Abstract

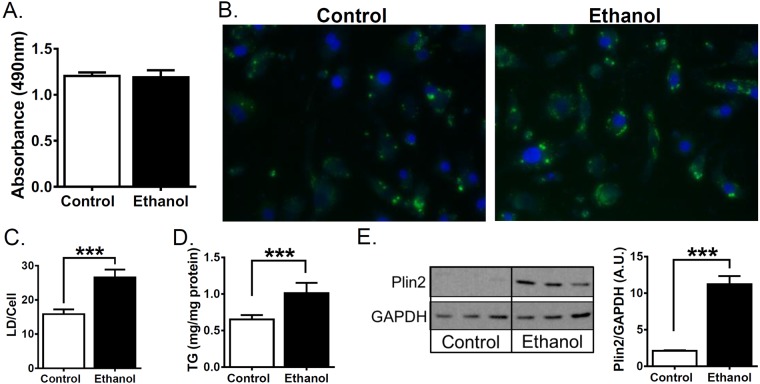
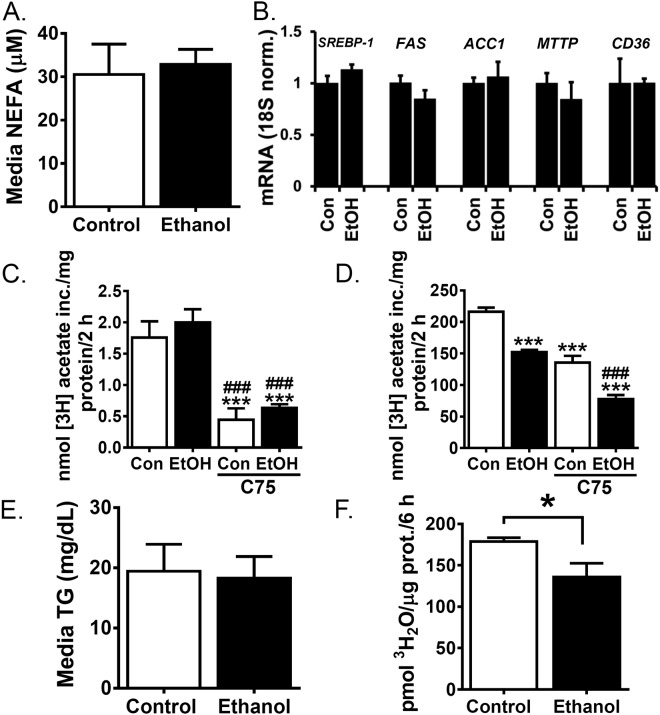
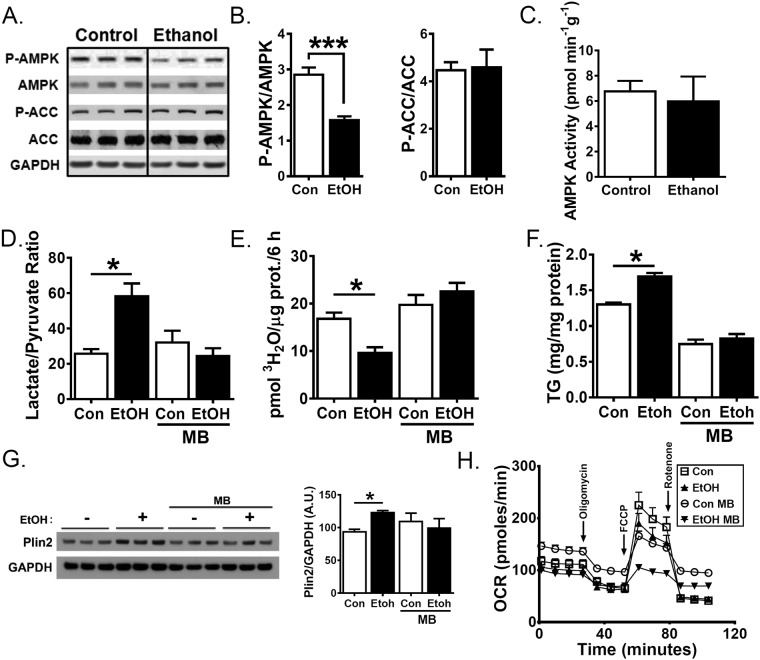
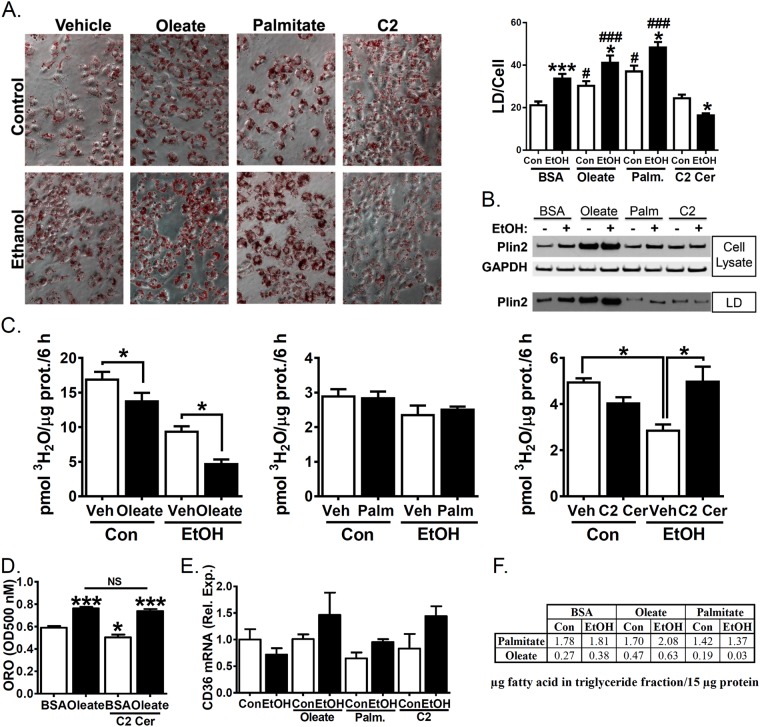
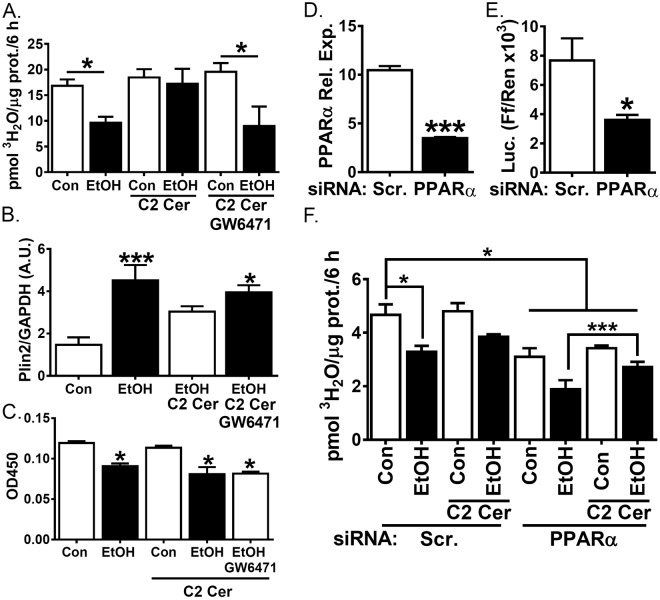
Obesogenic lipids and the sphingolipid ceramide have been implicated as potential cofactors in alcoholic liver disease (ALD) patients. However, the mechanisms by which these lipids modulate lipid trafficking in ethanol-treated human liver cells to promote steatosis, an early stage of ALD, are poorly understood. We measured fatty acid (FA) uptake, triglyceride export, FA synthesis and FA oxidation in human hepatoma (VL-17A) cells in response to ethanol and the exogenous lipids oleate, palmitate and C2 ceramide. We found that in combination with ethanol, both oleate and palmitate promote lipid droplet accumulation while C2 ceramide inhibits lipid droplet accumulation by enhancing FA oxidation. Further, using both a pharmacologic and siRNA approach to reduce peroxisome proliferator-activated receptors α (PPARα) gene expression, we demonstrate that C2 ceramide abrogates ethanol-mediated suppression of FA oxidation through an indirect PPARα mechanism. Together, these data suggest that lipids interact differentially with ethanol to modulate hepatocellular lipid droplet accumulation and may provide novel targets for preventing the earliest stage of alcoholic liver disease, alcoholic steatosis.


Conflict of interest statement

The authors declare no competing interests.

Figures

Figure 1
Figure 1
Ethanol treatment enhances lipid droplet accumulation, TG and PLIN2 expression in VL-17A human hepatoma cells. (A–E) VL-17A cells were treated for 48 h with control media or media supplemented with 100 mM ethanol. (A) Cell viability was assessed by CellTiter 96® Aqueous One Solution Cell Proliferation Assay. (B) Representative 10x images and quantitation from cells fixed and stained with lipophilic stain Nile Red (green) and DAPI (blue). (C) Quantitation of lipid droplets from stained cells. (D) TG determined in cell extracts (N = 5). (E) Cropped western blot images from different blots and quantitation of PLIN2 or GAPDH protein (N = 3) from cell lysates. Full length blots are in Supplementary Figure 1. Data presented as mean +/−SEM. ***p < 0.01 relative to control.
Figure 2
Figure 2
Ethanol treatment decreases fatty acid oxidation but not extracellular NEFA, TG or FA synthesis. (A–F) Cells were treated for 48 h with control media or media supplemented with 100 mM ethanol. (A) Cell supernatants were assessed for NEFA. (B) Isolated mRNA was assayed by real time RT-PCR for SREBP-1, FAS, ACC1, MTTP and CD36. VL-17A cells. (C) VL-17A cells were treated for 2 h with 500 µM 3H-acetate with or without the FAS inhibitor C75 (500 µM). Radiolabel incorporation into lipid soluble cell extracts was measured. (D) HepG2 cells were treated as in C. (E) Cell supernatants were assessed for TG. (F) Oleate oxidation was quantified by measuring 3H water liberation from 3H labelled oleate. Data presented as mean +/−SEM. *p < 0.05 relative to control, ***p < 0.01 relative to control, ###p < 0.01 relative to ethanol treated (N = 3–5).
Figure 3
Figure 3
Restoring redox potential normalizes fatty acid oxidation and blocks TG accumulation in ethanol treated cells. (A–F) VL-17A cells were treated for 48 h with control media or media supplemented with 100 mM ethanol alone or with 10 µM methylene blue (MB) for 24 h (DG). (A) Cropped western blot images for GAPDH, phosphorylated and total AMPK and ACC from different blots. Full length blots are in Supplementary Figure 1. (B) Densitometric quantitation of blots in A. (C) AMPK activity was measured in cell lysates by measuring 32P-phosphate transfer from radiolabeled ATP to the SAMS peptide. (D) Lactate/pyruvate ratio was determined enzymatically in cell supernatants. (E) Oleate oxidation was quantified by measuring 3H water liberation from 3H labelled oleate. (F) TG was measured in cell lysates. (G) Cropped western blot images from different blots and quantitation of PLIN2 and GAPDH protein levels (N = 3) from cell lysates. Full length blots are in Supplementary Figure 1. (H) Oxygen Consumption Rate was measured using Seahorse XF96 Analyzer during a mitochondrial stress test. 1 µM Oligomycin, 1 µM Carbonyl cyanide-4-(trifluoromethoxy)phenylhydrazone (FCCP), and a mix of 0.5 µM rotenone and antimycin A were added at the given times. Data presented as mean +/−SEM. *p < 0.05 relative to control, ***p < 0.01 relative to control, (N = 3–5).
Figure 4
Figure 4
Co-treatment with C2 ceramide but not oleate or palmitate reverses ethanol-mediated reduction in fatty acid oxidation. (A–F) VL-17A cells were treated for 48 h with control- or 100 mM ethanol-containing media or supplemented with BSA (vehicle control), 100 µM oleate, 40 µM palmitate or 10 µM C2 ceramide. (A) Representative images and quantitation (N = 17–20) from cells fixed and stained with Oil Red O. (B) PLIN2 and GAPDH were measured by western blotting of whole cell lysates or isolated lipid droplets. Representative cropped western blot images from different blots shown. Full-length blots are in Supplementary Figure 1. (C) Oleate oxidation was quantified by measuring 3H water liberation from 3H labelled oleate (N = 5). (D) Oil red O staining in fixed cells was quantified by elution in isopropanol followed by optical density reading at 500 nM. (E) Isolated mRNA was assayed by real time RT-PCR for CD36. (F) LC-MS/MS analysis of FA composition of triglyceride. Listed values are µg fatty acid in triglyceride fraction/15 µg protein. Data presented as mean +/−SEM. *p < 0.05 relative to BSA Con, ***p < 0.01 relative to BSA Con, ###p < 0.01, #p < 0.05 compared to BSA Con with same exogenous lipid.
Figure 5
Figure 5
PPARα antagonist GW6471 restores ethanol-mediated inhibition of FA oxidation and increased PLIN2 expression in C2 ceramide treated cells. (A–F) VL-17A cells were treated for 48 h with control or ethanol (100 mM)-containing media supplemented with 10 µM C2 ceramide. (A–C) cells were treated with 5 µM GW6471 for 24 h. (A) Oleate oxidation was quantified by measuring 3H water liberation from 3H labelled oleate (N = 5). (B) Densitometric quantification of PLIN2 and GAPDH measured in cell lysates by western blot (N = 3). (C) PPARα binding in nuclear extracts were quantified by transcription factor binding assay. (D–F) cells were transfected with scramble or PPARα siRNA 5 days before ethanol treatment. (D) PPARα mRNA was assayed by real time RT-PCR. (E) Firefly and renilla luciferase activity was assayed in cell extracts 48 h following transfection with the Cignal PPAR Reporter plasmid. (F) Oleate oxidation was quantified as in A. Data presented as mean +/−SEM. *p < 0.05 relative to control, ***p < 0.01 relative to control.

References

    1. Day CP, James OF. Hepatic steatosis: innocent bystander or guilty party? Hepatology (Baltimore, Md.) 1998;27:1463–1466. doi: 10.1002/hep.510270601. - DOI - PubMed
    1. Scheig R, Isselbacher KJ. Pathogenesis of ethanol-induced fatty liver. 3. in vivo and vitro effects of ethanol on hepatic fatty acid metabolism in rats. J Lipid Res. 1965;6:269–277. - PubMed
    1. Schapiro RH, Drummey GD, Shimizu Y, Isselbacher KJ. Studies on the pathogenesis of the ethanol-induced fatty liver. II. effect of ethanol on palmitate-1-c-14 metabolism by the isolated perfused rat liver. J Clin Invest. 1964;43:1338–1347. doi: 10.1172/JCI105009. - DOI - PMC - PubMed
    1. Kondrup J, Grunnet N. The effect of acute and prolonged ethanol treatment on the contents of coenzyme A, carnitine and their derivatives in rat liver. Biochem J. 1973;132:373–379. doi: 10.1042/bj1320373. - DOI - PMC - PubMed
    1. Lieber CS, Schmid R. The effect of ethanol on fatty acid metabolism; stimulation of hepatic fatty acid synthesis in vitro. J Clin Invest. 1961;40:394–399. doi: 10.1172/JCI104266. - DOI - PMC - PubMed

Publication types

MeSH terms