. 2018 Aug 27;9(1):3469.
doi: 10.1038/s41467-018-05927-6.

Mechanical interactions among followers determine the emergence of leaders in migrating epithelial cell collectives

Affiliations

Mechanical interactions among followers determine the emergence of leaders in migrating epithelial cell collectives

Medhavi Vishwakarma et al. Nat Commun. .

Abstract

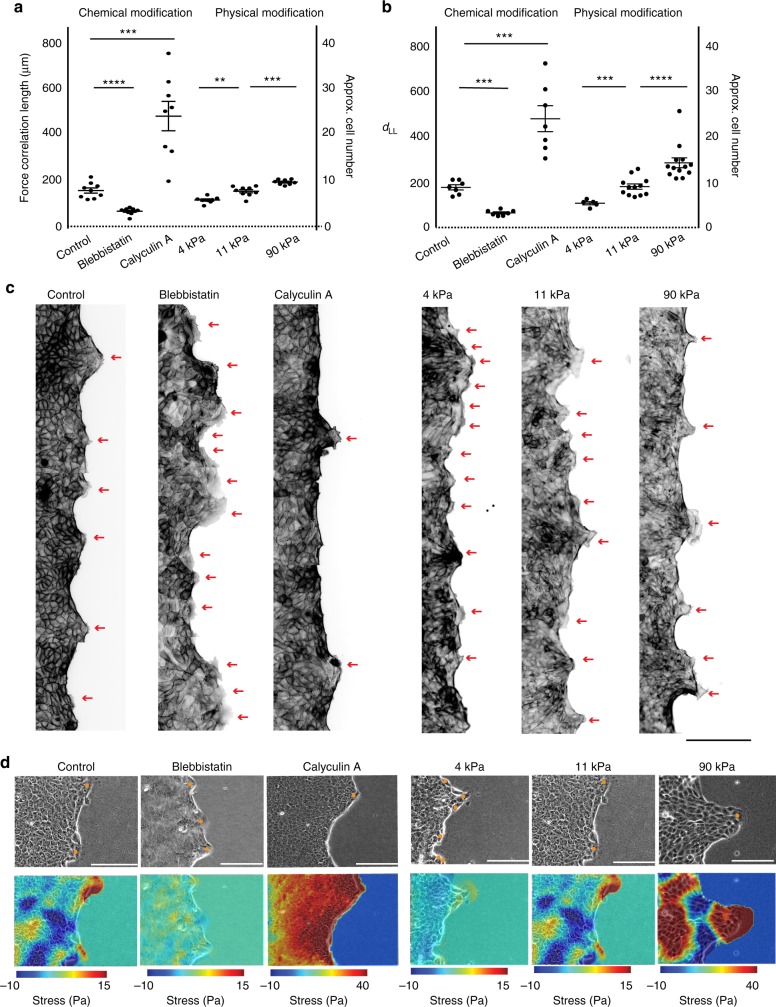
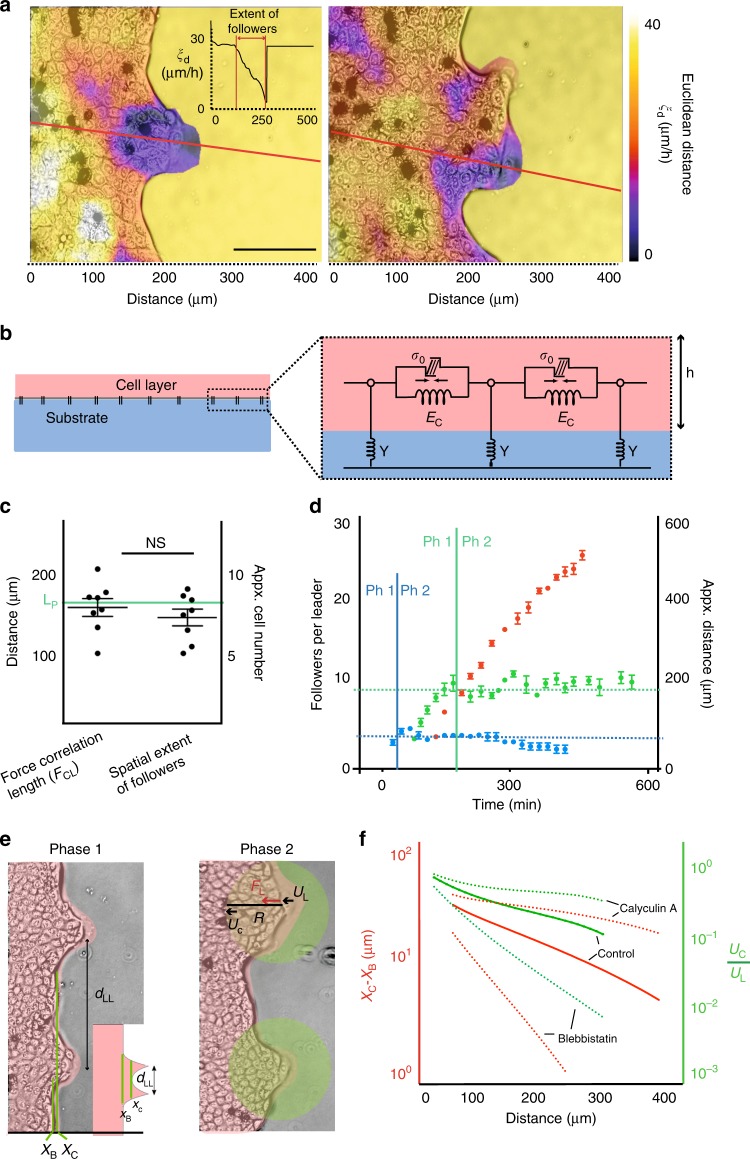
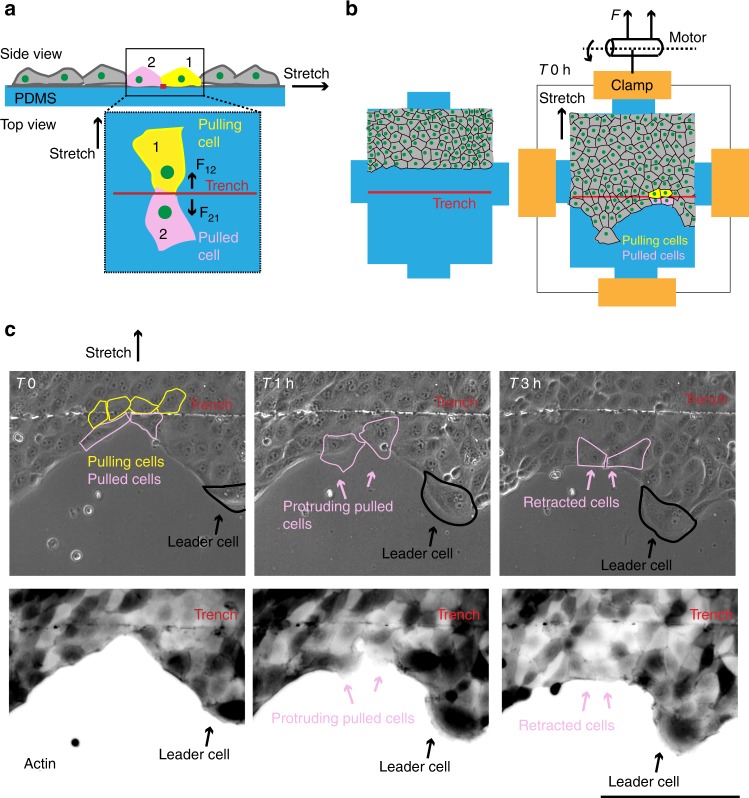
Regulating the emergence of leaders is a central aspect of collective cell migration, but the underlying mechanisms remain ambiguous. Here we show that the selective emergence of leader cells at the epithelial wound-margin depends on the dynamics of the follower cells and is spatially limited by the length-scale of collective force transduction. Owing to the dynamic heterogeneity of the monolayer, cells behind the prospective leaders manifest locally increased traction and monolayer stresses much before these leaders display any phenotypic traits. Followers, in turn, pull on the future leaders to elect them to their fate. Once formed, the territory of a leader can extend only to the length up-to which forces are correlated, which is similar to the length up-to which leader cells can transmit forces. These findings provide mechanobiological insight into the hierarchy in cell collectives during epithelial wound healing.


Conflict of interest statement

The authors declare no competing interests.

Figures

Fig. 1
Fig. 1
Force transmission from followers facilitate leader cell formation. a Illustration depicting generation of confinement on a polyacrylamide (PAA) gel using polydimethylsiloxane (PDMS) blocks. Removal of confinement triggers collective cell migration. b Schematic representation of cell monolayer immediately after (T 0 h), three hours (T 3 h), and seven hours (T 7 h) after confinement removal. c From top to bottom, representative phase contrast images (Panel-1), corresponding traction force profiles (Panel-2), landscapes of average normal stress overlapped with phase contrast images (Panel-3) and corresponding color coded maps of shape indices (Panel-4) showing accumulation of high forces and local unjamming-like transition in followers behind future leaders in different phases of wound healing. d Scatter dot plot showing traction forces behind leader and non-leader cells in phase 0 and phase 1. e Scatter dot plot showing average normal stress behind leader and non-leader cells in phase 0 and phase 1. f Box plot showing shape indices in the regions behind leader and non-leader cells in phase 0 and phase 1. Box plots shows median and quartiles. L1 and L2 are leader cells appearing in Phase-1 and Phase-2, and are marked with orange dots. Red and blue circles mark the zones considered for statistical comparison of the traction stress behind leaders and non-leaders respectively and are defined by force localization length (radius = LP/2). Whiskers are maximum and minimum data points. Line in scatter dot plots represent mean. *P < 0.05, ****P < 0.0001, Mann–Whitney test. S.D is standard deviation and C.V. is coefficient of variation. Scale bars = 100 μm. Data collected from at least three independent experiments
Fig. 2
Fig. 2
Length scale of force transmission override interfacial bias and determine territory of a leader cell. a Representative landscape of average normal stress in bulk (here shown with 3D height) overlaid on corresponding phase contrast image showing groups of cells under each peak. b Actin staining image showing appearance of leader cells (shown by red arrows) at an interval dLL in phase 1. c Box plots showing no significant difference between leader to leader distance (dLL) and the Force correlation length (FCL) in both MDCK (top) and HaCaT (bottom) cells. d Statistical distribution of dLL two hours after the confinement removal (T = + 90 min) for different micro-patterned and non-patterned (unbiased) monolayers. e design of PDMS micro-stencil, demonstrating beak shape interfacial patterns to bias leader cell formation (left). Representative images of migrating LifeAct-transfected MDCK cells right after (T = 0 h, middle) and two hours after (T = 2 h, Right) the confinement removal, for different micropatterns. Whiskers in box plots are maximum and minimum data points. Scatter dot plots display mean with maximum and minimum range as error bars. NS: not significant, P > 0.05, Student’s t-test. Scale bars, 100 μm. Data collected from at least three independent experiments
Fig. 3
Fig. 3
Modifying length scale of force transmission modifies distance between leaders. a Scatter dot plot showing force correlation length in terms of cell number upon chemical modification, i.e., by treating the cells with blebbistatin and calyculin A compared to the control, and upon physical modification, i.e., by changing substrate stiffness. b Scattered dot plot showing distance between leaders in terms of cell number upon chemical and physical modifications. c Representative images of control, blebbistatin treated, calyculin A treated collectives and collectives on gels with varying stiffness 4 KPa, 11 KPa, and 90 KPa (from left to right) as stained for actin, show changing distance between leader cells upon chemical modification and physical modifications. d Representative phase contrast images (top panel) and landscapes of average normal stress from control blebbistatin treated, calyculin A treated collectives and from collectives on gels with varying stiffness, 4 KPa, 11 KPa and 90 KPa (from left to right), as measured during migration. Note that the Calyculin A treated and 90KPa stress profiles have a different scale due to high stress levels. Cell density was kept constant = 3000 cells/mm2. Line represents mean and errors bars represents S.E.M. **** P < 0.0001, Mann–Whitney test. Scale bars, 100 μm. Data collected from at least three independent experiments
Fig. 4
Fig. 4
Length up-to which force is transmitted regulates number of followers and necessitate the transition from phase-1 to phase-2. a Spatial extent of followers per leader as computed by Euclidean distance calculated along the red line (Inner plot). Phase contrast images overlaid with Euclidean distance profile showing extent of followers. b side view of the model used to calculate length scale of force transmission (LP). Epithelial layer of height h, modeled as an elastic medium of elasticity EC, Poisson’s ratio ν and an isotropic contraction stress σ0. c Scatter dot plot showing spatial extent of followers in sync with force correlation length, FCL as calculated experimentally and force localization LP as calculated theoretically. Line represents mean and errors bars represents S.E.M. d Transition from phase-1 (Ph1) to phase-2 (Ph2) in a developing outgrowth in control (green), blebbistatin (blue) and calyculin A (red)-treated monolayers showing followers per leader reaching a plateau in phase-2. Both Followers per leader and transition time changes upon changing the force correlation length by drugs. e Simulating leader cell formation in phase 1 (left) and in phase 2 (right). In phase 1, the relative horizontal distance (XC – XB) is calculated upon varying dLL where XC is the horizontal displacement of the boundary between the leader cells and XB is the baseline displacement. When two leader cells are distinguishable, XB ≈ XC as shown in the overlay with experimental data. In phase 2, an advanced cellular cohort guided by the leader cell is shown by a circle of radius R attached to the remaining bulk. The effect of a point force FL exerted by the leader on the remaining bulk is measured, i.e., the relative displacement of the bulk center UC with respect to the leader cell displacement UL. f Relative horizontal displacement |XC – XB| plotted against distance dLL and relative displacement UC/UL plotted against distance R. With distance, both |XC – XB| and UC/UL decay exponentially with a characteristic decay length equivalent to the force localization length LP. Modification of cell stiffness modifies LP (dotted lines) and therefore the characteristic decay length of the curves changes upon tuning the cell stiffness with drugs. NS: not significant, P > 0.05, Mann–Whitney test. Scale bars, 100 μm
Fig. 5
Fig. 5
Followers pull on the future leader cells. a Schematic illustration showing side view and top view of the cell-pulling experiment. Cells seeded on PDMS substrates (in blue) with a fine trench (in red). Upon uniaxial stretching, cells on one side of the trench exert pulling forces on cells on the other side (F12 and F21). b Cell monolayer seeded on the PDMS substrate containing a fine trench (in red) about 100 μm away from the cells, confinement was released and cells were allowed to migrate until one row of cells cross the trench at various locations (right panel). c Representative time lapse phase contrast images (top panel) and actin images (bottom panel) showing cells moving on PDMS substrate with a trench. Upon stretching, cells ahead of the trench protrude due to the pulling force from behind (middle panel). These protruding cells however retract, likely due to the existing pulling force coming from the leader at the tip of the outgrowth (right panel). Scale bar = 100 μm

References

    1. Friedl P, Gilmour D. Collective cell migration in morphogenesis, regeneration and cancer. Nat. Rev. Mol. Cell Biol. 2009;10:445–457. doi: 10.1038/nrm2720. - DOI - PubMed
    1. Friedl P, Locker J, Sahai E, Segall JE. Classifying collective cancer cell invasion. Nat. Cell Biol. 2012;14:777–783. doi: 10.1038/ncb2548. - DOI - PubMed
    1. Haeger A, Wolf K, Zegers MM, Friedl P. Collective cell migration: guidance principles and hierarchies. Trends Cell Biol. 2015;25:556–566. doi: 10.1016/j.tcb.2015.06.003. - DOI - PubMed
    1. Mayor R, Etienne-Manneville S. The front and rear of collective cell migration. Nat. Rev. Mol. Cell Biol. 2016;17:97–109. doi: 10.1038/nrm.2015.14. - DOI - PubMed
    1. Rorth P. Fellow travellers: emergent properties of collective cell migration. EMBO Rep. 2012;13:984–991. doi: 10.1038/embor.2012.149. - DOI - PMC - PubMed

Publication types

Substances