

A fluorescent membrane tension probe
- PMID: 30150727
- PMCID: PMC6197433
- DOI: 10.1038/s41557-018-0127-3
A fluorescent membrane tension probe
Abstract
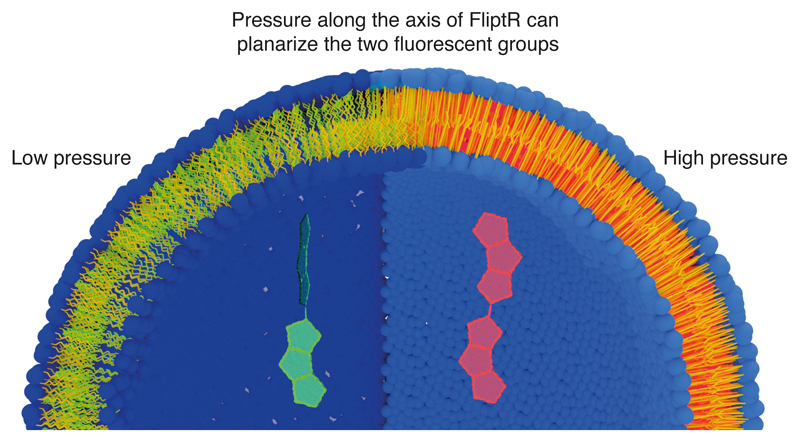
Cells and organelles are delimited by lipid bilayers in which high deformability is essential to many cell processes, including motility, endocytosis and cell division. Membrane tension is therefore a major regulator of the cell processes that remodel membranes, albeit one that is very hard to measure in vivo. Here we show that a planarizable push-pull fluorescent probe called FliptR (fluorescent lipid tension reporter) can monitor changes in membrane tension by changing its fluorescence lifetime as a function of the twist between its fluorescent groups. The fluorescence lifetime depends linearly on membrane tension within cells, enabling an easy quantification of membrane tension by fluorescence lifetime imaging microscopy. We further show, using model membranes, that this linear dependency between lifetime of the probe and membrane tension relies on a membrane-tension-dependent lipid phase separation. We also provide calibration curves that enable accurate measurement of membrane tension using fluorescence lifetime imaging microscopy.
Conflict of interest statement
The authors declare no competing financial and non-financial interest.
Figures
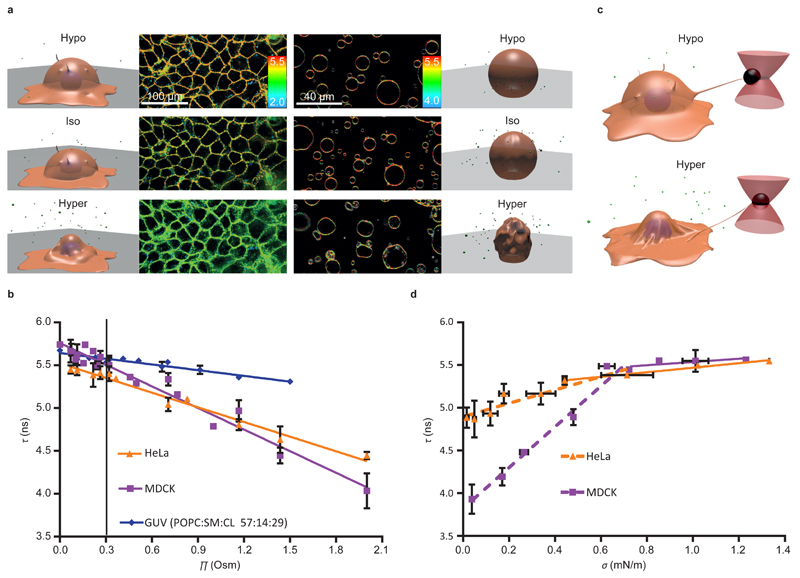
 , slope hypo= -0.27 ± 0.13 ns·Osm–1, slope hyper: -0.59 ± 0.04 ns·Osm–1, Mean ± SD as in the rest of the measurements, N=20), MDCK cells (
 , slope hypo= -0.50 ± 0.33 ns·Osm–1, slope hyper: -0.88 ± 0.07 ns·Osm–1, N=6) and GUVs (
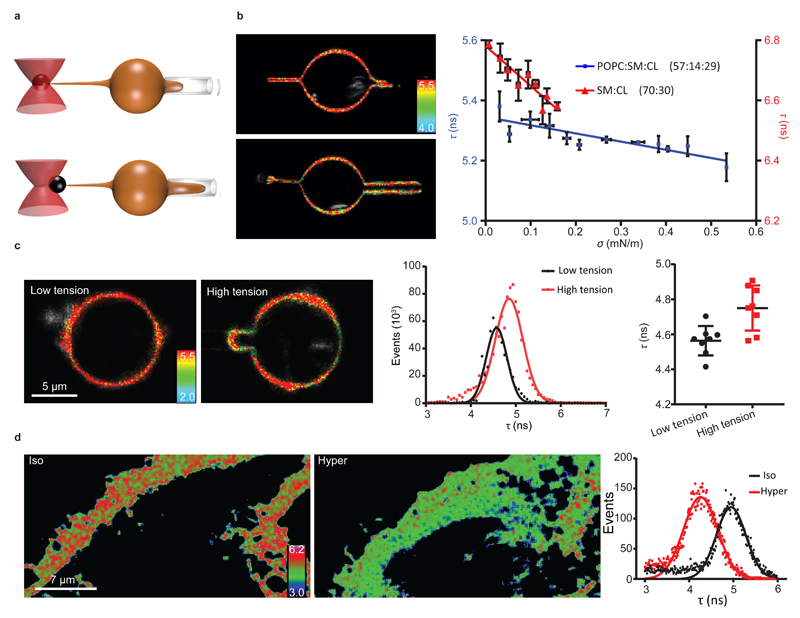
 , slope hypo= -0.19 ± 0.18 ns·Osm–1, slope hyper: -0.22 ± 0.03 ns·Osm–1, N=4), with linear curve fit, black line represents the initial state. (c) To correlate osmotic pressure Π with membrane tension σ, cells were connected to optical tweezers through pulled-out lipid nanotubes, and σ was calculated from the tube force measured in response to osmotic shocks applied. (d) FliptR fluorescence lifetime τ1 as a function of the membrane tension σ applied by osmotic shocks to Hela (, slope hypo= 0.26 ± 0.06 ns·m·mN–1, slope hyper: 0.78 ± 0.14 ns·m·mN–1, N=7) and MDCK cells (, slope hypo= 0.16 ± 0.07 ns·m·mN–1, slope hyper: 2.38 ± 0.18 ns·m·mN–1, N=11) with pulled-out tubes connected to optical tweezers (c), with fit to the linear range before the onset of saturation above τ1 = 5.5 ns).
References
-
- Helfrich W. Elastic properties of lipid bilayers : theory and possible experiments. Zur Naturforschung. 1973;28c:693–703. - PubMed
-
- Soleimanpour S, Colom A, Derivery E, Gonzalez-Gaitan M, Roux A, Sakai N, et al. Headgroup engineering in mechanosensitive membrane probes. Chem Commun (Camb) 2016;52(100):14450–14453. - PubMed
Publication types
MeSH terms
Substances
Grants and funding
LinkOut - more resources
Full Text Sources
Other Literature Sources
