. 2018 Aug 27;8(1):12823.
doi: 10.1038/s41598-018-31262-3.

Linking host morphology and symbiont performance in octocorals

Affiliations

Linking host morphology and symbiont performance in octocorals

Sergio Rossi et al. Sci Rep. .

Abstract

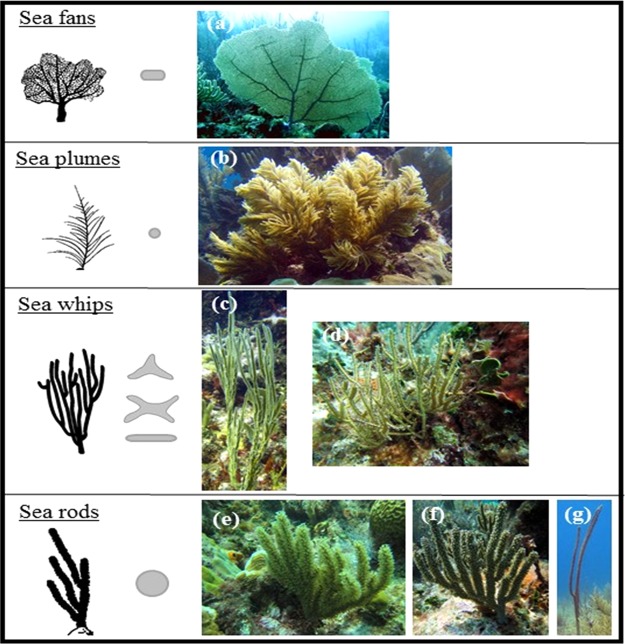
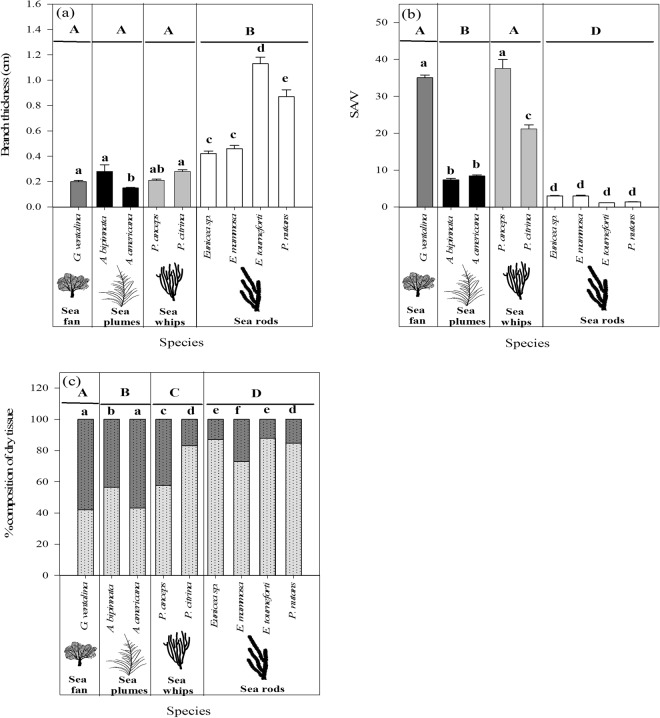
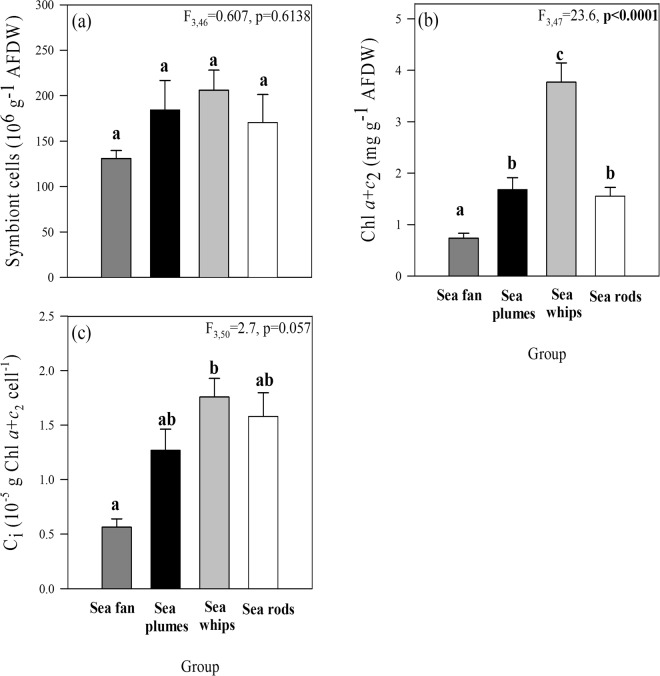
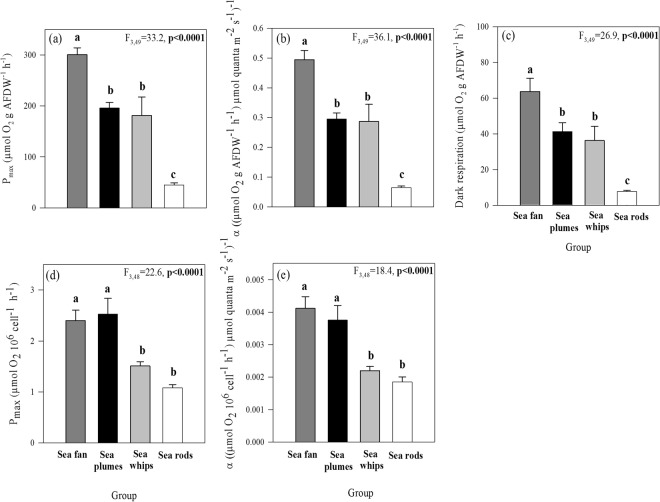
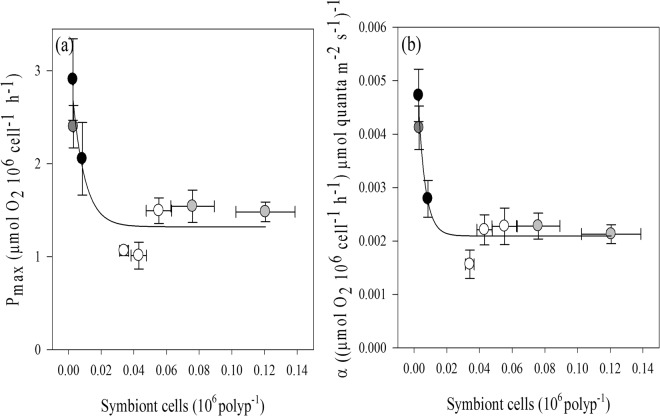
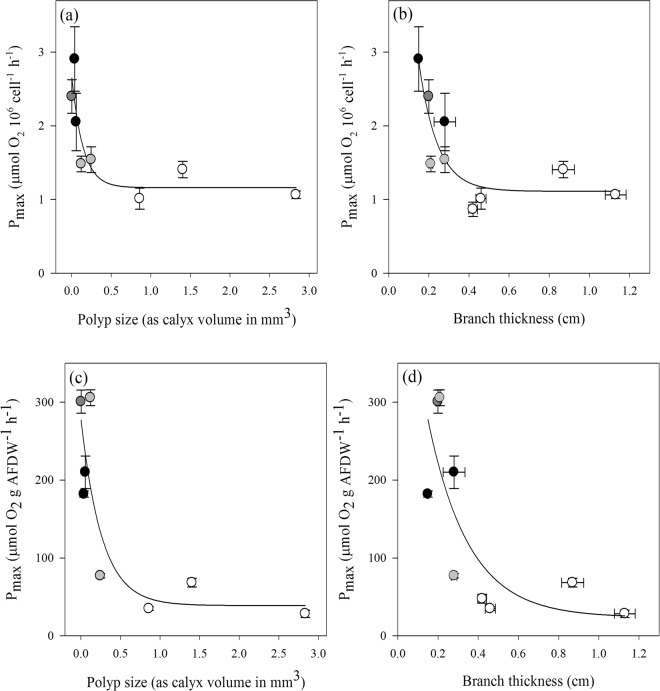
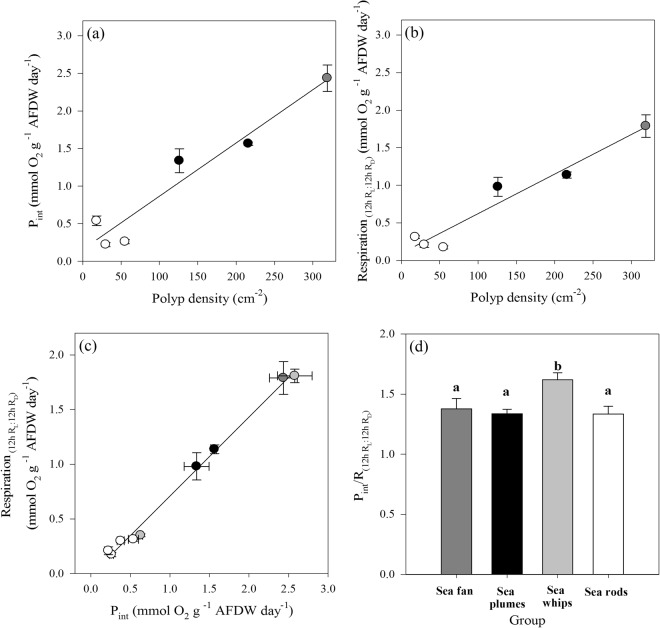
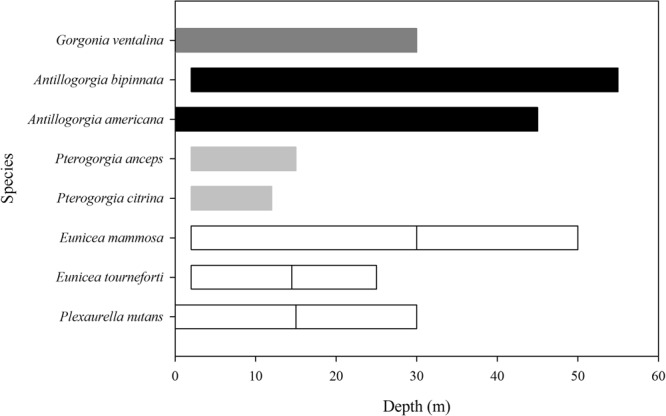
Octocorals represent an important group in reef communities throughout the tropical seas and, like scleractinian corals, they can be found in symbiosis with the dinoflagellate Symbiodinium. However, while there is extensive research on this symbiosis and its benefits in scleractinians, research on octocorals has focused so far mainly on the host without addressing their symbiosis. Here, we characterized and compared the photophysiological features of nine Caribbean octocoral species with different colony morphologies (sea fan, plumes, whips and rods) and related key morphological features with their respective symbiont photobiology. Colony features (branch shape and thickness), as well as micromorphological features (polyp size, density), were found to be significantly correlated with symbiont performance. Sea fans and plumes, with thinner branches and smaller polyps, favor higher metabolic rates, compared to sea rods with thicker branches and larger polyps. Daily integrated photosynthesis to respiration ratios > 1 indicated that the autotrophic contribution to organisms' energy demands was important in all species, but especially in sea whips. This information represents an important step towards a better understanding of octocoral physiology and its relationship to host morphology, and might also explain to some extent species distribution and susceptibility to environmental stress.


Conflict of interest statement

The authors declare no competing interests.

Figures

Figure 1
Figure 1
Photos of the studied Caribbean octocoral species, showing their differences in branch morphologies: (a) Gorgonia ventalina, (b) Antillogorgia americana, (c) Pterogorgia anceps, (d) Pterogorgia citrina, (e) Eunicea mammosa, (f) Eunicea tourneforti and (g) Plexaurella nutans. Branch cross sections (in grey) drawn according to Cairns. Photos are courtesy of Eric Jordán-Dahlgren.
Figure 2
Figure 2
Comparison of the morphological characteristics of the studied Caribbean octocoral species: (a) branch thickness (n = 6 per species), (b) surface area to volume ratio (SA/V) (n = 10 per species) and (c) sclerite (light grey) and organic matter content (dark grey) (n = 6 per species). Results of one-way ANOVA to indicate significant differences (ANOVA, Newman-Keuls test, p < 0.05) between species and groups based on branch morphology are shown as lowercase and uppercase letters, respectively. Data represent means ± SE.
Figure 3
Figure 3
Differences in symbiont cell numbers and chlorophyll content, normalized by AFDW (a,b), and chlorophyll content per symbiont cell (c) of octocoral species grouped based on similar morphological traits. Results of one-way ANOVA are shown and significant differences between groups (ANOVA, Newman-Keuls test, p < 0.05) are indicated by superscript letters. Data represent means ± SE (n = 6).
Figure 4
Figure 4
Differences in photosynthetic parameters, normalized by AFDW (ac) and symbiont cell number (d,e) of octocoral species grouped based on similar morphological traits. Results of one-way ANOVA are shown and significant differences between groups (ANOVA, Newman-Keuls test, p < 0.05) are indicated by superscript letters. Data represent means ± SE (n = 6).
Figure 5
Figure 5
Relationships between the number of symbiont cells per polyp and the photosynthetic performance of the different octocoral species, normalized by symbiont density (sea fan- dark grey circle, sea plumes- black circles, sea whips- grey circles, sea rods- white circles). Exponential relationship between symbiont density and (a) maximum photosynthetic rate (R2 = 0.82, y = 1.32 + 1.99(−133.2x), p = 0.0061) and (b) photosynthetic efficiency (R2 = 0.92, y = 0.0021 + 0.0046(−230.5x), p = 0.0008). Data represent means ± SE (n = 6).
Figure 6
Figure 6
Symbiont distribution in gorgonian corals. Histological sections from (AC) Gorgonia ventalina, (DF) Antillogorgia americana, (GI) Pterogorgia anceps and (JK) Plexaurella nutans. (A, D, G and J) are sections stained with hematoxylin-eosin dyes and photographed at 10X amplification. (B,E,H and K) are the same sections but observed using an eGFP fluorescence filter (Ex488 – Em509 nm), the fluorescence labeling corresponds to Eosin. Dotted boxes in A,D,G and J represent the amplified regions shown in B,E,H and K, respectively. For even more zooming, dotted boxes in B,E,H, and K represent the amplified regions observed in C,F,I and L, respectively. Yellow arrows label symbionts. Scale bars are 100 µm (A,D,G,J), 25 µm (B,E,H,K) or 5 µm (C,F,I,L).
Figure 7
Figure 7
Effect of polyp size (a,c) and branch thickness (b,d) on the photosynthetic performance of octocoral symbionts, normalized to symbiont cell number (a,b) and AFDW (c,d) (sea fan- dark grey circle, sea plumes- black circles, sea whips- grey circles, sea rods- white circles). Data represent means ± SE (n = 6).
Figure 8
Figure 8
Linear relationships between polyp density and (a) daily integrated gross photosynthesis and (b) respiration (sea whips are not included here, due to their polyp arrangement in lateral series only along the elevated branch ridges). (c) Linear relationship between daily photosynthesis and respiration and resulting P/R ratios (d) for octocorals with different morphological traits (sea fan- dark grey, sea plumes- black, sea whips- grey, sea rods- white). For calculation of the daily integrated respiration and P/R ratio, light respiration (RL) to RD over a 12 h: 12 h cycle was considered. Results of one-way ANOVA and posthoc test are shown and significant differences between groups (ANOVA, Newman-Keuls test, p < 0.05) are indicated by superscript letters. Data represent means ± SE.
Figure 9
Figure 9
Reported depth ranges of studied Caribbean octocoral species (sea fan- dark grey, sea plumes- black, sea whips- light grey, sea rods- white), according to Kinzie and Goldberg. Reported upper depth limits (>2 m) have been modified, as all species in this study were found at 2 m depth in the Puerto Morelos reef lagoon, Mexican Caribbean.

References

    1. Wild C, et al. Climate change impedes scleractinian corals as primary reef ecosystem engineers. Mar. Freshw. Res. 2011;62:205–215. doi: 10.1071/MF10254. - DOI
    1. Williams, G. C. & Cairns, S. D. Biodiversity myth busters, Octocoral Research Center. http://researcharchive.calacademy.org/research/izg/Biodiversity%20Myth%2... (2013).
    1. Sánchez, J. A. Diversity and evolution of octocoral animal forests at both sides of tropical America in Marine animal forests (eds Rossi, S., Bramanti, L., Gori, A. & Orejas, C.) 1–33 (2016).
    1. Schubert, N., Brown, D. & Rossi, S. Symbiotic versus non-symbiotic octocorals: Physiological and ecological implications in Marine animal forests (eds Rossi, S., Bramanti, L., Gori, A. & Orejas, C.) 887–918 (2017).
    1. Stambler, N. Zooxanthellae: the yellow symbionts inside animals in Coral Reefs: an ecosystem in transition (eds Dubinsky, Z. & Stambler, N.) 87–106 (2011).

Publication types

LinkOut - more resources