

Whole-Genome Resequencing and Pan-Transcriptome Reconstruction Highlight the Impact of Genomic Structural Variation on Secondary Metabolite Gene Clusters in the Grapevine Esca Pathogen Phaeoacremonium minimum
- PMID: 30150972
- PMCID: PMC6099105
- DOI: 10.3389/fmicb.2018.01784
Whole-Genome Resequencing and Pan-Transcriptome Reconstruction Highlight the Impact of Genomic Structural Variation on Secondary Metabolite Gene Clusters in the Grapevine Esca Pathogen Phaeoacremonium minimum
Abstract
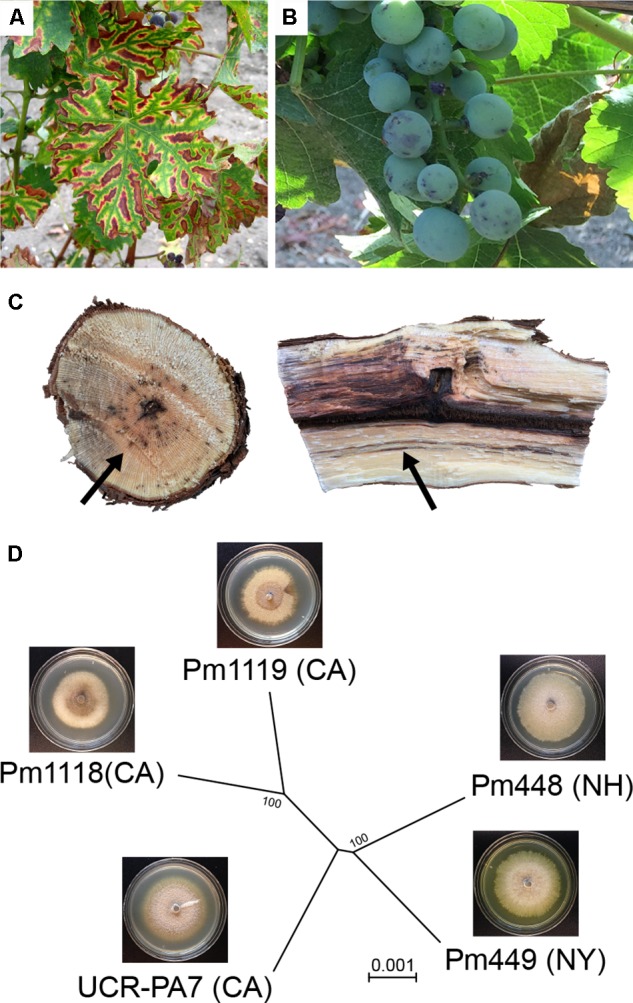
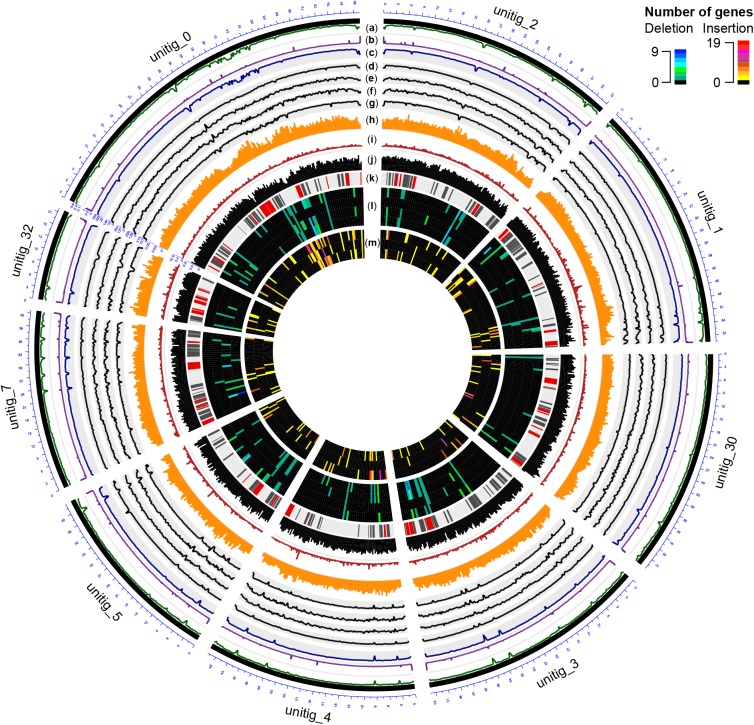
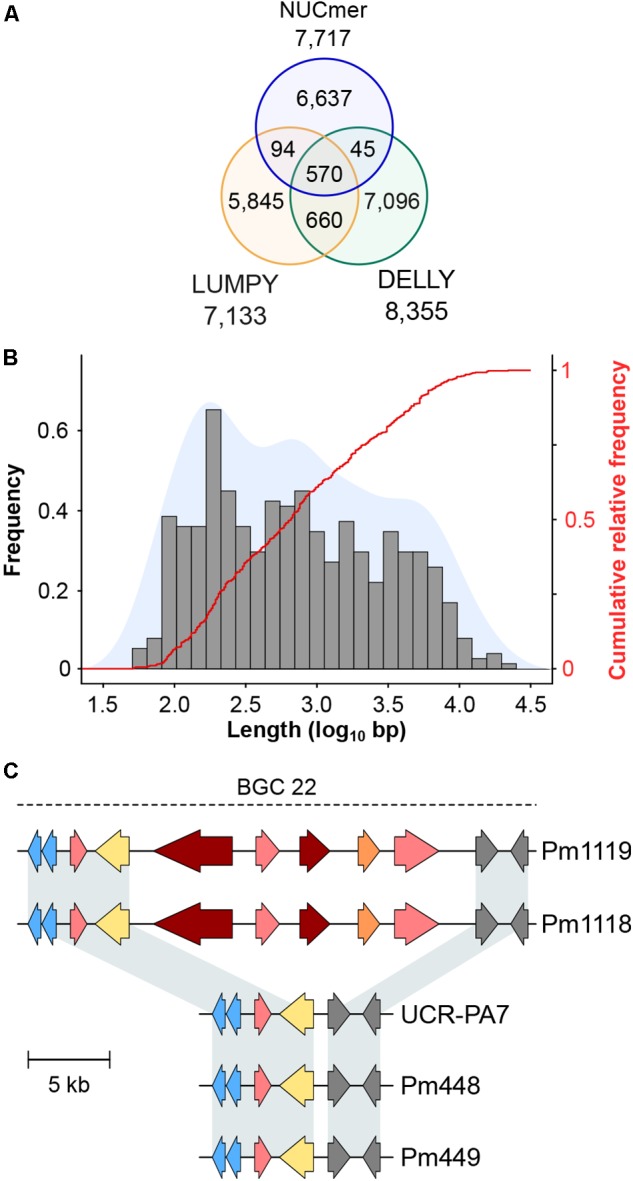
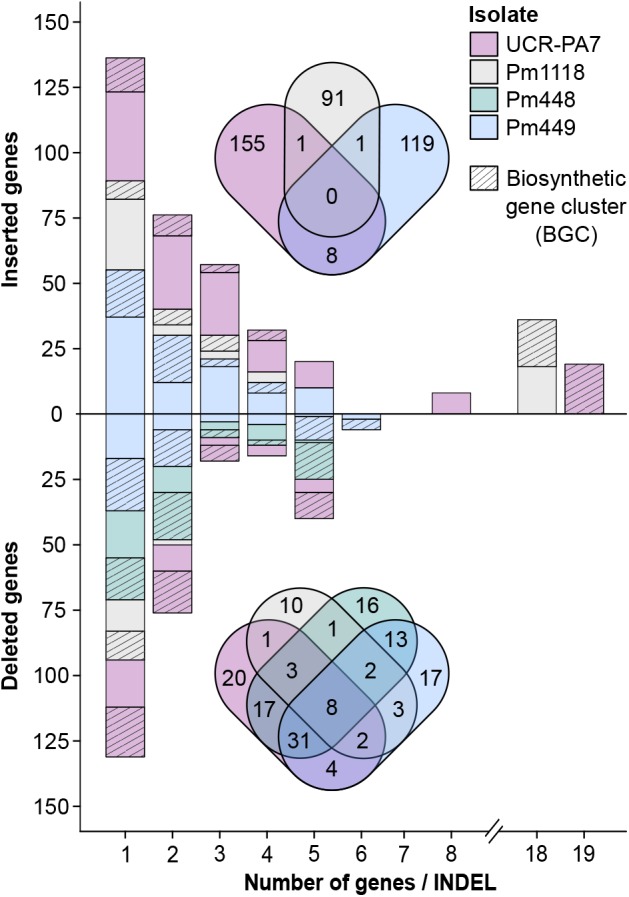
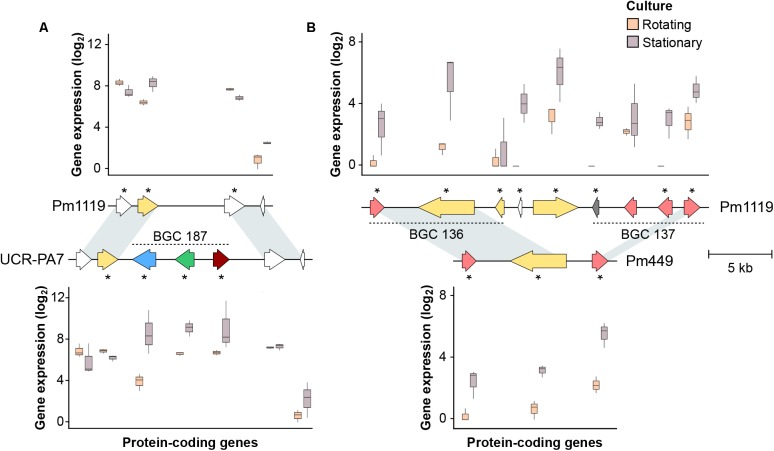
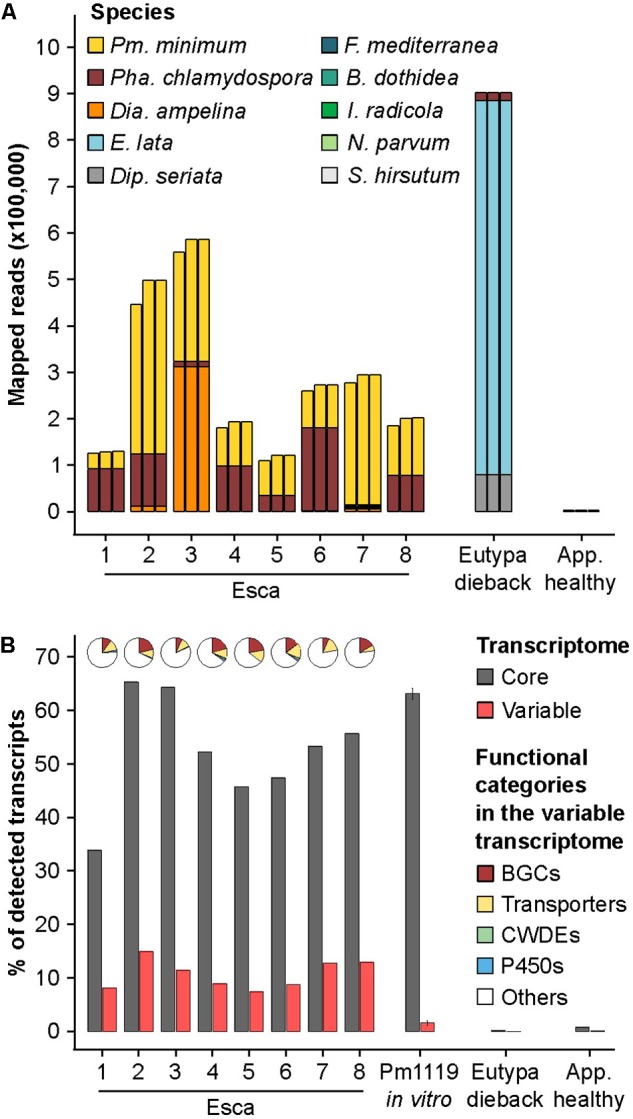
The Ascomycete fungus Phaeoacremonium minimum is one of the primary causal agents of Esca, a widespread and damaging grapevine trunk disease. Variation in virulence among Pm. minimum isolates has been reported, but the underlying genetic basis of the phenotypic variability remains unknown. The goal of this study was to characterize intraspecific genetic diversity and explore its potential impact on virulence functions associated with secondary metabolism, cellular transport, and cell wall decomposition. We generated a chromosome-scale genome assembly, using single molecule real-time sequencing, and resequenced the genomes and transcriptomes of multiple isolates to identify sequence and structural polymorphisms. Numerous insertion and deletion events were found for a total of about 1 Mbp in each isolate. Structural variation in this extremely gene dense genome frequently caused presence/absence polymorphisms of multiple adjacent genes, mostly belonging to biosynthetic clusters associated with secondary metabolism. Because of the observed intraspecific diversity in gene content due to structural variation we concluded that a transcriptome reference developed from a single isolate is insufficient to represent the virulence factor repertoire of the species. We therefore compiled a pan-transcriptome reference of Pm. minimum comprising a non-redundant set of 15,245 protein-coding sequences. Using naturally infected field samples expressing Esca symptoms, we demonstrated that mapping of meta-transcriptomics data on a multi-species reference that included the Pm. minimum pan-transcriptome allows the profiling of an expanded set of virulence factors, including variable genes associated with secondary metabolism and cellular transport.
Keywords: Esca; comparative genomics; intraspecific genetic diversity; pan-transcriptome; pathogenomics; secondary metabolism; structural variation.
Figures
Similar articles
-
Comparative Pangenomic Insights into the Distinct Evolution of Virulence Factors Among Grapevine Trunk Pathogens.Mol Plant Microbe Interact. 2024 Feb;37(2):127-142. doi: 10.1094/MPMI-09-23-0129-R. Epub 2024 Feb 21. Mol Plant Microbe Interact. 2024. PMID: 37934016
-
Molecular and phenotypic characterisation of novel Phaeoacremonium species isolated from esca diseased grapevines.Persoonia. 2008 Dec;21:119-34. doi: 10.3767/003158508X374385. Epub 2008 Oct 7. Persoonia. 2008. PMID: 20396582 Free PMC article.
-
Distinctive expansion of gene families associated with plant cell wall degradation, secondary metabolism, and nutrient uptake in the genomes of grapevine trunk pathogens.BMC Genomics. 2015 Jun 19;16(1):469. doi: 10.1186/s12864-015-1624-z. BMC Genomics. 2015. PMID: 26084502 Free PMC article.
-
Overview of genomic and bioinformatic resources for Zymoseptoria tritici.Fungal Genet Biol. 2015 Jun;79:13-6. doi: 10.1016/j.fgb.2015.04.011. Fungal Genet Biol. 2015. PMID: 26092784 Review.
-
Graph-based pan-genomes: increased opportunities in plant genomics.J Exp Bot. 2023 Jan 1;74(1):24-39. doi: 10.1093/jxb/erac412. J Exp Bot. 2023. PMID: 36255144 Review.
Cited by
-
Fungal wood-degrading enzymes in esca-diseased grapevine and effects of carbohydrate environment on fungal development.Arch Microbiol. 2023 Apr 15;205(5):194. doi: 10.1007/s00203-023-03544-6. Arch Microbiol. 2023. PMID: 37061655
-
Advances in grape and pathogen genomics toward durable grapevine disease resistance.J Exp Bot. 2025 Aug 5;76(11):3059-3070. doi: 10.1093/jxb/erae450. J Exp Bot. 2025. PMID: 39487719 Free PMC article. Review.
-
Virulence and Host Range of Fungi Associated With the Invasive Plant Ageratina adenophora.Front Microbiol. 2022 Apr 26;13:857796. doi: 10.3389/fmicb.2022.857796. eCollection 2022. Front Microbiol. 2022. PMID: 35558123 Free PMC article.
-
Fitness Cost of Aflatoxin Production in Aspergillus flavus When Competing with Soil Microbes Could Maintain Balancing Selection.mBio. 2019 Feb 19;10(1):e02782-18. doi: 10.1128/mBio.02782-18. mBio. 2019. PMID: 30782658 Free PMC article.
-
Pan-Genomic and Transcriptomic Analyses of Marine Pseudoalteromonas agarivorans Hao 2018 Revealed Its Genomic and Metabolic Features.Mar Drugs. 2022 Mar 31;20(4):248. doi: 10.3390/md20040248. Mar Drugs. 2022. PMID: 35447921 Free PMC article.
References
LinkOut - more resources
Full Text Sources
Other Literature Sources
Miscellaneous